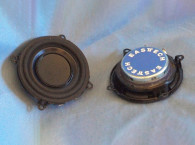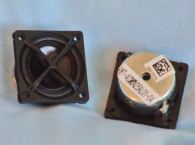

The Scan-Speak 5F/8422T01 is a 2” diameter full-range driver built on a proprietary injection-molded polymer frame that is fully vented below the spider mounting shelf for enhanced cooling. The cone assembly consists of a one piece cone/dustcap suspended with a foam surround and a black cloth flat spider (damper). For a 2” driver, the 5F/8422T01 has a rather large 26-mm diameter voice coil wound with round copper wire on a titanium former, terminated to opposite mounted solderable terminals.
Driving the cone assembly is a neodymium motor with a neodymium ring magnet rather than a slug and a polished milled return cup. A large 15-mm diameter pole vent provides additional cooling. In the 5F/8422T01 literature, Scan-Speak notes that the frame is made in Denmark and all its soft parts are European.
To begin testing, I used the LinearX LMS analyzer and VIBox to create voltage and admittance (current) curves with the driver clamped to a rigid test fixture in free-air at 0.3, 1, 3, and 6 V. I discarded the 6-V curves as too nonlinear for LEAP 5 to get a good curve fit. As is Test Bench’s protocol, I no longer use a single added mass measurement. Instead I use actual measured mass, and the manufacturer’s measured Mmd data. Next, I post-processed the six 550-point stepped sine wave sweeps for each of the 5F/8422T01 samples and divided the voltage curves by the current curves (admittance) to produce the impedance curves, which were phase generated by the LMS calculation method. I imported them along with the accompanying voltage curves to the LEAP 5 Enclosure Shop software.
Since most T-S data provided by OEM manufacturers is produced using either a standard method or the LEAP 4 TSL model, I additionally created a LEAP 4 TSL model using the 1 V free-air curves. I selected the complete data set, the multiple voltage impedance curves for the LTD model, and the 1-V impedance curve for the TSL model in LEAP 5’s transducer derivation menu to create the parameters for the computer box simulations. Figure 1 shows the 1 V free-air impedance curve. Table 1 compares the LEAP 5 LTD, the TSL data, and the factory parameters for the 5F/8422T01 samples.
The 5F/8422T01’s LEAP TSL parameter calculation results were similar to the factory data, while the QTS for the LTD multivoltage parameters exhibited a somewhat higher number. However, I followed my usual protocol and used the LEAP LTD parameters to set up computer enclosure simulations for Sample 1. I programmed two computer enclosure simulations into LEAP—a 60-in3 sealed-box alignment (with 50% damping material in the box) and a 112-in3 Chebychev/Butterworth-type vented alignment tuned to 55 Hz (with 15% damping material in the box).


Figure 2 shows the 5F/8422T01’s results in the two box simulations at 2.83V and at a voltage level sufficiently high enough to increase cone excursion to 2.3 mm (XMAX + 15%). This produced a F3 frequency of 93 Hz with a box/ driver QTC of 0.87 for the 60-in3 sealed enclosure and –3 dB = 74 Hz for the 112-in3 vented simulation. Increasing the voltage input to the simulations until the maximum linear cone excursion was reached resulted in 85 dB at 4.2 V for the sealed enclosure simulation and 86.5 dB with the same 4.2-V input level for the vented enclosure. Figure 3 and Figure 4 show the 2.83-V group delay curves and the 4.2-V excursion curves, respectively.


Turnmire performed the 5F/8422T01’s Klippel analysis, which produced the Bl(X), KMS(X), and Bl and KMS symmetry range plots shown in Figures 5–8. Figure 5 shows the 5F/8422T01’s Bl(X) curve is relatively broad and symmetrical, especially for a short XMAX 2” diameter driver. Figure 6 shows a minor 0.25-mm coil-out (forward) offset at the rest position that decreases to 0.19 mm at the driver’s physical 2-mm XMAX, which probably is within this product’s assembly tolerance.
Figure 7 and Figure 8 show the KMS(X) and KMS Symmetry Range curves for the Scan-Speak full-range driver. The KMS(X) curve is fairly symmetrical, and also has a very minor forward (coil-out) offset of less than 0.05 mm at the rest position, increasing to likewise not significant 0.22 mm at the physical XMAX position. I used the Klippel analyzer to calculate the 5F/8822T01’s displacement limiting numbers, which were XBl at 82% (Bl is 1.8 mm) and the crossover at 75% CMS minimum was 3.2 mm. The numbers indicated that Bl is the 5F/8822T01’s most limiting factor for a 10% prescribed distortion level.


Figure 9 shows the 5F/8822T01’s inductance curve Le(X). Inductance will typically increase in the rear direction from the zero rest position as the voice coil covers more pole area. However, the 5F/8822T01’s inductance variation is only 0.04 mH from the in and out XMAX positions, which is very good.
Next I mounted the 5F/8822T01 in an enclosure with a 4” × 9” baffle filled with damping material (foam). I set the Linear LMS analyzer to a 100-point gated sine wave sweep to measure the transducer on- and off-axis from 300 Hz to 40 kHz frequency response at 2.83 V/1 m. Figure 10 shows the 5F/8822T01’s on-axis response, which indicates a smoothly rising response to about 1.5 kHz, increasing to roughly 7 dB out to 10 kHz.
One mistake designers make is not equalizing the upper rise. If you do not, it makes the speaker sound thin and lack bottom end. The trade-off is that the device’s apparent loudness decreases. Some of these small two-driver Bluetooth devices have closely mounted woofers with no possibility of any stereo phantom center. One solution is to drive them in parallel as a mono source. This increases the product efficiency by 3 dB.
Figure 11 shows the on- and off-axis frequency response at 0°, 15°, 30°, and 45°. The roll-off at 30° off-axis is almost as good as a 1” dome, so I would expect this driver’s full-range fidelity to be quite good. Figure 12 shows the 5F/8822T01’s two-sample SPL comparison with a close match to within less than 1 dB throughout the operating range.
I used the Listen SoundCheck AmpConnect analyzer with the 0.25” SCM microphone and the power supply to measure distortion and generate time-frequency plots. For the distortion measurement, I rigidly mounted the 5F/8822T01 in free-air and used a noise stimulus to set the SPL to 94 dB at 1 m (7.2 V). Next, I measured the distortion with the microphone placed 10 cm from the dust cap. This produced the distortion curves shown in Figure 13. I used SoundCheck to get a 2.83 V/1 m impulse response and imported the data into Listen’s SoundMap time/frequency software. Figure 14 shows the CSD waterfall plot. Figure 15 shows the Wigner-Ville plot. While this Scan-Speak 2” full-range driver’s intended applications are TV, multimedia, and lifestyle speakers, I think the 5F/8822T01 would make a great driver for line-source applications. For more information on this well-crafted driver, visit www.scan-speak.dk


This article was originally published in Voice Coil, October 2013.


