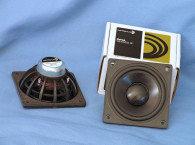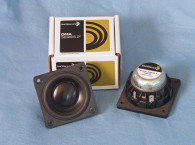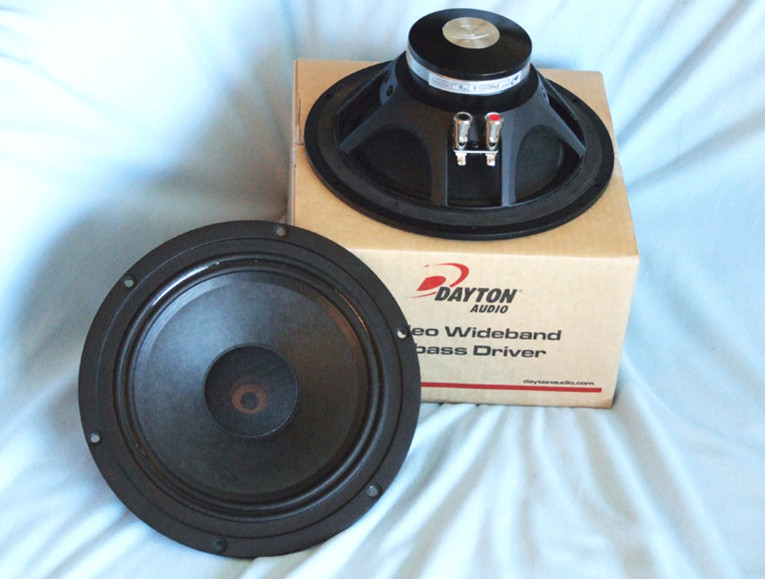
The PM220-8’s features are similar to the PS220. Starting with the frame, the PM220-8 utilizes a cast aluminum frame incorporating six 5-mm diameter, round vent holes in the area below the spider-mounting shelf for enhanced voice coil cooling as well as providing a heatsink for the neodymium motor. The cone assembly consists of a lightweight Kevlar-coated curvilinear paper cone along with a porous screen-type dust cap intended to decouple the high frequency that emanates at the cone’s center.
Compliance is provided by an “M”-shaped pleated coated cloth surround, making the format similar to a high-efficiency pro sound driver. This was done to make the driver easier to drive with low-watt Class A amplifiers (e.g., single-triode tube designs), which is also a favorite among full-range single-driver loudspeaker fans. Its remaining compliance comes from a 4”-diameter flat cloth spider.
The PM220-8’s motor design has all the right bells and whistles (due in part to Turnmire’s transducer consulting work) including an undercut T-pole with a copper cap plus a separate shorting ring. The neodymium ring magnet motor was finite element analysis (FEA)-designed using a 25.4 mm (1”) diameter voice coil with copperclad aluminum wire wound on a nonconducting polyimide former. The motor parts, the T-yoke, and the front plate are coated with a black heat-emissive coating for improved cooling. No other vents (e.g., pole or peripheral back plate vents) were used. Last, the voice coil is terminated to a pair of satin-nickel color-coated push terminals. Cosmetically speaking, this is good-looking driver.
I began the PM220-8’s analysis using the LinearX LMS analyzer and VIBox to create both voltage and admittance (current) curves with the driver clamped to a rigid test fixture in free air at 0.3, 1, 3, 6, and 10 V. The 10-V curves were discarded as they were too nonlinear for LEAP 5 to achieve a good curve fit. As has become the protocol for Test Bench testing, I no longer use a single added-mass measurement. Instead, I use the physically measured Mmd data (9.45 g for the PM220-8).
Next, I post-processed the eight 550-point stepped sine wave sweeps for each PM220-8 sample and divided the voltage curves by the current curves (admittance) to derive impedance curves. I used the LMS calculation method to add the phase. I imported the data along with the accompanying voltage curves to the LEAP 5 Enclosure Shop software. Because the majority of OEM manufacturers generate their T-S data using either the standard model or the LEAP 4 TSL model, I also used 1 V free-air curves to create a LEAP 4 TSL parameter set.
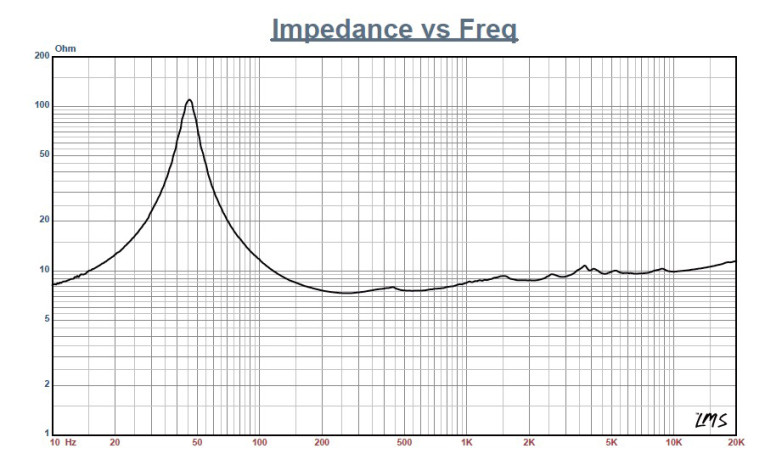
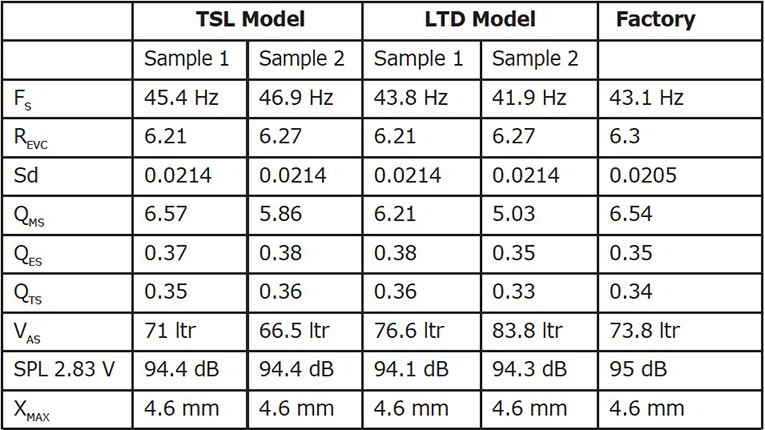
I used LEAP 5’s transducer parameter derivation menu to select the complete data set, the multiple voltage impedance curves for the LTD model (see Figure 1 for the 1 V free-air impedance curve), and the 1 V impedance curve for the TSL model and created the parameters for the computer box simulations. Table 1 compares the LEAP 5 LTD data, TSL data, and the factory parameters for both of Dayton Audio PM220-8 samples.
The PM220-8’s LEAP parameter calculation results were similar to the factory’s published data. I followed my usual protocol and used the LEAP LTD parameters to set up the computer enclosure simulations for Sample 1. I programmed two computer box simulations into LEAP 5, one sealed box with a 0.84-ft3 volume (50% fill material) and a QB3 vented enclosure with a 1.3-ft3 volume tuned to 48 Hz, simulated with 15% fiberglass damping material.
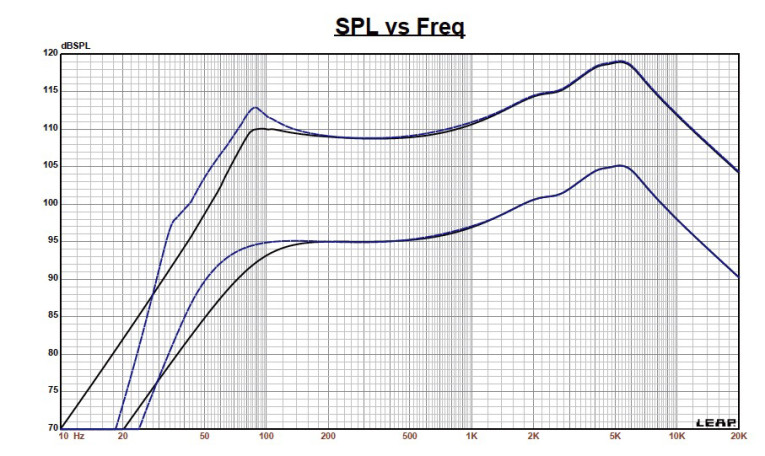
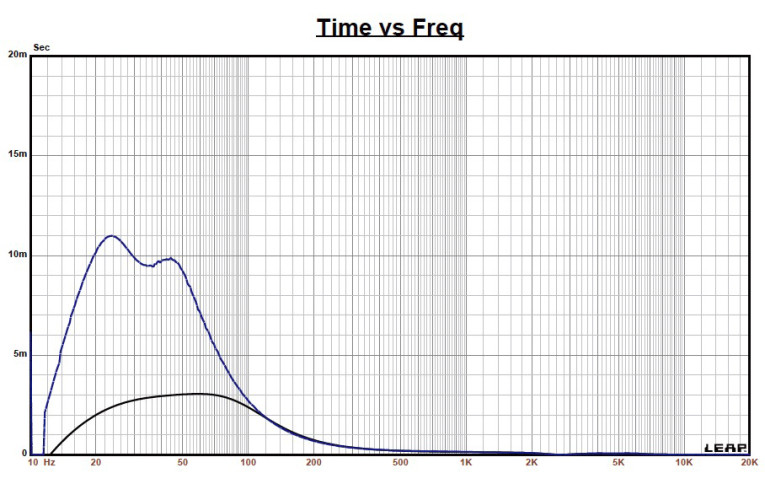
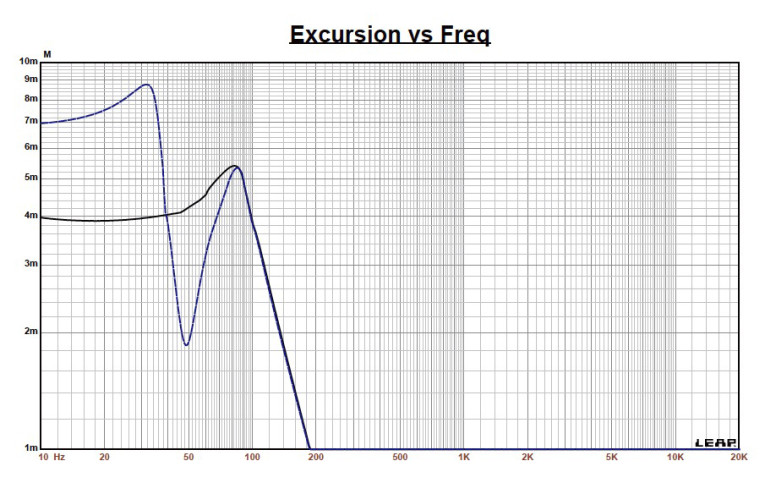
Figure 2 displays the PM220-8’s results in the two enclosures at 2.83 V and at a voltage level sufficiently high enough to increase 5.3-mm cone excursion (XMAX + 15%). This produced a 86.7-Hz F3 frequency (F6 = 66.6 Hz) for the sealed box enclosure and –3 dB = 59.4 Hz (F6 = 47.8 Hz) for the EBS-vented simulation.
Increasing the voltage input to the simulations until it reached the maximum linear cone excursion resulted in 110 dB at 20 V for the closed-enclosure simulation and 112 dB at the 21-V input level for the larger vented box. Figure 3 and Figure 4 show the 2.83 V group delay curves and the 20 V/21 V excursion curves.
Turnmire performed the Klippel analysis for the Dayton 8” full-range, which produced the Bl(X), KMS(X), and Bl and KMS symmetry range plots shown in Figures 5–8. The PM220-8’s Bl(X) curve is nicely symmetrical, with a small amount of offset (see Figure 5). The Bl symmetry plot shows a trivial 0.27-mm coil-out offset at the rest position increasing to a likewise trivial 0.54-mm coil-out offset at the physical XMAX position that stays constant throughout the driver’s remaining operating range (see Figure 6).
Figure 7 and Figure 8 show the PM220-8’s KMS(X) and KMS symmetry range curves. The KMS(X) curve is not so symmetrical in both directions and has an obvious offset. The KMS symmetry range plot shows a 1.7-mm coil-out offset at rest staying more or less constant out to the physical XMAX where it decreases slightly to 1.6 mm.
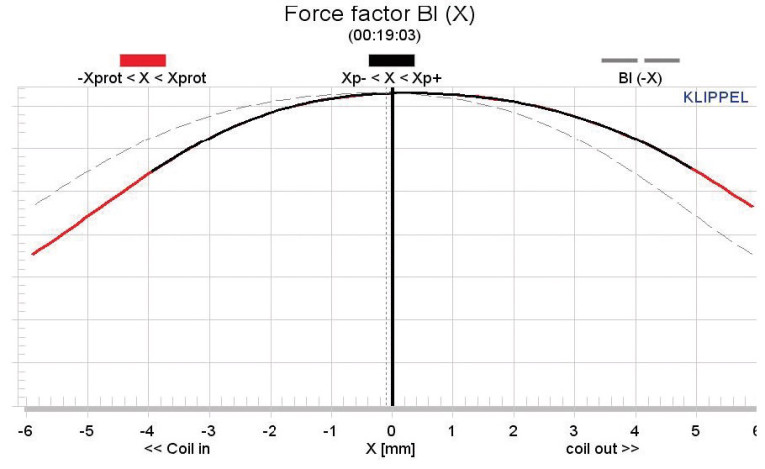

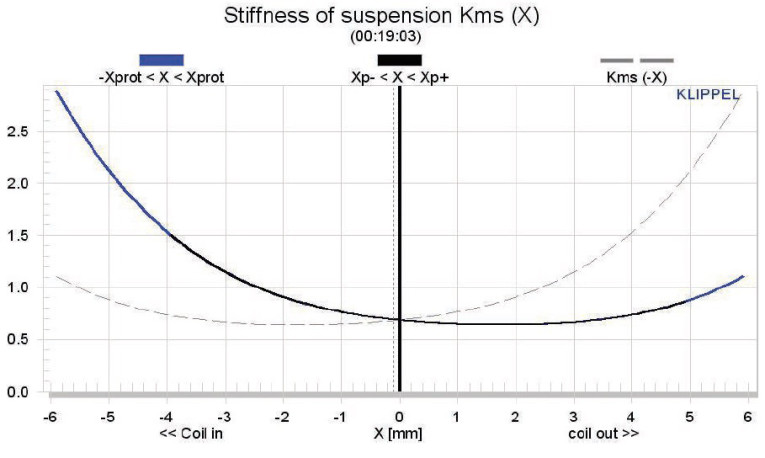
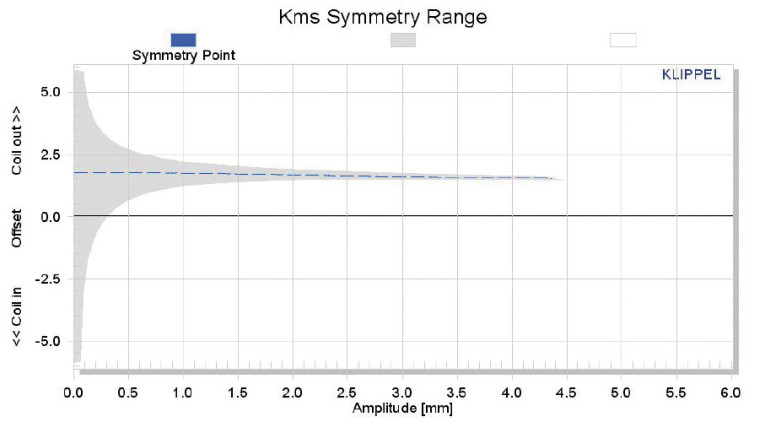
This behavior is typical of M-shaped cloth surrounds, and really not much of an issue. This type of displacement is not audible, and should not be considered a problem for this driver. The PM220-8’s displacement-limiting numbers, calculated by the Klippel analyzer, were XBl at 82% (Bl = 3.3 mm) and for a crossover at 75%, the CMS minimum was 2 mm, which means the PM220-8’s compliance is the most limiting factor for the prescribed distortion level of 10%.
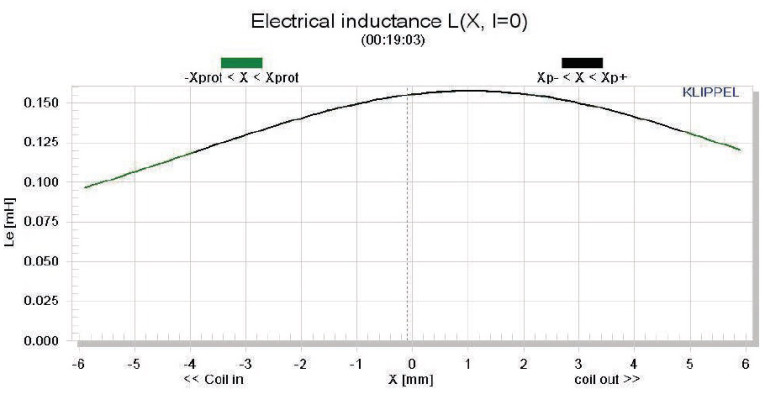
Figure 9 shows the PM220-8’s inductance curves L(X). Inductance will typically increase in the rear direction from the zero rest position as the voice coil covers more pole area. However, with a copper cap and aluminum shorting ring installed in the PM220-8, the inductance swing for this driver is a really low 0.023 mH, which is excellent performance.
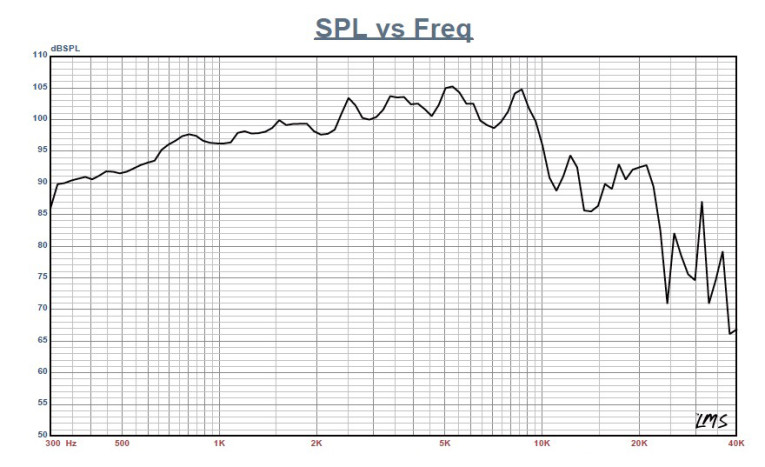
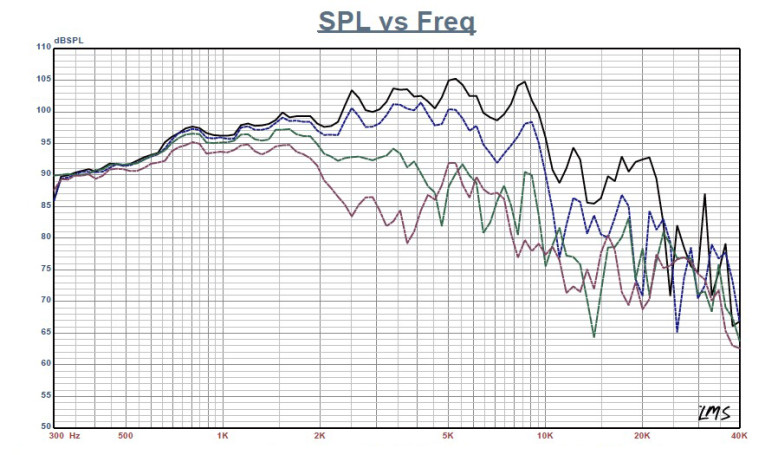
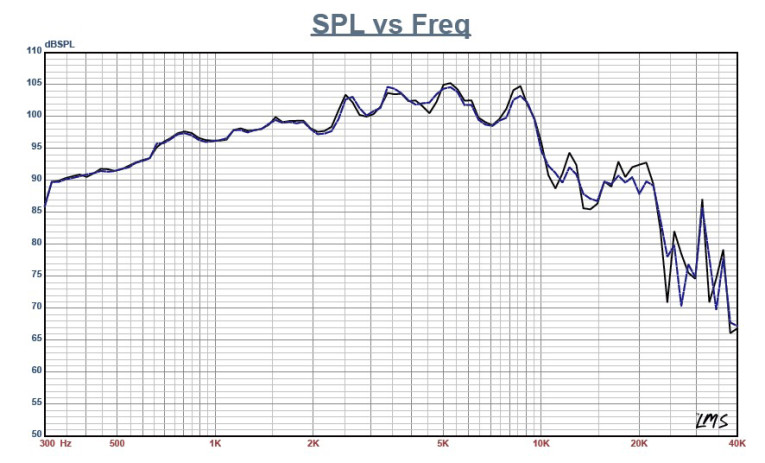
Next, I mounted the PM220-8 in an enclosure that had a 8” × 15” baffle filled with damping material (foam). Then I used the LinearX LMS analyzer set to a 100-point gated sine wave sweep to measure the device under test (DUT) on- and off-axis from a 300-Hz-to-40-kHz frequency response at 2.83 V/1 m. Figure 10 shows the PM220-8’s on-axis response, indicating a smoothly (±2 to 2.5 dB) rising response to about 10 kHz. Figure 11 shows the on- and off-axis frequency response at 0°, 15°, 30°, and 45°, which is typical for an 8” woofer. Even though this is a “wideband” device, it still has the directivity of any other 8” piston, so crossover frequencies above 2 kHz will degrade a system’s power response. Figure 12 shows the two-sample SPL comparisons for the 8” Dayton driver, with a close match throughout the operating range.
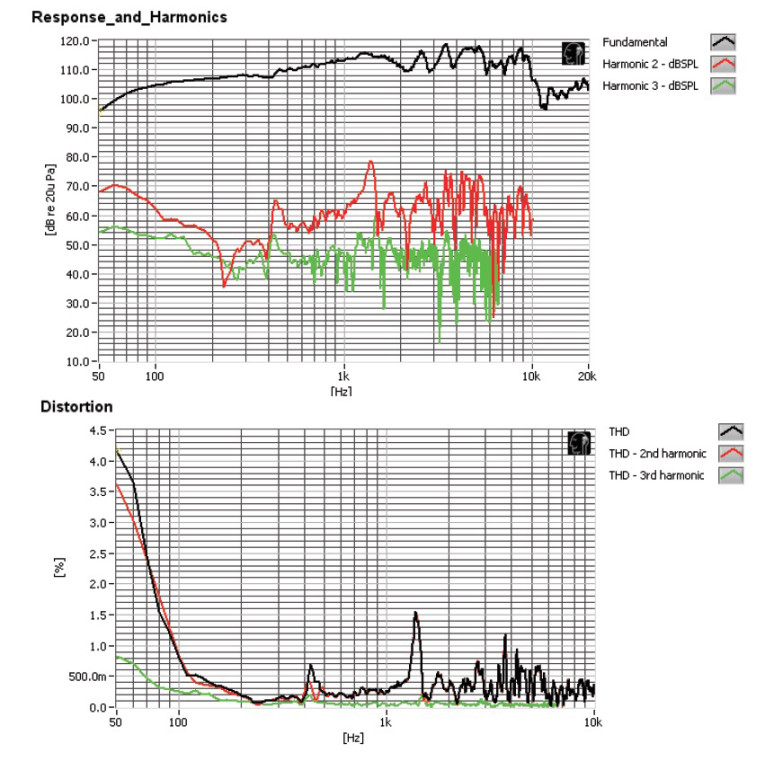
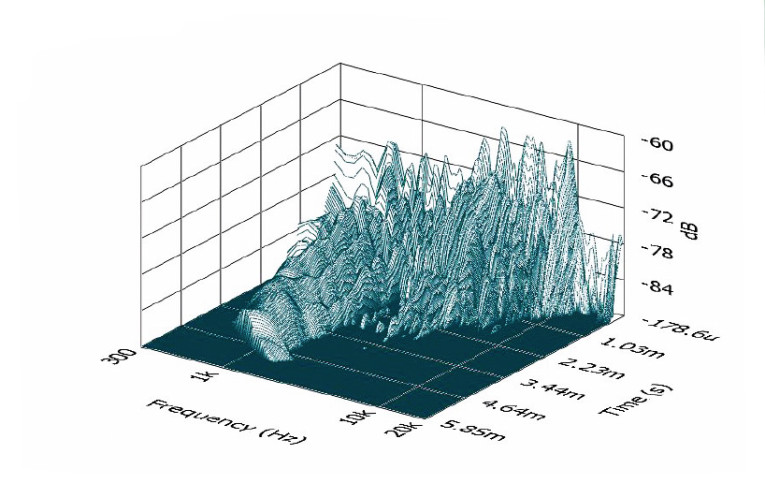
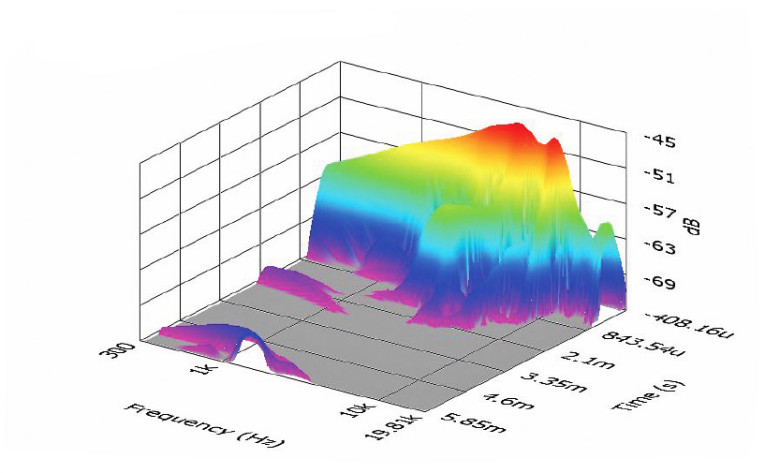
For the PM220-8’s remaining tests, I used the Listen SoundCheck AmpConnect analyzer and SCM microphone to measure distortion and generate time-frequency plots. For the distortion measurement, I mounted the 8” full-range driver rigidly in free air and used a pink noise stimulus to set the SPL to 94 dB at 1 m (1.7 V). Then I used the Listen microphone placed 10 cm from the driver to measure the distortion. This produced the distortion curves shown in Figure 13. I used SoundCheck to get a 2.83 V/1 m impulse response and imported the data into Listen’s SoundMap time-frequency software. Figure 14 shows the resulting CSD waterfall plot. Figure 15 shows the Wigner-Ville plot. For more information, visit www.daytonaudio.com.
This article was originally published in Voice Coil, September 2013.