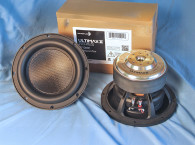
Measurement of the new L22ROY2 8” subwoofer commenced using the LinearX LMS analyzer and the Physical LAB IMP Box (the same type of fixture as a LinearX VI Box) to measure both voltage and admittance (current). Sweeps were generated in free air at 0.3V, 1V, 3V, 6V, 10V, 15V, 20V, and 30V. The L22ROY2 remained linear through 30V and probably would have to 40V, but I chose to stop the measurement sequence at 30V since that was sufficient to provide good results in the LEAP 5 LTD model.
I used the measured Mmd that was provided by SEAS rather than a single 1V added (delta) mass measurement. It should also be noted that this multi-voltage parameter test procedure includes heating the voice coil between sweeps for progressively longer periods to simulate operating temperatures at that voltage level (raising the temperature to the first- and second-time constants). The 16 sine wave sweeps for each woofer were further processed with the voltage curves divided by the current curves to produce impedance curves. Phase curves were generated using the LEAP phase calculation routine, after which the impedance magnitude and phase curves plus the associated voltage curves were then copy/pasted into the LEAP 5 Enclosure Shop software’s Guide Curve library. This data was then used to calculate parameters using the LEAP 5 LTD transducer model.
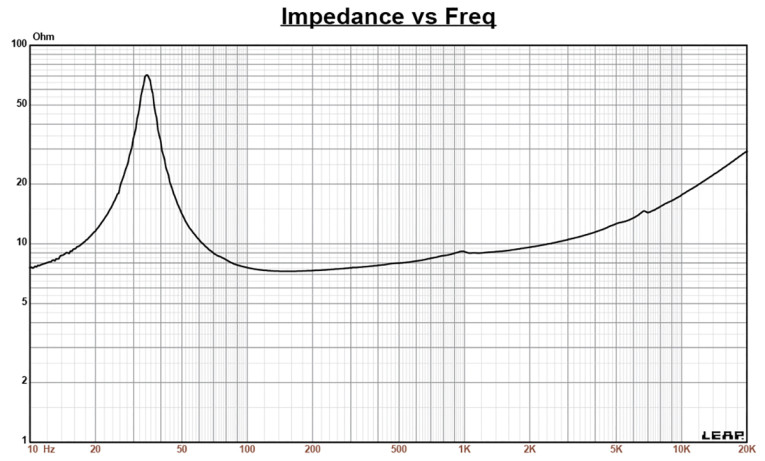
Because most all manufacturing data is being produced using either a standard transducer model or the LEAP 4 TSL model, I also generated LEAP 4 TSL model parameters using the 1V free air that can also be compared with the manufacturer’s data. Figure 1 shows the L22ROY2 1V free-air impedance plot. Table 1 compares the LEAP 5 LTD and LEAP 4 TSL Thiele-Small (T-S) parameter sets for both SEAS L22ROY2 driver samples along with the SEAS factory data.
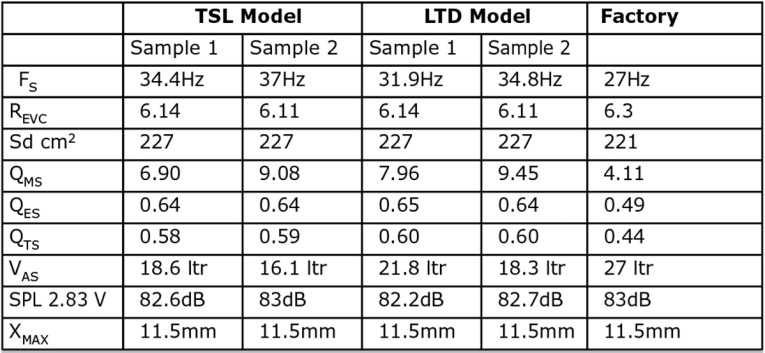
From the comparative data shown in Table 1, you can see that all four parameter sets for the two samples were reasonably similar, but do not appear to correlate well with the factory data. I compared the factory data to the measured data and in a sealed box simulation, the -3dB down frequencies were within a couple Hertz, as the Fs/Qt ratios were reasonably close. However, Qtc was 0.7 for the measured data and below 0.6 for the factory data, which is probably due to the difference in Vas.
SEAS is one of the better OEMs in the high-end driver business, so I’m guessing this is possibly either a misprint, or just the result of it being preliminary data on a new transducer. Either way, my T-S parameter measurements produced very usable results when I went ahead with the enclosure simulations.
Following my normal protocol for Test Bench testing, I used the sample 1 LEAP 5 LTD parameters. SEAS description of the L22ROY2 states that this transducer is intended for either sealed box or transmission line applications, and since I do not have transmission line simulation software that I consider accurate, I proceeded to set up a single sealed box computer simulation in a 0.9ft3 Butterworth-type sealed enclosure with 50% fill material (fiberglass).
Figure 2 gives the results for the SEAS L22ROY2 in the sealed enclosure at 2.83V and at a voltage level sufficiently high enough to increase cone excursion to Xmax+15% (13.2mm for L22ROY2). This resulted in an F3 of 41Hz (-6dB=36.4Hz) with a Qtc=0.71. This is very good performance, and with the high Xmax available, using DSP to boost this down to between 25Hz to 30Hz should be doable.
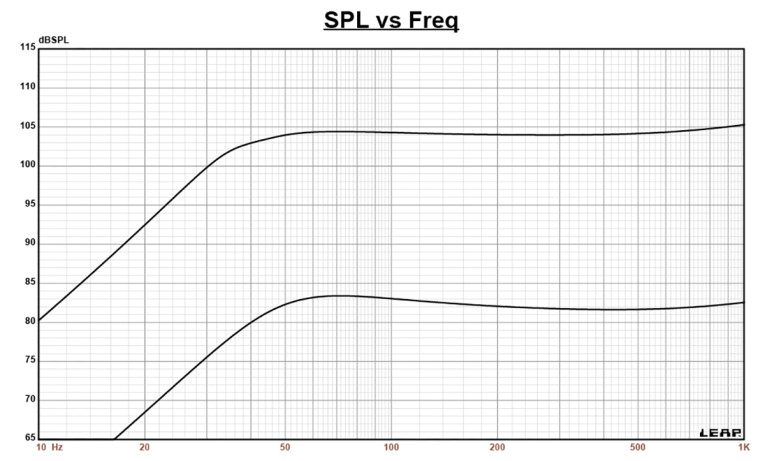
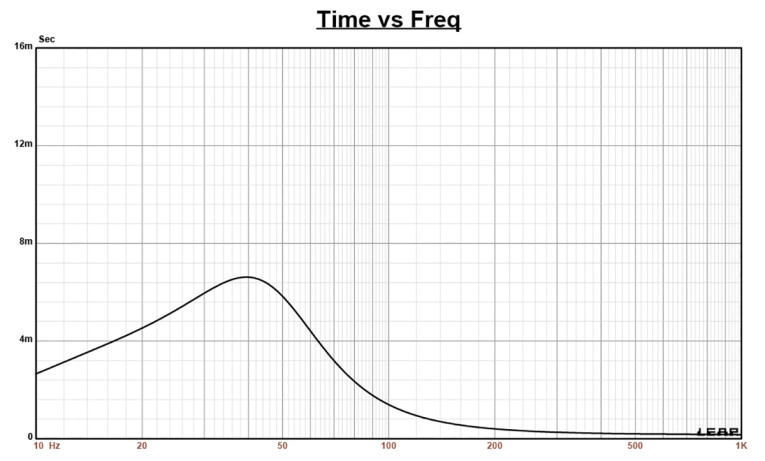
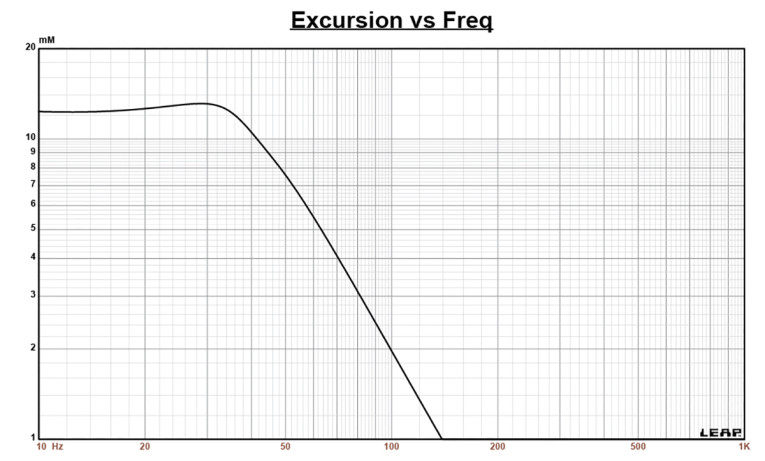
Increasing the voltage input to the simulations until the approximate Xmax+15% maximum linear cone excursion point was reached resulted in 104.5dB at 43V for the sealed enclosure. Figure 3 shows the 2.83V group delay curve. Figure 4 shows the 43V excursion curve. Using two L22ROY2s in parallel and on opposite sides of a 1.8ft3 enclosure, would produce 110.5dB at 43V, which would provide excellent performance in a typical home listening room.
Klippel analysis for the SEAS 8” subwoofer was performed by Warkwyn’s Jason Cochrane using the Klippel KA3 analyzer and he produced the Klippel data graphs given in Figures 5–7. The Bl(X) curve for L22ROY2 (Figure 5) is rather broad and mostly symmetrical typical (with a small amount of “tilt”) of a driver with a relatively high Xmax. The Bl symmetry curve (Figure 6) shows 0.70mm Bl coil-in (rearward) offset once you reach an area of reasonable certainty at 9mm excursion, decreasing to a not particularly significant 0.49mm rearward offset at the physical 11.5mm physical Xmax position and beyond.
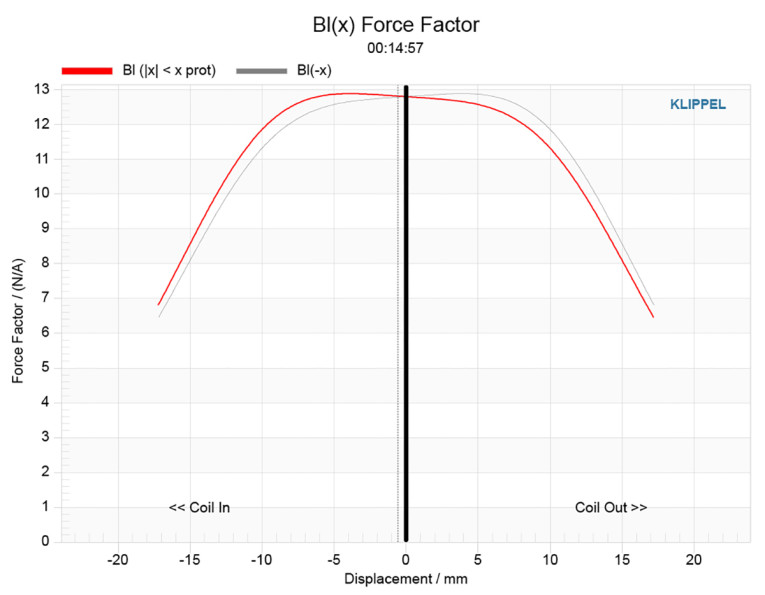
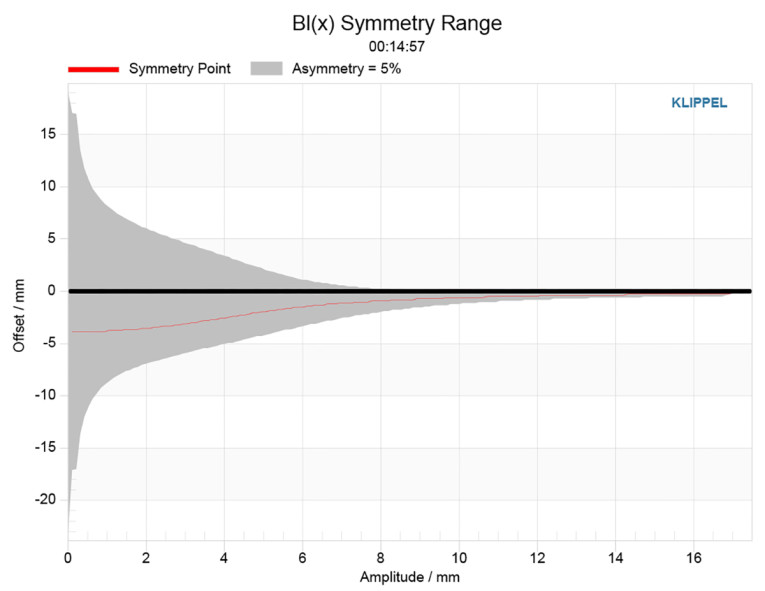
Figure 7 depicts the Kms(X) curve, where obviously the analyzer was unable to resolve the compliance. This happens when it is obvious to the operator, Jason Cochrane at Warkwyn in this case, that driving the transducer any harder to resolve the compliance would likely create enough heat to cause thermal failure (burn up the driver).
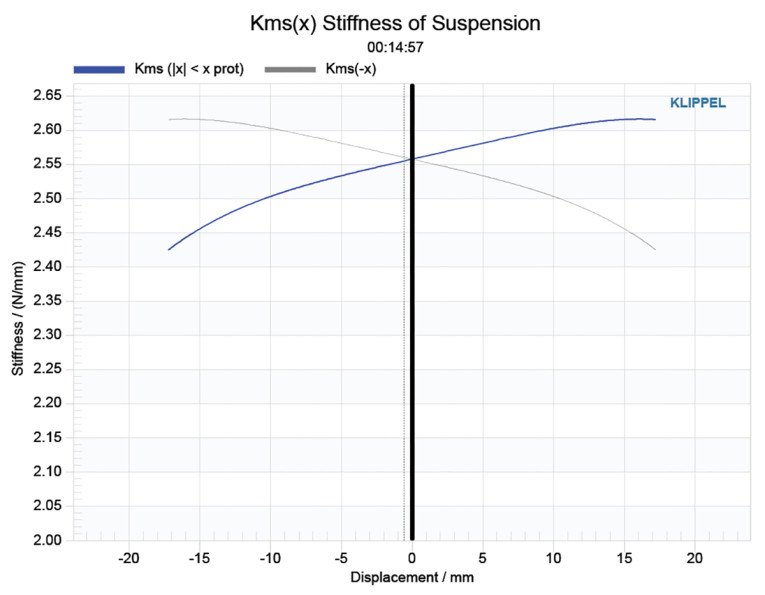
This sometimes happens with drivers that have enormous compliance excursion capabilities such as the L22ROY2 (46mm peak to peak), and in terms of Klippel analysis, end up being thermally limited before the compliance numbers can be resolved. This doesn’t happen all that often, but it does occur sometimes, and it is not a fault in the driver, just the particular mix of design tradeoffs. As such, there is no point in looking at the Kms symmetry curve, since the Kms curve did not resolve.
Displacement limiting numbers calculated by the Klippel analyzer for the L22ROY2 using the subwoofer criteria for Bl was XBl @ 70% (Bl dropping to 70% of its maximum value) equal to 11.6mm for the prescribed 20% distortion level (the criterion for subwoofers), which is just slightly above the 11.5mm Xmax of the driver. Again, since the compliance did not resolve, the XC number is not relevant.
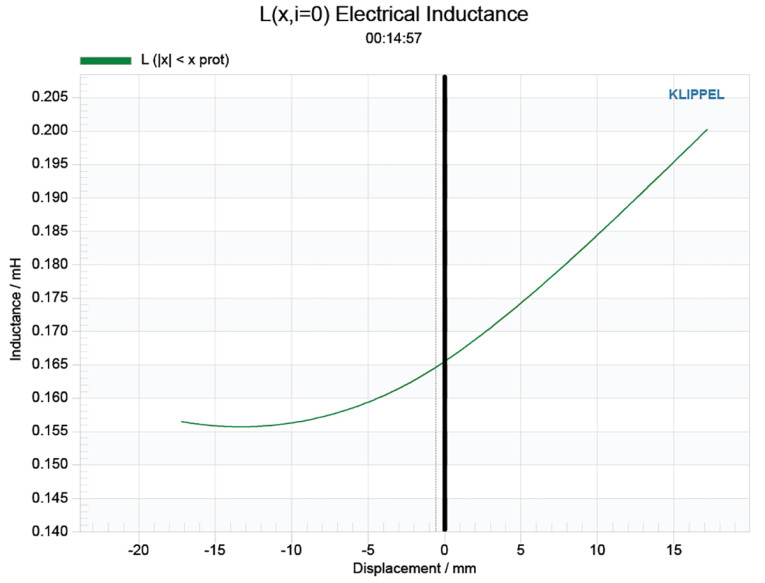
Figure 8 gives the inductance curve Le(X) for this transducer. Motor inductance will typically increase in the rear direction from the zero-rest position as the voice coil covers more of pole, which is not what you see in the graph and due to the dual shorting ring layout. It’s easy to see the benefit of the dual copper and aluminum shorting rings with inductance only varying a maximum 0.009mH to 0.022mH in either direction, which is very minimal inductance change for such a large motor and certainly very good inductive performance.
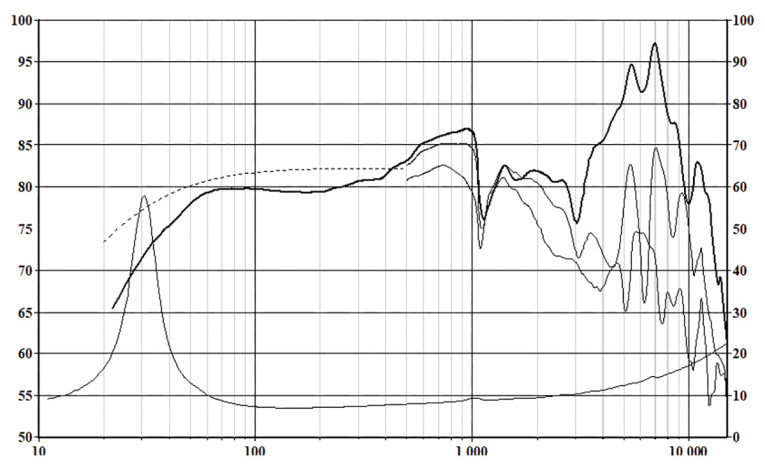
Generally speaking, I do not provide SPL and time domain measurements on subwoofers, as their upper range is generally not greater than 100Hz to 200Hz. Instead, you can see the factory-generated SPL curve shown in Figure 9.
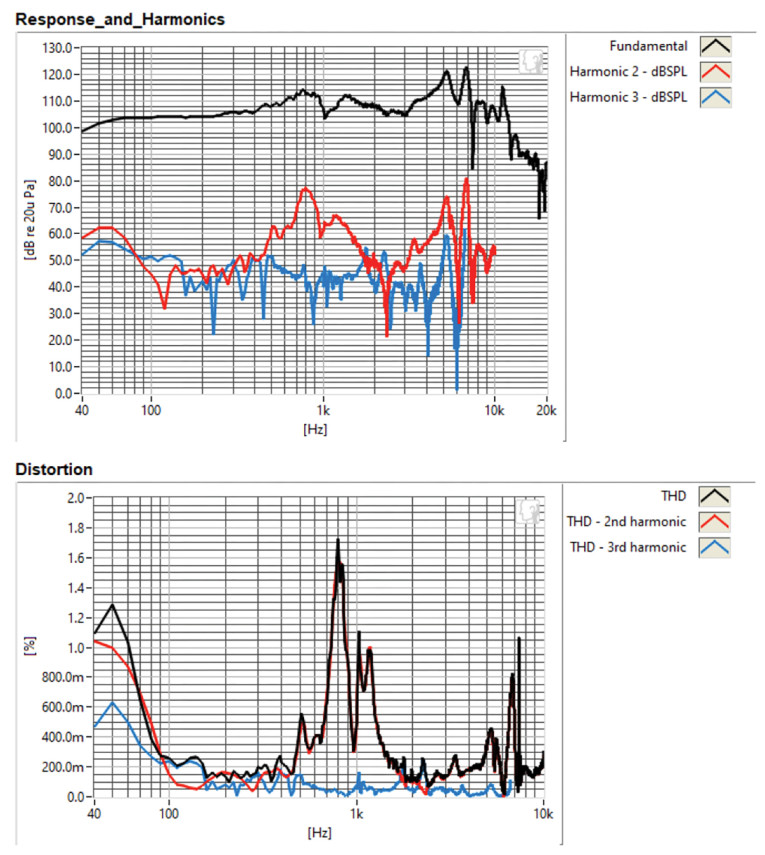
For the last text procedure, I fired up the Listen SoundCheck analyzer using AudioConnect hardware, SoundCheck 21 software, and the Soundcheck SM3 ¼” microphone (all courtesy of Listen, Inc.) to perform distortion analysis. For distortion measurements, I set the voltage level with the driver rigidly mounted in free air and increased the voltage until it produced a 1m SPL of 94dB (8.28V) (94dB is my SPL standard for home audio drivers, with 104dB for pro audio transducers). Then, I made the distortion measurement with the microphone placed near field about 10cm from the dust cap.
This plot is shown in Figure 10. As can be seen, this includes two plots — the top graph being the standard fundamental SPL curve with the second and third harmonic curves, and the bottom graph the second and third harmonic curves plus the THD curve with an appropriate X-axis scale. Interpreting the subjective value of THD distortion curves is difficult and opinions vary considerably in the industry. However, looking at the relationship of the second to third harmonic distortion curves is of value, and in this case, third-order harmonic distortion is quite low.
Although there were a couple of hiccups in this analysis of the L22ROY2, it’s obvious that the L22ROY2 is a very high performing 8” subwoofer. And coming from one of the premier high-end OEM driver manufacturers, SEAS Fabrikker, the build quality is excellent. For more information, visit www.seas.no. VC
This article was originally published in Voice Coil, September 2023.