In the first part of the article series, we discussed some “super regulator” designs and the performance we might expect from them. Here we continue by searching for the elusive unicorn of an accurate measurement by examining various measurement techniques.
Test Fixtures
The ripple measurement starts with a regulator input power source that combines a DC voltage with an AC sine wave ripple riding on it. Given a regulator that floats on a reference signal, what better way to get a sine+DC than float the regulator on a sine wave?
Referring to Figure 1, see how VACDC will conveniently give the AC+DC needed to test a(nother) regulator. Savvy readers are already shaking their heads with an internal “no, that doesn’t work.” And why not? Unseen on Figure 1 is the output capacitor needed to stabilize most series regulators, often in the range of 1μF to 100μF, in parallel with LOAD. Notice that this positive regulator can source current with the greatest of ease, but cannot sink it except through the load. So charge stored in the output capacitor cannot be drained away quickly enough.
Thus, the higher the frequency sine wave you attempt to get from the regulator, the more distorted is the sine wave on top of the DC output. This is also a reason you don’t want to use a positive regulator with reversed input supplies to regulate a negative voltage, which I’ve seen in schematics around the web and also in commercial products!
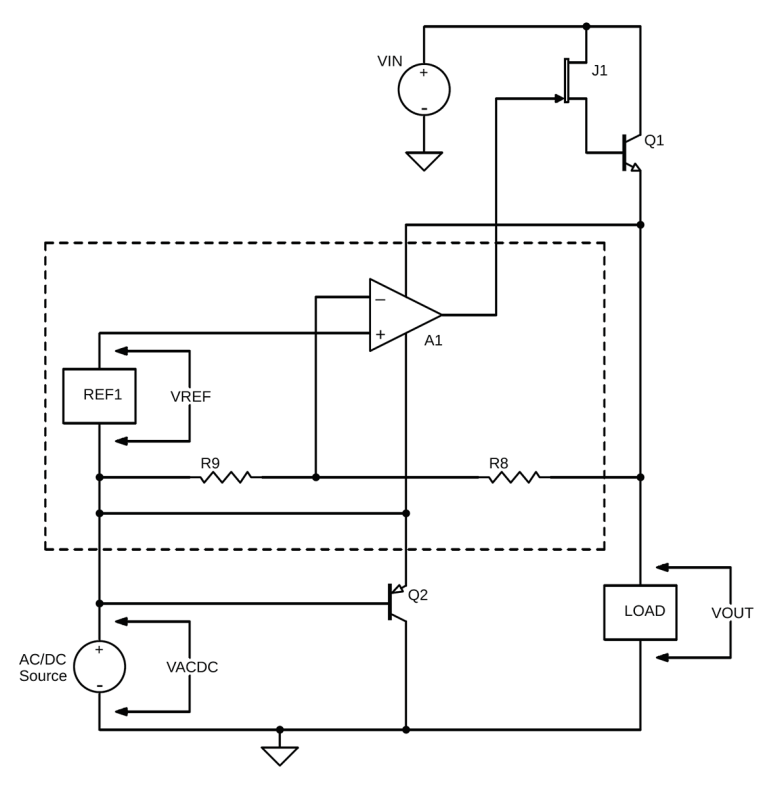
To elaborate, an output capacitor is necessary for stability in Figure 1. As built, Figure 1’s test circuit is set for VOUT=16VDC + 1VPP and 10μF capacitor (not shown) across LOAD. Maximum current to discharge the 10μF capacitor across LOAD is 16.5V/150Ω = 110mA.
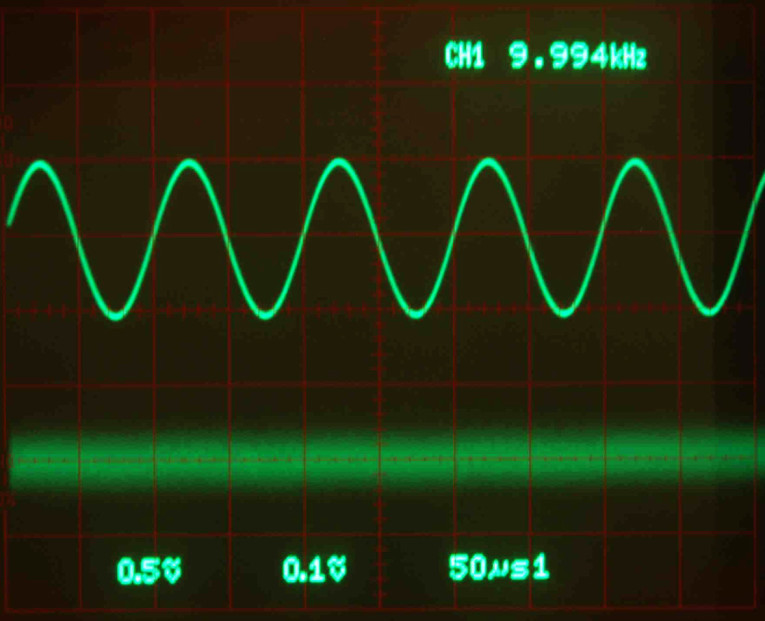
Assuming this is a constant current (it’s not, it decreases as VOUT decreases), the maximum rate of change of a sine wave will be, using i = C × (dv/dt), 110mA/10μF = 11V/ms. Plugging this into the formula for maximum rate of change of a sine wave dv/dt = Vpk2πf gives f = 11 × 103/(0.5 × 2 × π) = 3501Hz. Thus, the maximum clean sine wave we can get from this circuit is about 3500Hz, as illustrated by the clean 3kHz sine shown in Figure 2 vs. the distorted 6kHz sine shown in Figure 3.
To increase the negative discharge rate, you can increase the load current by decreasing load resistor. However, LOAD is already dissipating 1.7W, so to have a load resistor that allows, for example, a 50kHz sine wave means excessive power dissipation because the static current is about 25A. While this initially appeared to be a good idea, it’s totally impractical.
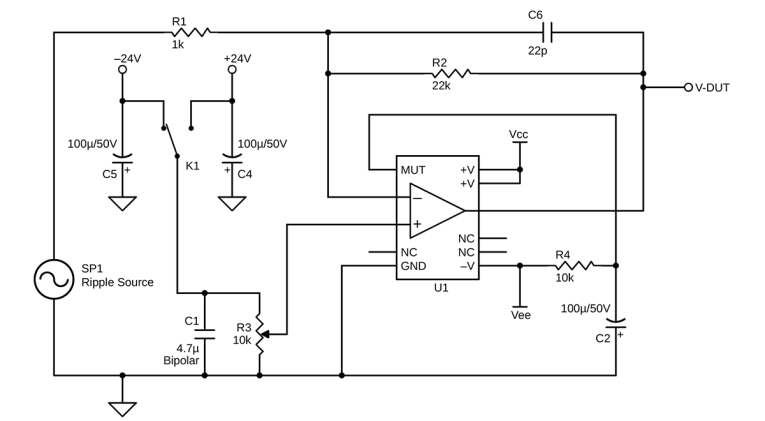
So the next iteration had a source that could move positive and negative, using an LM3886 power op-amp as seen in Figure 3. A potentiometer sets the DC level and AC is injected from SP1. The nice thing about this circuit is that with a switch it can generate either a positive or negative signal for testing either polarity regulator.


It’s been years since I used that fixture and I don’t recall all the problems. The LM3886 has limited gain-bandwidth product (typically 8MHz) and gain of 23 decreases fixture bandwidth to 350kHz, which could affect low level ripple amplitude measurements at 100kHz (see Figure 4). There was significant feedthrough as frequency increased, which may have been fixture layout or within the LM3886. It also suffered from overheating and stability problems, possibly due to poor design choices I made. There were other more global issues that I didn’t even know about that we will examine later.
Figure 5 shows measurements made for some popular regulators of 2012. The numbers represent the ratio of peak input voltage to error voltage expressed as dBV. While measurements match their datasheets relatively well, they flattened at the ~120 dBV limit of a TiePie HS3 USB oscilloscope with a 16-bit 200 mV low-range spectrum analyzer. The unicorn is not in sight when the measurement is so far from an expected higher theoretical value based on the input isolation given by the “drain+collector only” connection to Vin (as seen in Figure 4 from Part 1 of the article).

Keep in mind that 120dBV here represents 1 μV out of 1 VP input ripple. Imagine a 1,000 meter length of mostly clean string and you need to find the 1 dirty millimeter.
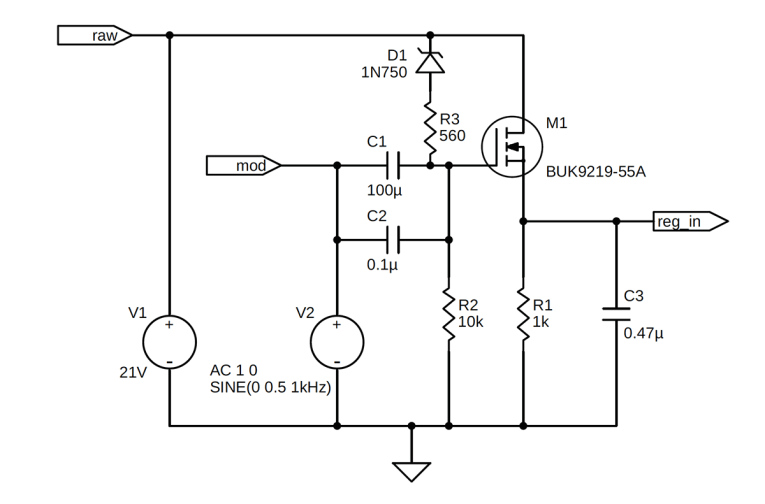
The passive source of Figure 6 uses a Zener diode D1 to provide DC offset to a high current, low threshold MOSFET that delivers the signal to the regulator under test. An AC source is capacitively coupled to the gate to add modulation. It gave results similar to what was seen with the prior fixture, especially with higher error level such as the LM7812, but not as accurate at very low error values (see Figure 7). This has TPS7A4700 error as significantly better than its datasheet. It’s probably a dual result of different measurement conditions (e.g., capacitors on the test device) and error from our measurement fixture. We found the TPS7A4700 to perform much better using a tantalum output capacitor than ceramic.
In 2018, we updated our regulator’s internal circuit to improve output impedance. With this change we also had to determine if any other performance characteristics were changed, for better or worse. Once again a decision was made to improve the power supply rejection ratio (PSRR) excitation circuit. This is an active version of the 2016 circuit, which puts a loop amplifier in control of its output and also sums the DC and AC parts of the signal (see Figure 8). It’s similar to a circuit proposed by Jim Williams for a 100 A test of voltage regulation of digital loads.[1]
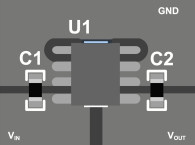
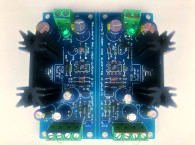
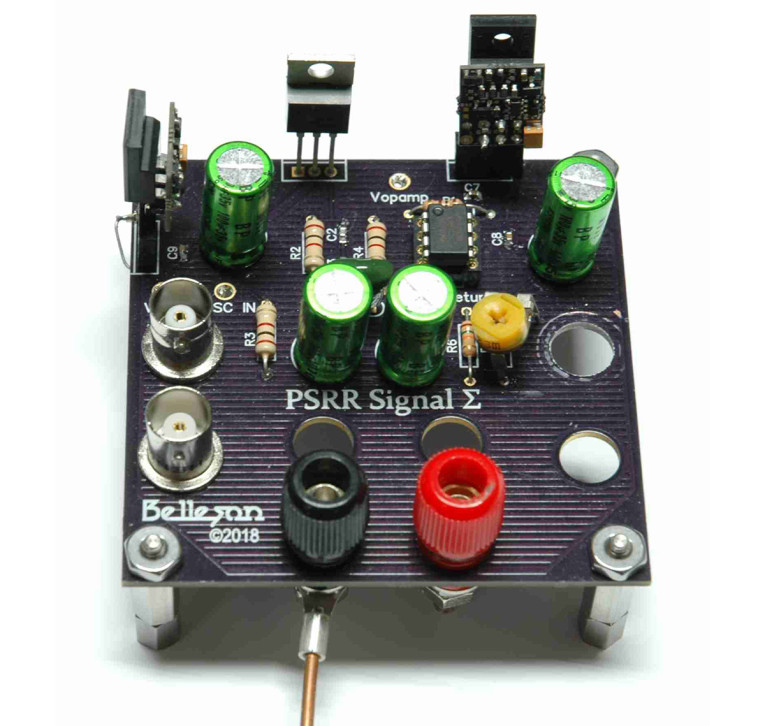
Notice the output, as shown in Figure 9, is from a high current, low on-resistance IRF3708 N-channel MOSFET driven by a loop amplifier that monitors the voltage at the output node (source of IRF3708). The op-amp forces the output to follow the AC signal injected from “Oscillator IN” terminal through C1 || C10, offset with a portion of the DC voltage from VR2 as set by R5 and R6 (which are actually a trimpot). Regulator VR1 provides a separate power source for Q1 to isolate the op amp power supply from the output current. Also notice OutReturn in the lower right, which takes the output signal current directly back to the signal ground, avoiding any mix of output current with signal return current(s) from OA1. To be sure the layout is as clean as possible it was built on a custom PCB as seen in Photo 1.


Signal Generator
All the fixtures we’ve seen show an AC source input, what is that source? And what kind of measurement errors can it introduce? Some inexpensive and available sources have characteristics that make them better or worse for this measurement. As with the summing circuit, at these low levels of measurement every signal nuance is critical. There are many variables and a full discussion is too much to cover here! There is a supplemental web article with all the detail, and we’ll present a summary of various issues here.
Several signal sources were examined, all relatively inexpensive and available through eBay or new from the manufacturer. Listed from oldest to newest, they are: the HP Model 200CD, the Wavetek Model 166, the TiePie HS3, and the Digilent Analog Discovery.
Problems introduced by these included, most prominently, signal feedthrough to either signal return (HP 200CD) or signal measurement (Tiepie HS3). The HS3 also had minor noise pickup through the USB connection, even using a separately powered USB hub. Some spectra artifacts appeared to be higher frequency components that got aliased (or “demodulated”) down into the measurement band. The AC power connection of the Wavetek had to be rearranged to prevent what could be called “hash” in the 80kHz to 100kHz range.
The Digilent has too much digitally induced noise and a significant DDS-induced skip in analog generator output for any sensitive measurement. The Tiepie HS3 internal AWG, while very good, internally injects some of its generated signal into its own oscilloscope input. In an attempt to improve its performance, I decoupled the generator ground from the oscilloscope ground by using a band saw to cut the face plate between the generator and oscilloscope connectors, with no visible improvement.
The performance of the TiePie AWG and HP200CD are exemplary, only not quite good enough for measurements of sub-microVolt ripple. Ultimately, the WaveTek 166 was the best signal source, but only if the AC plug has a ground isolator to disconnect its chassis from earth.
The Measurement Instrument
For the earlier analogy of finding a 1mm smudge on a 1,000m string, what do we use to find the smudge? A 4.5 digit multimeter should be accurate at DC, but even a true RMS meter has only limited accuracy as frequency increases. Interestingly, a RMS multimeter introduced an error signal in the spectrum analyzer at about 185Hz, presumably the frequency of integration for the DVM.
With a 2mV/div minimum range, an oscilloscope doesn’t have the necessary resolution, although with the gain of 1000x amplifier some error can be visible. Given the grounding problems we discussed, even having an oscilloscope powered during measurement affects the spectra we’re viewing. Of course, it depends on the oscilloscope. I typically use a 150MHz bandwidth analog oscilloscope with linear supplies that uses lots of AC power and transmits some garbage back into the grid.
The usual instrument of choice is a spectrum analyzer. In 1985, when John Roberts wrote his article about the Preeminent Preamp, a spectrum analyzer was tens of thousands of US dollars, but today good ones are affordable as PC-based instruments and, for low frequency, even a computer sound card can be a decent spectrum analyzer with free or inexpensive software.
The TiePie Handyscope HS3 has been a fixture at the Belleson test bench for many years. It has a great software interface with lots of functionality and mathematical analysis tools such as FFT, averaging, integration, statistical functions, and so forth. The hardware has multiple sample rates and digitizer resolutions that are software selectable, including a 16-bit resolution, ±200 mV full-scale range with AC coupling that’s very useful in our PSRR measurements.
It has two-channel input and the previously discussed AWG. There are some limitations to its measurements such as one channel slightly better than the other and some low level internal signal coupling from the AWG, when it’s active. It was used for all the FFT spectra in this article.

Increased Measurement Resolution
The digitizer resolution of 16 bits at 200mV full scale gives a maximum resolution of 3 μV (0.2/216), certainly not 10 times better than the ~100 nV ripple (0.5/10135/20) we’re attempting to measure. To sidestep this limitation, we use a 1000× amplifier to boost the low-level signal and increase the resolution to 3 nV.
The amplifier was originally built as a noise booster and, while there’s not enough editorial space for a full discussion, one important element is to design the booster with “wide enough” bandwidth to not attenuate the measured signal at either the low or high ends of the desired measurement frequency range.
What Else Can Go Wrong?
The op-amp shown in Figure 8 was originally an LF356, a fast settling high-performance JFET input op-amp from the 1980s. At some point in the analysis using the 2018 fixture, some weird artifacts were showing in the spectrum and replacing that LF356 with a low distortion LME49710 fixed it. Alas, I didn’t take any photos and can’t reproduce it now, so I can’t say if it was real or something else was happening.
Another semi-obvious problem can be fluorescent lights. Figure 10 shows a spectrum of what happens when the light over my workbench is on. Then there’s the raw DC supply we didn’t even discuss. All the measurements shown up to now use a custom built raw linear supply regulated by (what else?) our own high-performance regulators.
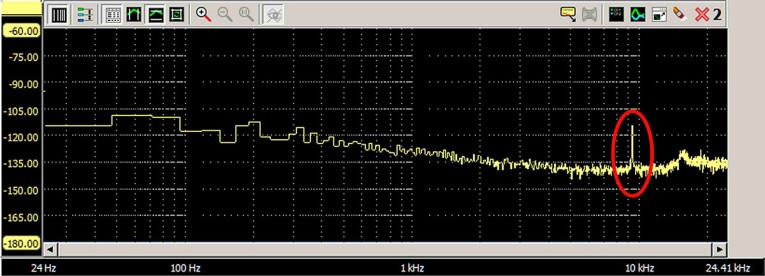
Figure 11 shows a noise floor from the test fixture when powered by an inexpensive supposedly linear supply. Note that the AC input to the test fixture is shorted to zero volts with three 50Ω BNC terminators.
There is more low frequency noise and a spike just above 9 kHz from the internal control circuit of the power supply. Again there’s no good way to know if this is actually a 9 kHz component or if it’s been aliased from some higher frequency by the digitizer.

The Search Continues
With a custom test fixture, a low noise wide bandwidth 1000× amplifier, a clean signal source, a sensitive digitizing oscilloscope with FFT spectral conversion, all instruments plugged into the correct outlets, and a new moon just over the horizon, sometimes measurements can be made to show how good the latest modern regulators can be (see Figure 12).
While ripple rejection is only one indicator of regulation quality, it’s an important one. Yet output impedance, transient load response and noise (and maybe even harmonic distortion??) are also important. Also, these measurements are made with no load. Thus, while there are unicorn footprints all around, the search continues. aX
This article was originally published in audioXpress, June 2019.
Project Files
To download additional material and files, visit the audioXpress-Supplementary-Material page
References
[1] J. Williams, A Closed-Loop, Wideband, 100 A Active Load: Brute Force Marries Controlled Speed,” Linear Technology, Application Note 133, October 2011,
www.analog.com/media/en/technical-documentation/application-notes/an133f.pdf
Resources
Belleson, LLC, www.belleson.com
”Belleson Superpower Regulator,” diyAudio,
www.diyaudio.com/forums/powersupplies/218837-belleson-superpower-regulator-heres-schematic-2.html
J. Walton, “A comparative overview of power supply designs with listening tests,” Linear Audio, Volume 4, September 2012.
Sources
Analog Discovery 2: 100 MS/S USB Oscilloscope, Logic Analyzer, and Variable Power Supply
Digilent | https://store.digilentinc.com
Handyscope HS3 USB Oscilloscope
TiePie | www.tiepie.com/en/usb-oscilloscope/handyscope-hs3
 About the Author
Brian Lowe is founder and principal engineer at Belleson LLC. His audio circuit design experience dates to 1971, when he designed a reverb unit using a ceramic phono cartridge, four ball point pen springs, a model car hub cap, a transistor amplifier kit, and a speaker. In the 1980s, he was author of an article in Issue 1 of Glass Audio called “A Self-Bias Servo for Push Pull Amps,” and in 1984 he designed a diamond tester. He received US patent 8294440 in 2012 for a novel voltage regulator. He’s a proud father of two, and spouse of a very tolerant and patient wife.
Measuring Super Regulators
By Jan Didden (audioXpress, Technical Editor)
Super Regulators have interested me, ever since I published my first article on the subject in The Audio Amateur (the predecessor to audioXpress) in 1987. And later, in 1994, I was invited by Walt Jung to work on his classic four-part series for The Audio Amateur.
And if anything comes out of Brian Lowe’s articles, it is the realization that at this level of performance, everything matters, and measurement becomes as hard and tricky as the design itself.
Lowe’s perseverance in this is commendable.
A few comments. In Part 1 of Lowe’s article series (audioXpress, May 2019), he shows a oscilloscope shot of a super regulator oscillating with an AD797 as an error amp. Both Walt Jung and myself, and many others, have repeatedly stated that the AD797, while being a superb audio op-amp, is NOT the preferred op-amp for a super regulator. (I often use an AD825 but there are many others that are well-suited). The op-amp selection criteria have been documented extensively.
He also mentions that the super regulator would have start-up issues. I can assure Lowe and the readers that literally many hundreds of super regulators have been built, providing clean and stable supply voltages with no trace of oscillations or startup issues. But you need to read relevant articles and make informed design choices.
The Resources and References listed at the end of Part 2 of Lowe’s article are a good start, and many are available for free download. The schematics don’t always show an output cap on the regulator. Lowe does mention it in passing, but it is important enough to emphasize: a regulator output cap is critical for regulator stability. But: The requirement is for a lossy electrolytic capacitor with some non-zero equivalent series resistance (ESR), and specifically NOT a high-quality film cap!
This capacitor has only a minor effect on the output impedance, being in parallel with the already very low impedance of the regulator itself. But it modifies the loop transfer to assure stability. Most datasheets for regulators specify a range of allowed ESR for the output cap.
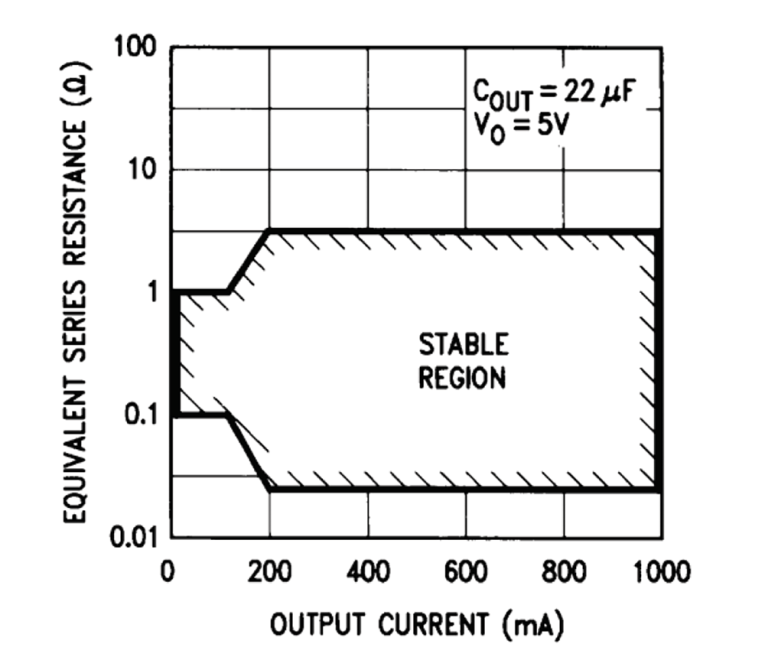
Figure 1 for the LM2941 is illustrative. Super regulators are no different in this respect. The power supply rejection ratio (PSRR) test circuits show an output cap of 0.1μF on the driver. Companies such as Texas Instruments advise against using an output capacitor here, on the grounds that it may impact the measurement as the capacitance can interact with the capacitive and/or inductive part of the device under test (DUT) input impedance; it adds an uncertainty to the measurement results.
For readers interested in other measurements on super regulators beyond PSRR I can recommend Jack Walton’s article mentioned in the Resources section of the article. aX