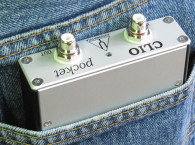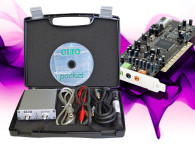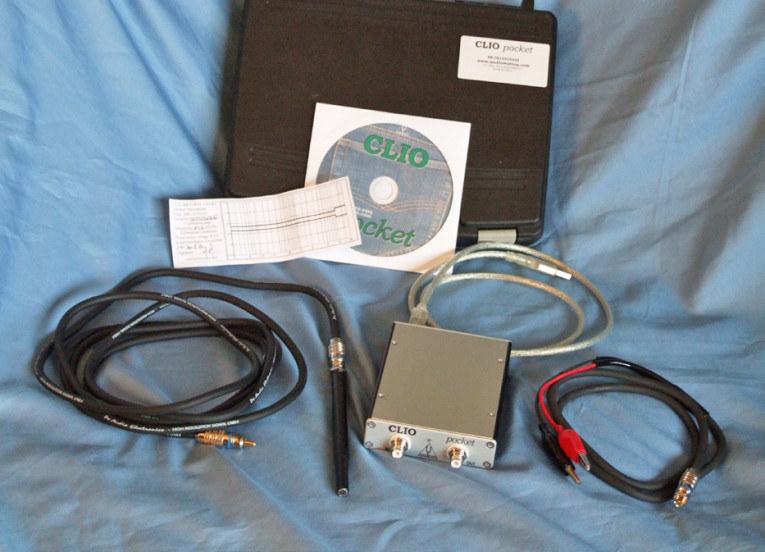
CLIO Pocket comes with a USB interface, software, a microphone, a cable (with calibration data), and a cable for taking impedance measurements, Thiele-Small (T-S) parameters, or measuring the value of capacitors, resistors, and inductors (see Photo 1). All of this is packed in a foam-lined case.
Setting up CLIO Pocket the first time is straightforward and really just amounts to loading the software and plugging the analyzer into a USB port on a computer. Clicking on the CLIO “C” icon brings up the main screen (see Figure 1). The layout is intuitive and consist of a level meter (e.g., in volts, dBv, dBr, dBSPL, frequency, THD %, THD dB, resistance, capacitance, and inductance) on the far right side of the main screen. The oscillator controls are directly below and a menu system is placed across the top of the screen. Of course, the primary graph area occupies the rest of the space. The menu system includes the usual housekeeping routines—save, open, and print, plus the primary menu commands. This includes an option menu that sets various preferences (e.g., graph, units, notes, etc.), the two main operating mode buttons, the Fast Fourier Transform (FFT) analysis button, and the Log Chirp button. The FFT Analysis mode is for real-time analysis (RTA), while the Log Chirp mode works for sound pressure level (SPL) and impedance.
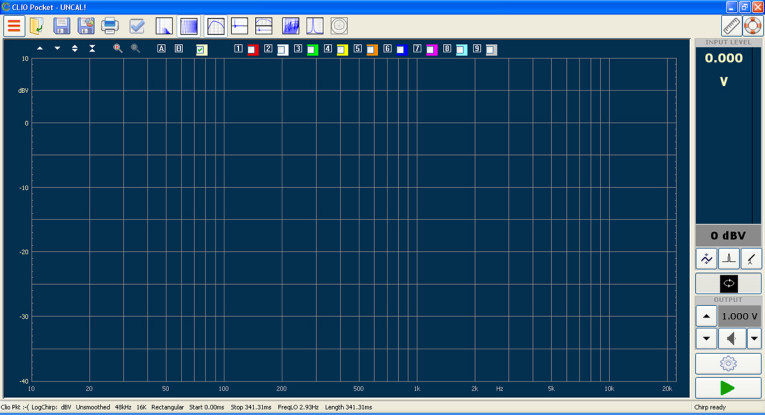

The remaining buttons determine the type of display and includes frequency response, time response, frequency and time on the same graph, a waterfall plot, impedance plot, and polar plots (not yet implemented). The buttons on the far right are an Autoscale Graph button and a Help Button.
The row of buttons below the main menu enables control scale changes on the graph, zooming, two marker buttons (A/B), a primary data storage button, and a choice of six storage buttons for measurement data that allow multiple curve displays.
Viewing this opening screen, you can see that in the upper left hand corner next to the CLIO logo, it reads UNCAL! This means that to begin using CLIO Pocket you must first run through the analyzer’s calibration routine. This amounts to doing a loopback measurement to check if the internal voltage is correct, then running the calibration routine. If this goes well, a :) appears at the bottom left of the screen and you are ready to proceed.
Rather than go into detail regarding all the measurement routines available in CLIO Pocket, I decided to give examples using measurements for a couple of the drivers that appear in this month’s Test Bench article, the Eminence N314T-8 compression driver and horn and the Dayton LW150-4 woofer. This way you can compare them to the data from my normal measurement protocol using LMS and SoundCheck. For additional information, Joe D’ Appolito provided a really thorough review of CLIO Pocket in the October 2015 issue of audioXpress - available here.
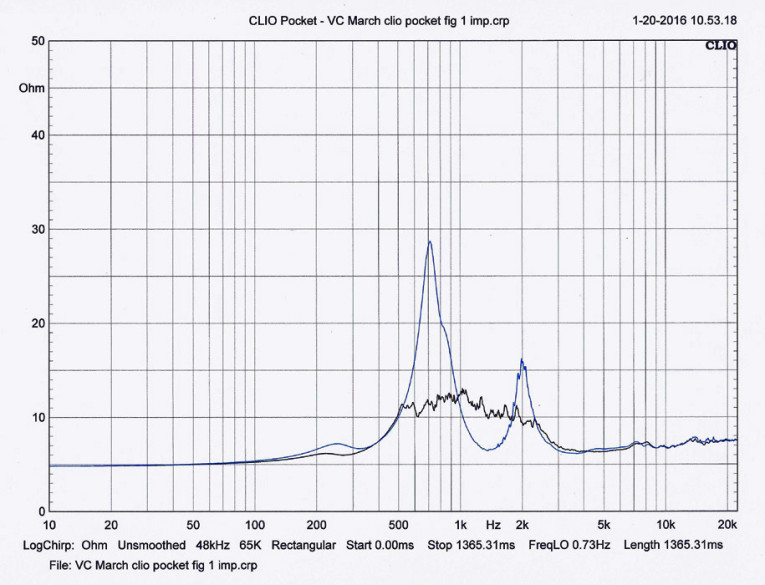
To test the various functions CLIO Pocket, I started with a capacitor and an inductor. I compared the results to my BK Precision LCR meter and got the readings shown in Table 1. Obviously, CLIO Pocket is comparably accurate, so from there I performed an impedance measurement on the new Eminence N314T-8 compression driver, with and without the horn attached. Figure 2 shows, it is about the same as the LMS impedance measurement in terms of both magnitude and frequency.
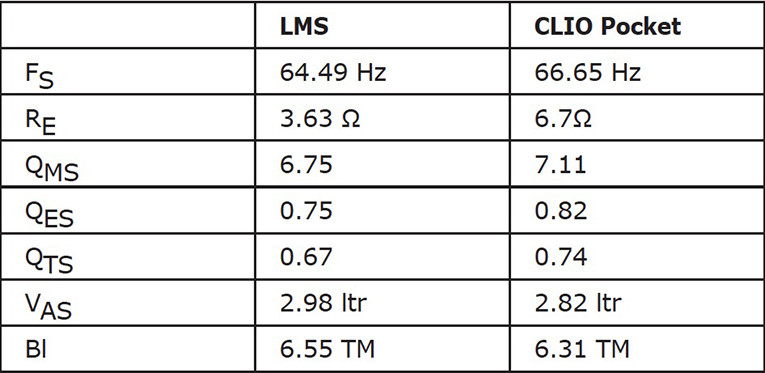
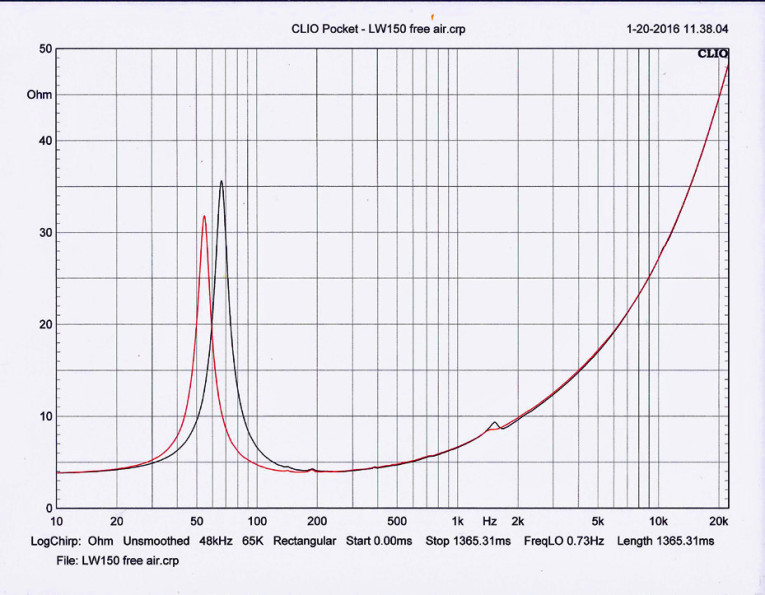
Next, I performed a T-S measurement on the Dayton LW-150. Unfortunately, the two protocols are somewhat different because the LMS analyzer uses the TSL method with a fixed Mmd number and CLIO Pocket uses the added mass technique. The CLIO Pocket’s impedance, free air, and delta mass measurements are shown in Figure 3. The T-S parameter comparison from the two analyzers is shown in Table 2. Given the two different methods (fixed Mmd and Delta Mass), and the general variability of T-S parameter measurements, I would judge these two data sets to result in very similar enclosure simulations.
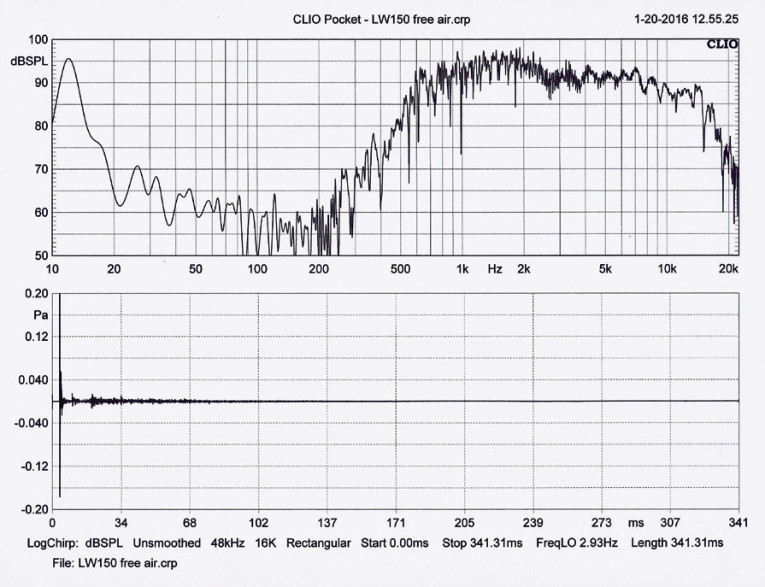
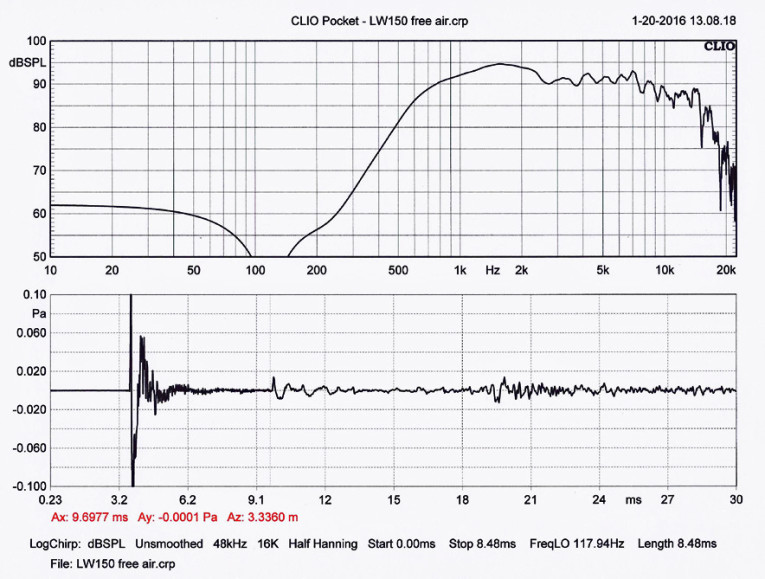
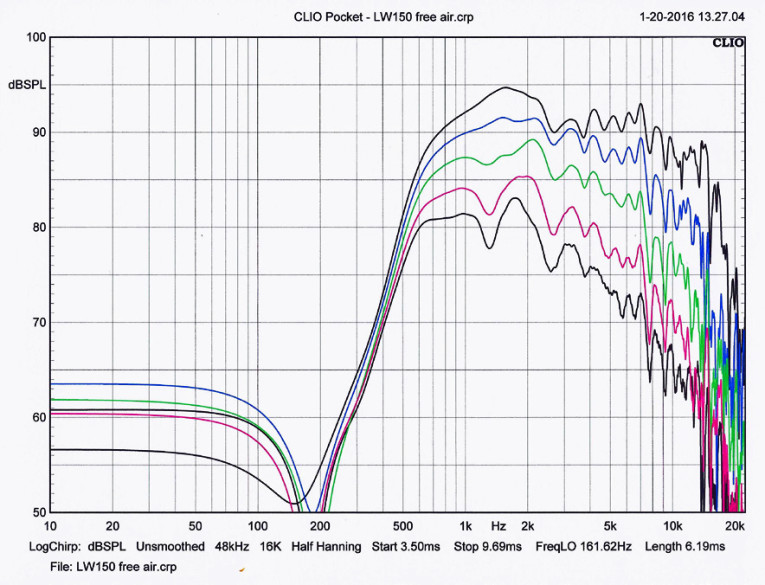
The next measurement I took was a Log Chirp on-axis 1 m frequency response measurement of the Eminence N314T-8 compression driver and horn. Figure 4 shows the unwindowed impulse response. Figure 5 shows the semi-anechoic windowed response. Once I had the impulse response windowed for the room, I completed four more off-axis measurements at 15°, 30°, 45°, and 60° off-axis. Figure 6 shows all five curves.
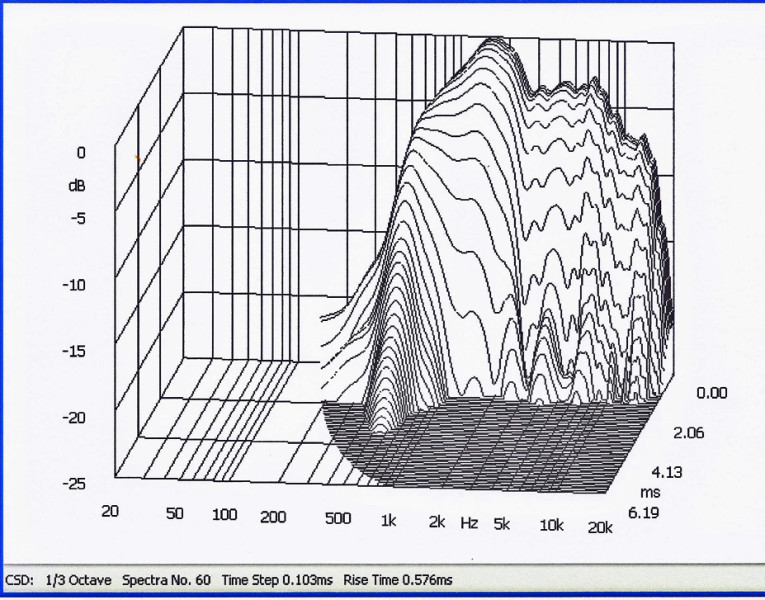
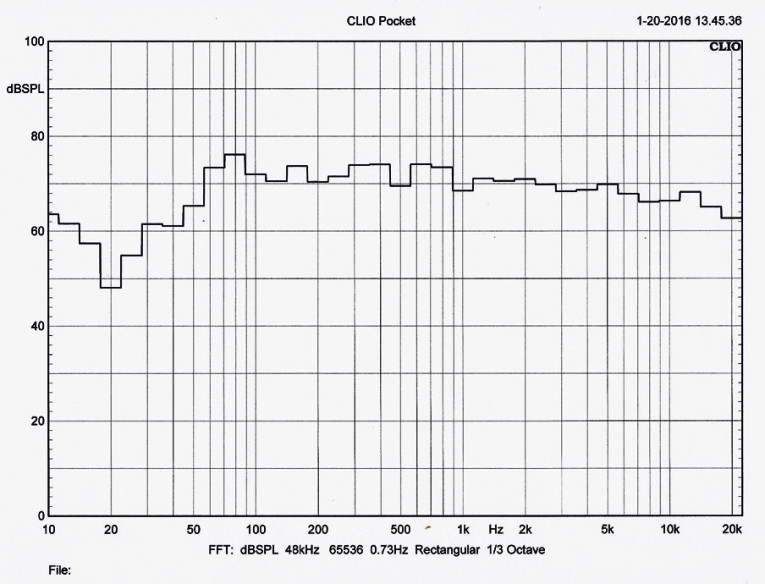
Using the on-axis response, I hit the waterfall button and produced the graph shown in Figure 7. For my last measurement, I hooked up a two-way speaker (a modified version of the A651 two-way design from the Audax Vance Dickason Signature Series of designs I did back in 1995) and located the microphone 5’ from the speaker and performed a 1/3 octave RTA measurement using the FFT button (see Figure 8).
After putting the new CLIO Pocket through its various measurement routines, I will have to say I’m impressed. It is certainly the lowest cost and most professional analyzer currently on the market, and I would definitely recommend it. For more information, visit Parts Express at www.parts-express.com. VC
This article was originally published in Voice Coil, March 2016.


