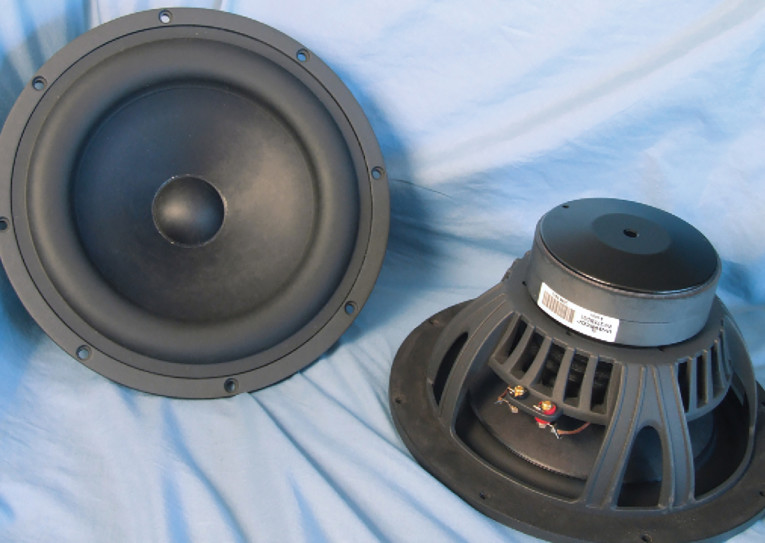
For this January issue of Voice Coil, Wavecor sent me a new high power (1800W short term, 450W long term) handling 10.75” woofer, the WF275BD01 (Photo 1), part of a new series of drivers announced in October 2020. Applications for the WF275BD01 include use in two-way (with larger ribbon/AMT drivers, or compression driver/horn combinations) and three-way home hi-fi speakers. The feature set for the WF275BD01 is like most high-performance two-channel/home theater drivers, fairly substantial.
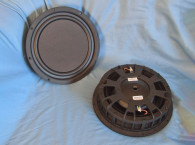
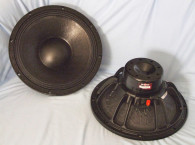
Starting with the frame, the WF275BD01 uses a proprietary eight-spoke (four double spokes) cast-aluminum frame incorporating 20 9mm × 28mm rectangular vent holes in the area below the spider mounting shelf for enhanced voice coil cooling. This series of cooling vents allows air to move past the voice coil and across the front side of the ferrite motor assembly. Additional cooling is provided by 16 (two rows of eight) 5mm diameter vents in the voice coil former just below the neck joint (Photo 2).

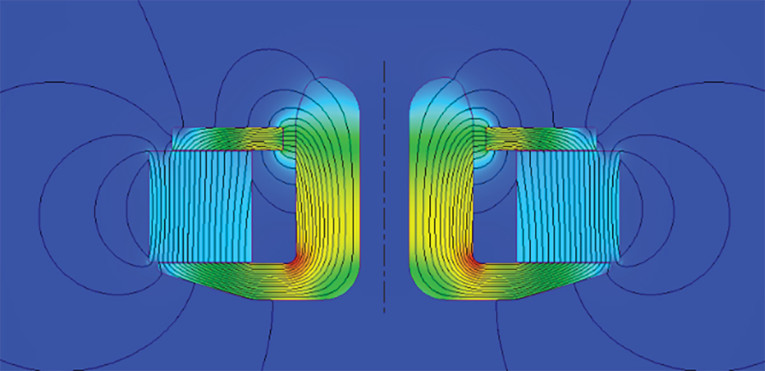
The ferrite magnet motor was FEA designed using a 39mm (1.5”) diameter voice coil wound with round copper-clad aluminum wire (CCAW) on a non-conducting heavy black glass fiber former. Considering all the various cooling features and the 39mm (1.5”) diameter voice coil, rated power handling is 180W continuous (450W long term). Last, connection to the WF275BD01 is made by a pair of color-coded gold solderable terminals located on one side of the frame.
I used the LinearX LMS analyzer and Physical LAB IMP Box to create both voltage and admittance (current) curves. I clamped the driver to a rigid test fixture in free-air at 0.3V, 1V, 3V, 6V, 10V, 15V, and 20V, allowing the voice coil to progressively heat up between sweeps with a 200Hz sine wave. The 20V curves were too nonlinear for LEAP 5 to achieve an appropriate curve fit and were discarded.
Following my established protocol, I used the measured Mmd data (53.8 grams for the WF275BD01). I post-processed the 16 550-point stepped sine wave sweeps for each WF275BD01 samples and divided the voltage curves by the current curves to generate impedance curves, with the phase derived using the LMS calculation method. I imported the data, along with the accompanying voltage curves, to the LEAP 5 Enclosure Shop software.
Because Thiele-Small (T-S) parameters provided by the majority of OEM manufacturers is generated using either the standard model or the LEAP 4 TSL model, I additionally created a LEAP 4 TSL parameter set using the 1V free-air curves. I selected the complete data set, the multiple voltage impedance curves for the LTD model, and the single 1V impedance curve for the TSL model in the Transducer Model Derivation menu in LEAP 5. Next, I created the parameters for the computer box simulations. Figure 2 shows the 1V free-air impedance curve. Table 1 compares the LEAP 5 LTD and TSL data and factory parameters for both of the Wavecor WF275BD01 samples.


LEAP 5 parameter calculation results for the Wavecor WF275BD01 were somewhat different from Wavecor’s published data for this driver, partly due to the different Sd calculation. Comparing the TSL model closed-box simulations, my measurements to the factory data yielded nearly identical F3 results with identical Qtc numbers, so obviously similar Fs/Qt ratios.
Following my established measurement protocol, I configured computer enclosure simulations using the LEAP LTD parameters for Sample 1. Two computer box simulations were programmed into LEAP 5, the first being the sealed-box Butterworth simulation that was 0.50 ft3 with 50% enclosure fill material (fiberglass). The second simulation was a vented QB3 alignment: a 0.82 ft3 enclosure tuned to 55Hz included 15% fiberglass fill material.
Figure 3 displays the results for the Wavecor WF275BD01 in the sealed and vented enclosures at 2.83V and at a voltage level sufficiently high enough to increase cone excursion to Xmax + 15% (10.4mm for the WF275BD01). This produced a F3 frequency of 65Hz (F6 = 53.4Hz) with a Qtc = 0.68 for the closed box simulation, and -3dB = 54Hz (F6 = 45Hz) for the QB3 vented simulation. Increasing the voltage input to the simulations until the maximum linear cone excursion was reached resulted in 115.2dB at 38.3V for the sealed box and 117.5dB for at 44V input level for the smaller vented box.
Figure 4 shows the 2.83V group delay curves. Figure 5 shows the 38.3V/44V excursion curves. Please note that the all drivers in vented enclosures start over excursing below about the tuning frequency, so an appropriate high-pass filter will increase the undistorted output considerably.


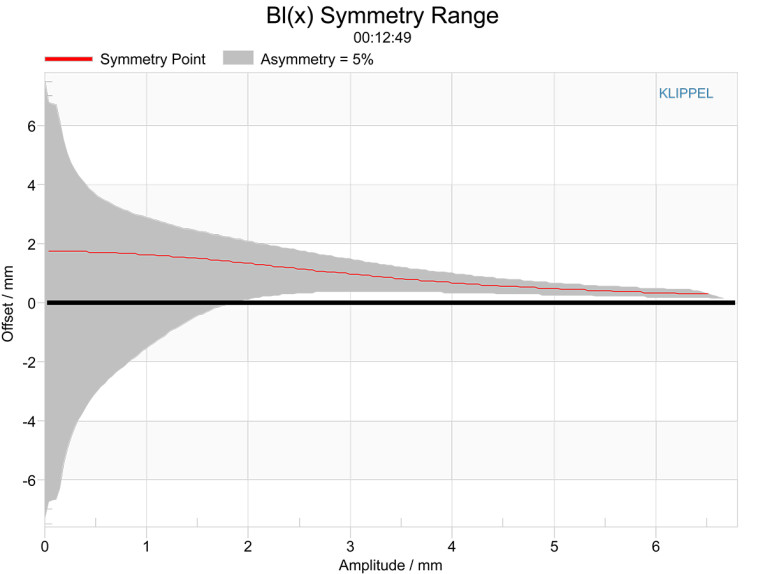

The Bl(X) curve for the WF275BD01 (Figure 6) is moderately broad and symmetrical, typical of a medium Xmax driver, but with small amount of forward (coil-out) offset. Looking at the Bl symmetry plot (Figure 7), this curve shows only 1mm coil-in offset at the 4mm position (reasonable certainty location) and decreases to a non-relevant 0.25mm at the physical 9mm Xmax of this driver.
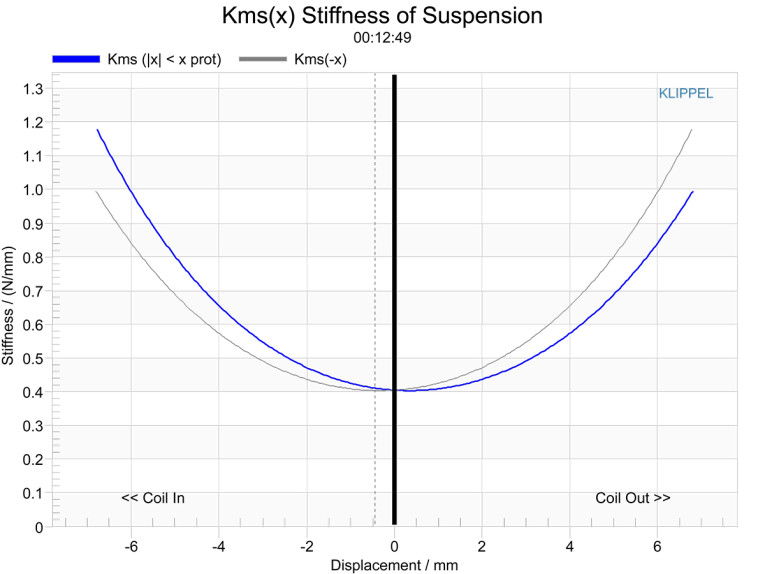
Figure 8 and Figure 9 show the Kms(X) and Kms symmetry range curves for the WF275BD01 woofer. The Kms(X) curve is also rather symmetrical in both directions accompanied by a small coil-out offset. Looking at the Kms symmetry range plot, the coil-out offset is less than 0.5mm from 2mm to the 9mm physical Xmax position. Displacement limiting numbers calculated by the Klippel analyzer for the WF275BD01 were XBl @ 82% Bl=7.1mm and for XC @ 75% Cms was 5.1mm, which means that for this driver, the compliance is the most limiting factor for prescribed distortion level of 10% (XBl=8.9mm, XC=8.4mm for the 20% distortion criteria).
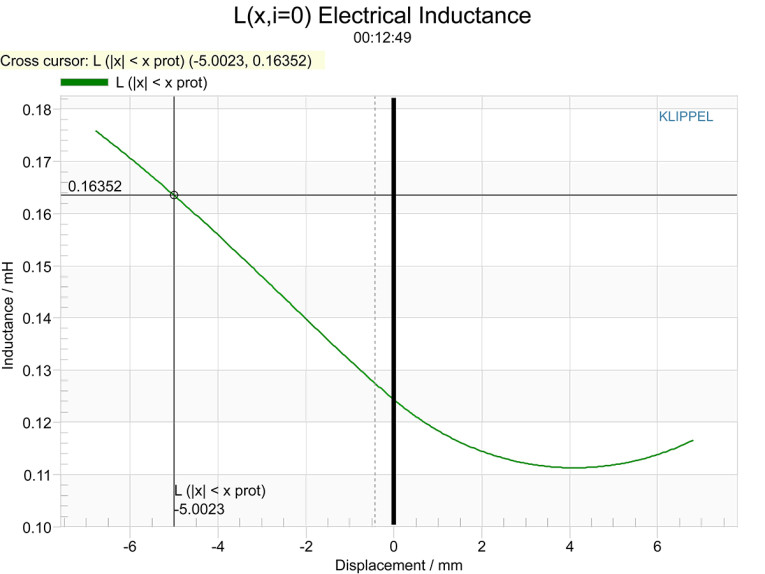
Figure 10 gives the WF275BD01’s inductance curves Le(X). Inductance will typically increase in the rear direction from the zero rest position as the voice coil covers more pole area, which is not what is happening here, probably an affectation of Wavecor’s Balanced Drive motor. The inductance swing for this driver is a really low 0.07mH to 0.008mH, which is excellent performance.
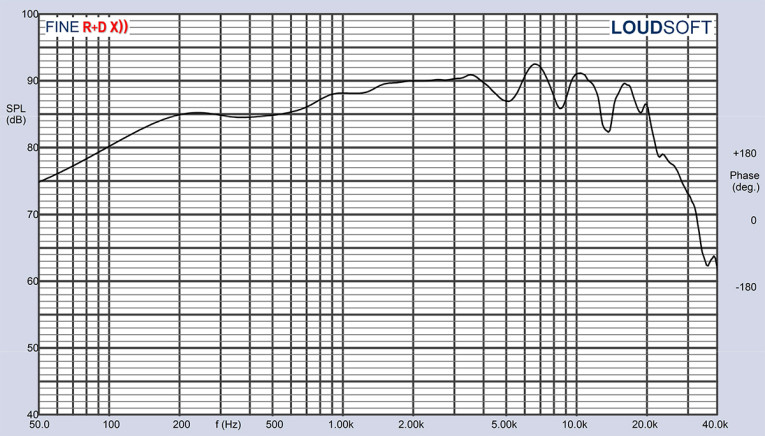
With the Klippel testing complete, I mounted the WF275BD01 woofer in a foam-filled enclosure that had a 15” × 14” baffle. Then, I measured the device under test (DUT) using the Loudsoft FINE R+D analyzer and the GRAS 46BE microphone (courtesy of Loudsoft and GRAS Sound & Vibration) both on- and off-axis from 200Hz to 20kHz at 2V/0.5m, normalized to 2.83V/1m using the cosine windowed FFT method. Figure 11 gives the WF275BD01’s on-axis response, indicating a smooth rising response from 0Hz to 2.2 kHz followed by a broad 5dB increase in output 2.3kHz and 6kHz — just before the low-pass roll-off.
Figure 12 displays the on- and off-axis frequency response at 0°, 15°, 30°, and 45°, showing the typical directivity for a 10” woofer. The -3dB at 30 degrees with respect to the on-axis curve occurs at about 1.6 kHz, so a reasonable frequency (or lower) for a low-pass crossover. The normalized version of Figure 12 is given in Figure 13. The CLIO polar plot (in 10° increments and 1/3 octave smoothing) is shown in Figure 14. And finally, Figure 15 displays the two-sample SPL comparisons for the WF275BD01 driver, showing a very close match ≤ 0.25dB throughout the operating range.


For the last remaining series of tests, I again employed the Listen SoundCheck AudioConnect analyzer and SCM 1/4” microphone to measure distortion and generate time-frequency plots. For the distortion measurement, I mounted the 10.75” WF275BD01 driver rigidly in free-air, and set the SPL to 94dB at 1m (2.91V), using a pink noise stimulus. Then, I measured the distortion with the Listen microphone placed 10cm from the driver. This produced the distortion curves shown in Figure 16, with third-harmonic distortion staying below 0.4%.

I then used SoundCheck to get a 2.83V/1m impulse response for this driver and imported the data into Listen’s SoundMap Time/Frequency software. Figure 17 shows the resulting CSD waterfall plot. Figure 18 provides the Wigner-Ville plot (chosen for its better low-frequency performance).


Given the data collected, and the consistently good performance exhibited by Wavecor woofers, midranges, and tweeters, the WF275BD01 looks like an excellent addition to Wavecor’s catalog of woofers. Needless to say, the Wavecor drivers I characterize in Test Bench are only from Wavecor’s catalog line, however, the company also provides custom OEM drivers as well, whether you start with a blank page, or modify something from its catalog line. For more information, visit www.wavecor.com. VC
This article was originally published in Voice Coil, January 2022.