Using a laptop computer equipped with acoustic measurement software, an external sound card, and a calibrated microphone, experienced hobbyists can make accurate loudspeaker measurements. The most important of them is the free-field frequency response measurement, which only requires the direct radiation from the loudspeaker to reach the microphone, eliminating any other reflection by nearby walls, floors, or ceilings. If an anechoic chamber is available, this requirement is easily fulfilled, otherwise it is very difficult to find another suitable place to make this measurement.
The Low Frequencies Measurement Problem
Usually, an anechoic chamber is beyond the capabilities not only for the hobbyist but also for a lot of professional engineers, and the only available place to perform the measurements is a large room, usually inside their own house or on the company premises.
When the loudspeaker is placed in a large or small room, the radiated acoustic field is strongly modified, due to the modal behavior of the room and to the reflections from the floor, the ceiling, and nearest walls.
To rule out all these reflections, the time window or gating technique is used, whereas for the analysis, only the direct signal from the loudspeaker is taken and the rest is discarded. Although this sounds like an excellent method, it has its own limitations. The typical gated measurement, at 1m, will have a time window between 4msec to 6msec, which cannot give accurate results below 300Hz to 400Hz. Additionally, the frequency resolution of the measurement is smoothed up to several kilohertz.
So, if we cannot accurately measure below this frequency range, what are our alternatives?
Possible Solutions
The near-field technique, proposed by D.B. Keele circa 1973, is the commonly accepted way to get low-frequency response measurement without an anechoic chamber. The microphone is placed very close to the driver’s diaphragm to almost completely eliminate baffle and room effects. The result is directly analogous with the far-field response, but only if the speaker radiates in a 2π space, so the response must be corrected for the diffraction due to the baffle dimensions.
The diffraction response is usually calculated with the help of a software program. The near-field response is then corrected and can be merged with the gated far-field response resulting in a frequency response of the complete frequency range.
The near-field technique can be applied to almost any kind of enclosure (closed, bass reflex, open baffle, etc.) following slightly different procedures but also has its limitations. First, it is not always easy to combine the outputs of several radiated areas such as when a loudspeaker has one or more woofers, ports, or passive radiators. Also, the calculation of the diffraction cannot be verified by measurements, and when the loudspeaker cabinet is not a simple regular shape (e.g., flat circular or rectangular), it can never be sure that was calculated correctly. Additionally, there is an upper limit in frequency where the near-field response gives accurate results, but this is rarely a serious problem, except in the case of a very large woofer.
Another option that should be mentioned is the ground plane measurement, which can be done outdoors, usually in a large empty parking lot, but this is rarely very practical for most of us due to weather problems, traffic noise, and more.
Recently, I have been exploring another interesting method, which until now, I have found very convenient and accurate. It is based on simulation software, where an accurate model of the loudspeaker is built, and the software calculates the frequency response with very good accuracy at any point in space and a lot more interesting things.
In this article, I will describe my process, and I will present the results.
AKABAK Software
AKABAK is a simulation software for acoustic and electroacoustic structures combining the Boundary Element Method (BEM) and the Lumped Element Method (LEM). Complicated acoustics are calculated with the help of the BEM while simple acoustics, structures, and electronics are handled by the LEM.
The Boundary Element and the Lumped Element parts can be fully coupled. The coupling allows to attach complicated acoustic structures to an electro-acoustic network. Further, the coupling is established at the observation stage with the advantage that changing lumped elements does not make necessary a re-solving.
For entering the electroacoustic device, AKABAK has a simple internal CAD-tool with specific support for such devices. It is also possible to import mesh-files, which provide input from external CAD files if they exist. All input data can be parameterized with the help of formula systems.
A free version of this software can be downloaded directly from the R&D Team site (see Resources), which is essentially the same as the professional version, but does not allow users to save the result files.
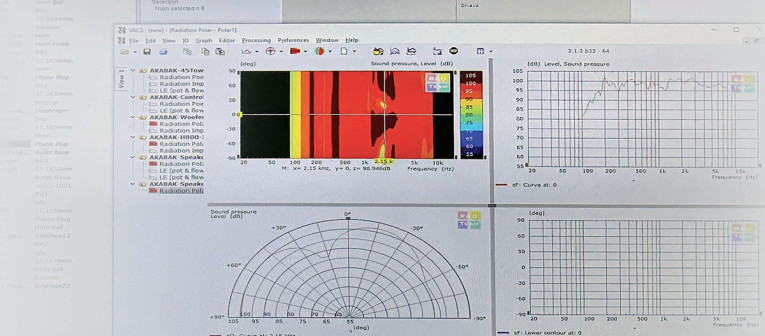
Visualizing Acoustics (VACS) is another software package that has been developed to simplify visualizing, processing, and storing acoustical data, notably of transfer-functions. AKABAK transfers its solution data to VACS automatically using Windows COM technology. If an “observation point” is specified in the analysis, which involves spectral output, then VACS should start automatically if it was not already open. Alternatively, you can start VACS from Windows Start menu as usual, or you can issue menu Options/Open VACS in AKABAK.
VacsViewer is essentially the same application as VACS but does not allow for saving VACS-project-files and is used with the demo version of AKABAK.
After downloading and installing the two files, I spent enough time to learn them and to run the demo examples that are provided before I proceeded to the simulation of my projects. This is a procedure that could take some time, but I believe it is well worth it.
The AXL Open-Baffle Subwoofer
The first project I ran was the open-baffle subwoofer of my AXL loudspeaker, shown in Photo 1, since this was also the reason that I got involved with the AKABAK software. The AXL is an open-baffle, four-way, active loudspeaker consisting of five drivers: a 15’’ subwoofer, an 8’’ woofer, a 4’’ mid-range and two ½’’ dome tweeters, one placed to the front and the other to the back side. It was presented in audioXpress a few years back (see Resources).
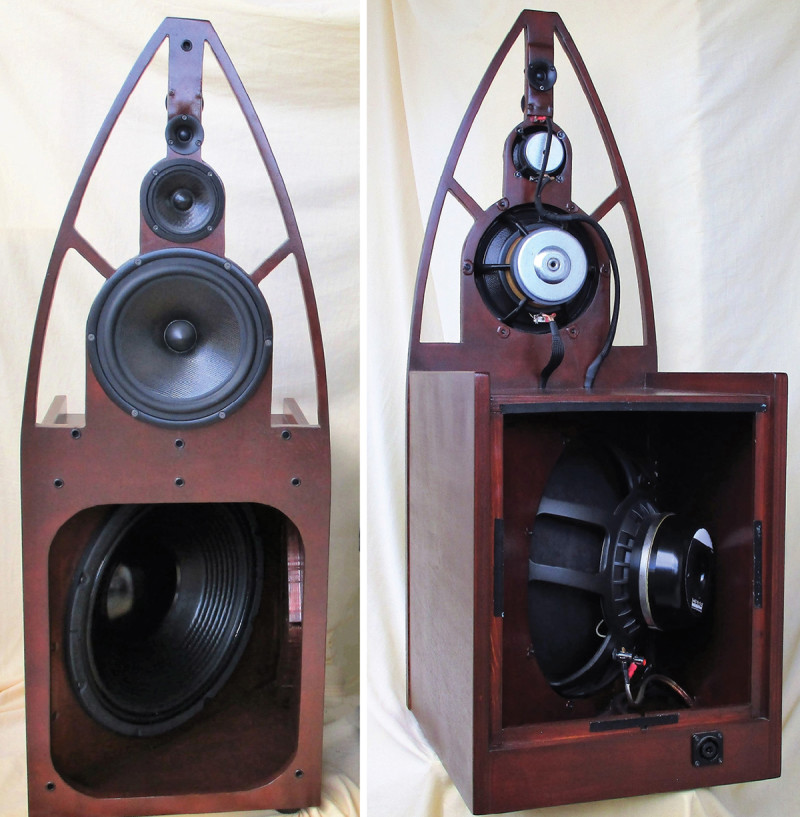
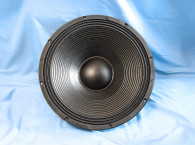
The subwoofer is based on the Ciare NDH15-4S driver. This is a huge driver with an overall diameter of 388mm (15.2”) and a net weight of 8kg. It is installed in an N-frame cabinet with the driver baffle making 45 degrees with the sides of the cabinet. The external dimensions of the subwoofer cabinet are 375mm×480mm×390mm.
I used the subwoofer in the frequency range from 30Hz to 120Hz. This means that I had to know the frequency response at least between 20Hz to 240Hz, which belongs exactly to the range that is impossible to measure in a typical room using the gating method.
As I described with more details in the previously mentioned article, I made the low-frequency response measurements using the ground plane method in my living room and a large gating window. Then I had to make some estimations and assumptions because the effects of the room were always present, and I had to find a way to ignore them. But I had always wondered if these estimations were correct, and I was looking for a way to verify them.
Preparing the Simulation
The Thiele-Small (T-S) parameters of the driver should be entered as input data to AKABAK for the simulation. Recently, I have read about the Speakerbench method (see Resources), and I wanted to give it a try. This method produces an advanced transducer model that is more accurate than the traditional model. Three impedance measurements are required instead of two of the classic method, one without added mass to the loudspeaker cone, a second with an added mass m1, and a third with a larger added mass m2 (roughly double m1). I used an added mass of 30 grams and 58 grams.
These three impedance data files are then uploaded to the web application of Speakerbench, which undertakes the rest and calculates the T-S parameters. It also calculates a Quality factor from the measurements, which can have the following ratings: (1) Excellent, (2) Good, (3) Fair, and (4) Fail, giving an indication of if the measurements were good, or if there is a need to repeat them.
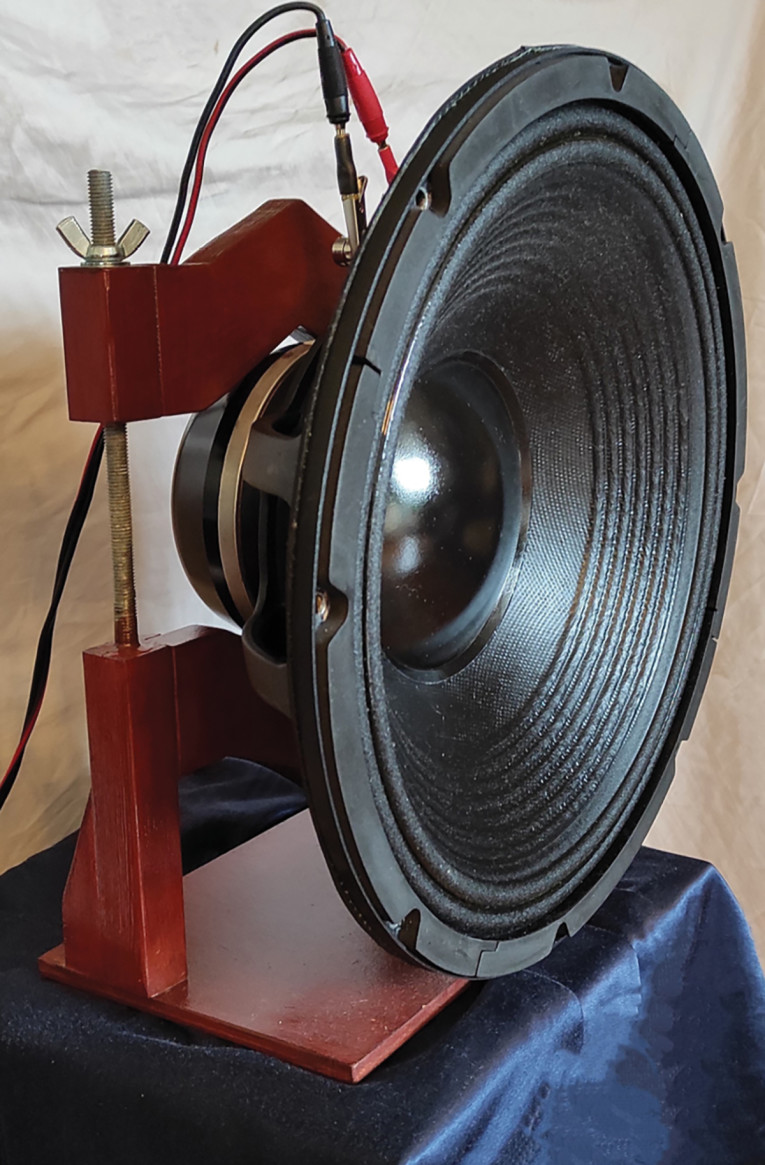
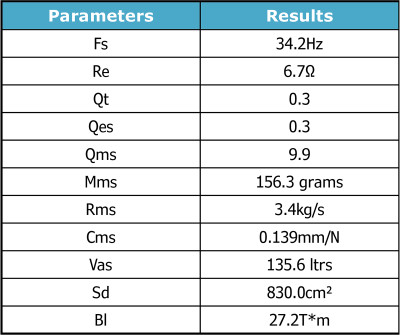
I placed the huge driver in the support jig shown in Photo 2 and I used the LIMP software for the impedance measurement. I set the output voltage level of the power amplifier at 3Vrms but this is not the voltage that directly drives the speaker terminals, because it is connected to the power amplifier through a power resistor of 30Ω, which is necessary for the impedance measurement. Table 1 presents the calculated parameters.
Entering the Input Data
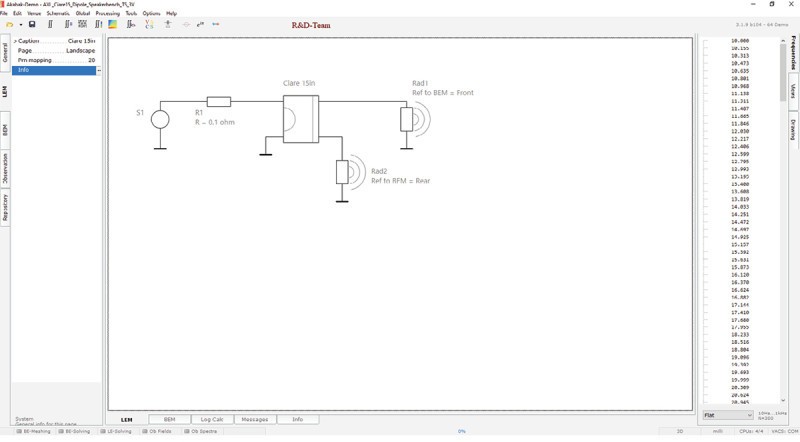
First, I had to enter the LEM part of the simulation, which is very simple, and it is shown in Figure 1. The voltage source S1 drives the Ciare 15” electro-dynamic driver, which has two radiated diaphragms, the front, and the back.
The BEM is the difficult part. For the analysis, I used three subdomains — the exterior, the front, and the back. Two interfaces were used between the front and the exterior subdomain and between the back and the exterior.
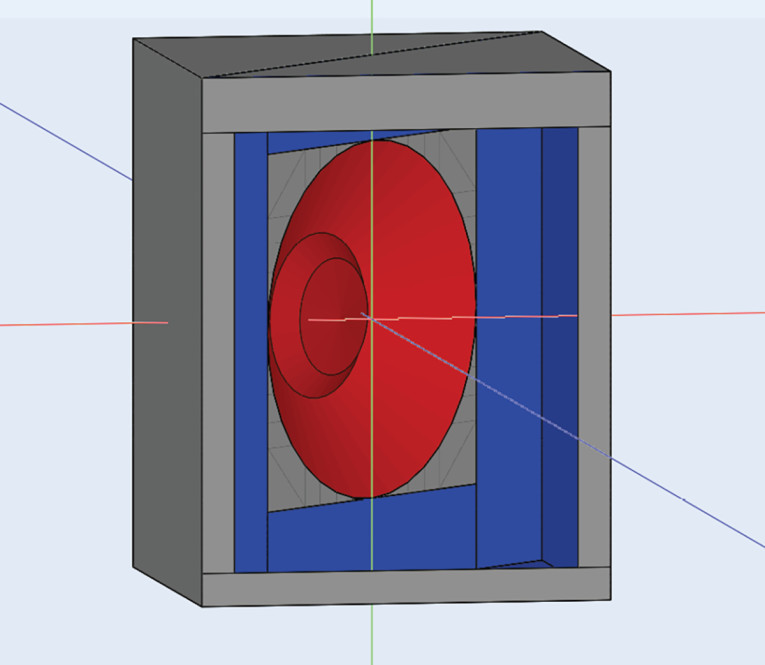
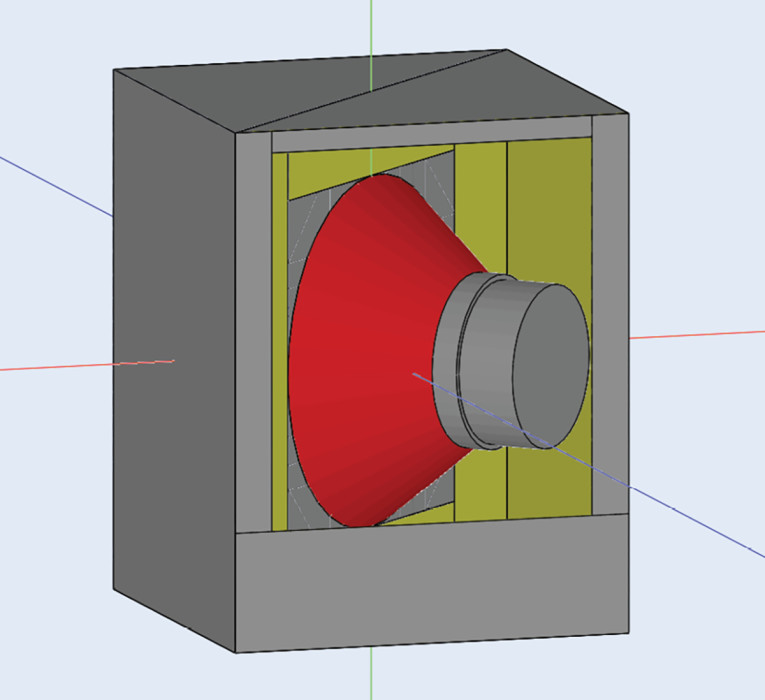
Next, I used the internal CAD-tool of AKABAK to enter the structure of the open-baffle subwoofer. This was a time-consuming procedure because I did it by entering the structure point-by-point. AKABAK also has the capability to accept files from a CAD program, but I didn’t explore this capability. The result is shown in Figure 2 for the front side of the open-baffle subwoofer and Figure 3 for the back side.
I ran a few simulations and got the first results, which seem to be correct, before I decided to send my file to Joerg Panzer, the creator of AKABAK, asking him if he had the time to check and evaluate my file and if possible, to propose any improvements. Joerg Panzer was very kind and replied to me with a modified file and some good advice.
The Simulation Results
I was thinking of a way to verify the results of the simulation, so I created an observation point just in front of the opening of the cabinet to calculate the near-field frequency response of the subwoofer. I did that because the more accurate measurement that I could take in my room was the near-field frequency response and I thought that, if this compares well with the simulated near-field response, it will be logical to assume that also the simulated far-field response and the other calculations of the program will be accurate.
While the simulation software was running, I set up a near-field measurement at the same point as in the simulation so when the software gives the results, I will be ready for the comparison.
The driver has an effective area of 830cm2 with a diameter of 32.5cm, and thus the near-field measurements will be valid up to 300Hz, more than enough for this project.
I used an EMM-8 microphone with a MP-1r preamplifier from iSEMcon in Germany. The microphone was recently calibrated by the manufacturer against a reference microphone, the Brüel & Kjær 4133. I loaded the calibration file into the ARTA software that I used for the measurements and the analysis, to compensate for any possible errors due to the microphone response.
Figure 4 plots together the simulated and the measured near-field frequency response of the open-baffle subwoofer and it seems that there is a very good agreement up to about 300Hz.
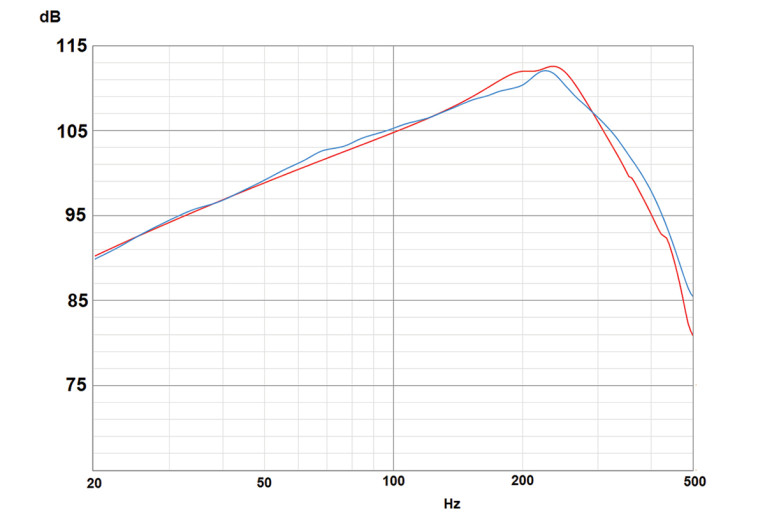
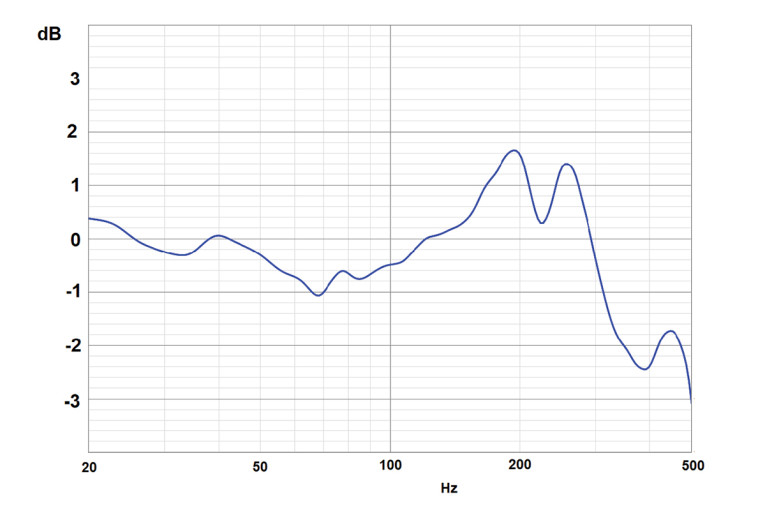
Figure 5 shows the difference between the two responses, which is better than ±1.5dB from 20Hz up to 300Hz, which is the upper limit for a valid near-field response measurement, as we mentioned.
Other Interesting Results
As I have previously mentioned, there is a lot of other useful information that can be calculated by the simulation, which otherwise would be very difficult to measure. For example, the horizontal and the vertical polar responses of the subwoofer, which are shown in Figure 7 and Figure 8, respectively. They seem to be similar as expected and the dipole characteristic radiation with the strong notches at 90 degrees and -90 degrees are clearly shown, except at the frequency range around 220Hz, which is the resonance of the cabinet’s front and back openings.
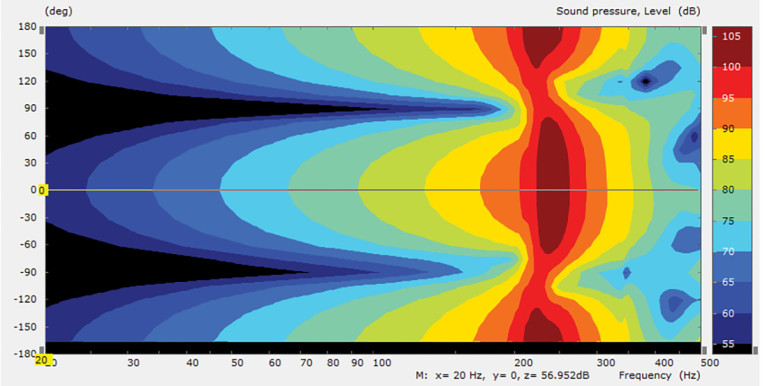
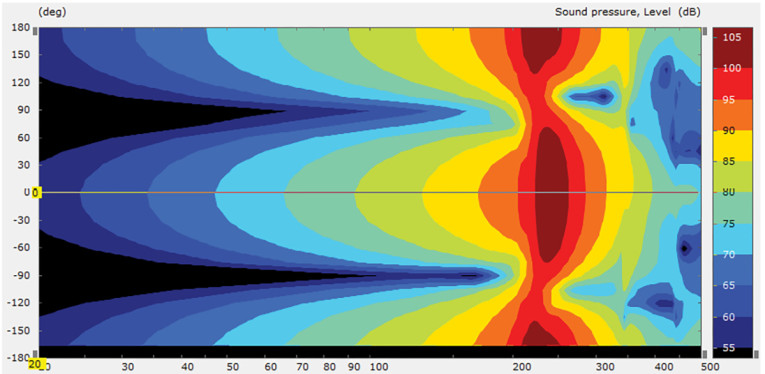
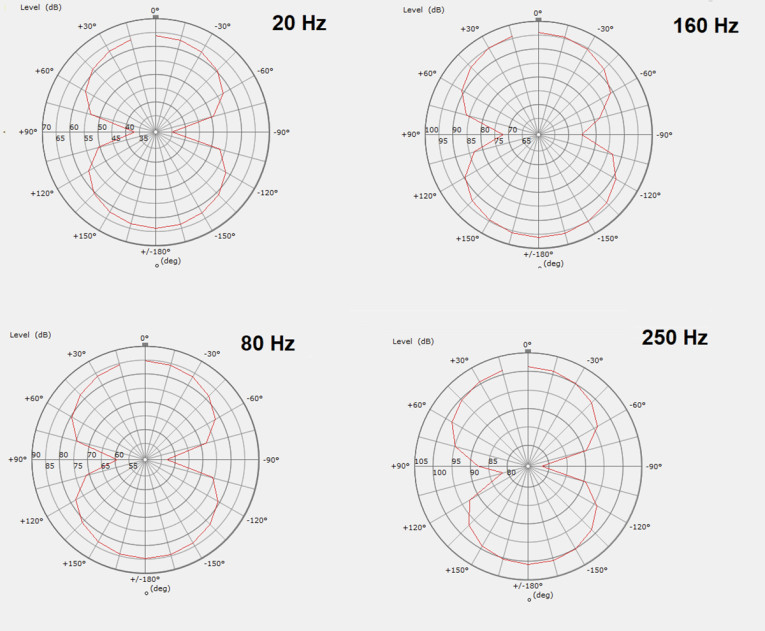
Figure 9 shows the simulated horizontal polar response at four specific frequencies—20Hz, 80Hz, 160Hz, and 250Hz—where again the typical polar response of a dipole is shown. An interesting point here is that at 250Hz, the subwoofer moves to the right its main axis by about 15 degrees, due to the position of the driver in the baffle.
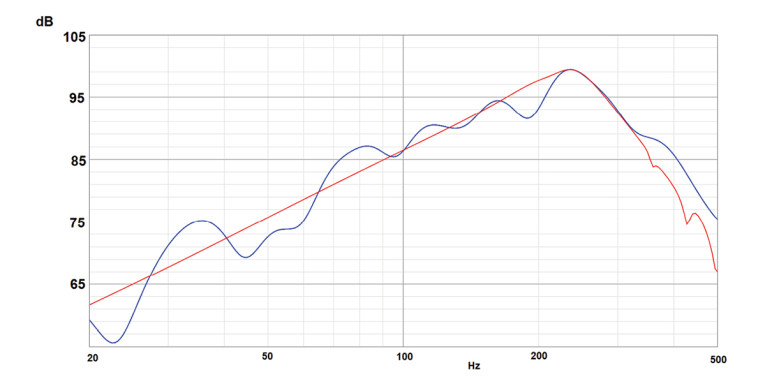
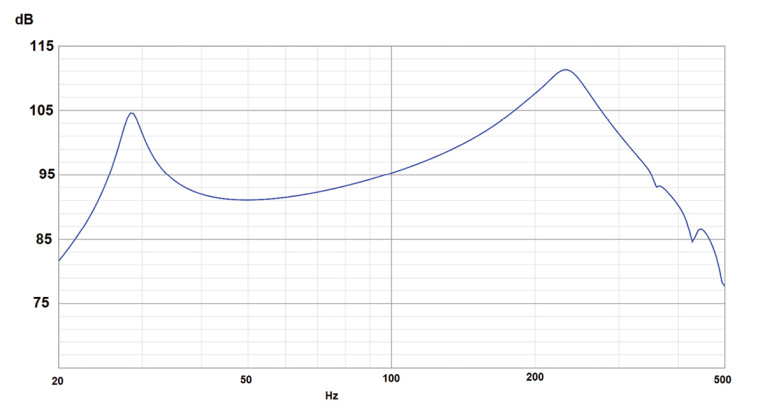
Another interesting and very useful result is the calculation of the cone excursion as shown in Figure 10, where the input voltage to the subwoofer terminals was set at 2.83Vrms. This, in combination with Figure 6, can give an estimation of the maximum sound pressure that the subwoofer can produce when it reaches the maximum linear excursion of 11.5mm (as given by its manufacturer) and what voltage level will be needed from the power amplifier.
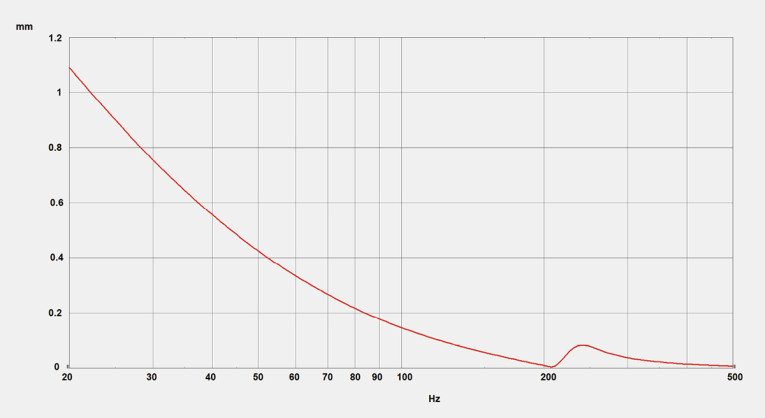
For example, at 30Hz, with an input voltage of 2.83Vrms, the subwoofer reproduces a level of about 68dBSPL with a cone excursion of 0.75mm. With the maximum linear excursion of 11.5mm, we calculate that the maximum output level will be 92dBSPL with a voltage of 43Vrms.
Following similar calculations, at 45Hz, the subwoofer will reproduce 102dBSPL with an excursion of 11.5mm but in this case, a much higher voltage from the amplifier at 69Vrms will be needed. It seems that a high-power, high-voltage amplifier of at least 500Wrms/8Ω is needed to drive this subwoofer, if sound pressure levels more than 100dBSPL are going to be reproduced at the low frequencies using its maximum linear excursion of 11.5mm.
Of course, in my calculations, the room gain at the low frequencies was not taken into consideration but it will provide some real boost to the reproduction of the low frequencies, reducing the amplifier power requirements and the excursion.
Another interesting result of the simulation is shown in Figure 11. Here, I replaced the voltage source S1 with a constant current source of 1Arms. The response is similar, as with constant voltage drive, in the range above 100Hz. Below 100Hz, the response becomes very different, and a large peak is shown at 28Hz, exactly at the resonance frequency of the driver. It seems that the current drive is an alternative, interesting way to drive this open baffle subwoofer since it requires less equalization at the lower frequencies and needs more investigation.
Conclusion
AKABAK software is a professional tool that offers accurate results. I presented some of these results in this article and I hope to have piqued your curiosity to download the demo version and explore it. It is an excellent tool, and I will use it extensively from now on for all my speaker projects. aX
Resources
AKABAK software, www.randteam.de/AKABAK3
ARTA & LIMP software, www.artalabs.hr
J. D’ Appolito, “Measuring Loudspeaker Low-Frequency Response,” audioXpress, June 2012.
C. Futtrup and J. Candy: “Parameter Estimation and Box Simulation with Speakerbench (Part 1 and Part 2),” audioXpress, August 2021 and September 2021.
G. Ntanavaras, “The AXL Dipole Loudspeaker,” audioXpress, September 2019.
vituixCAD loudspeaker simulator software, https://kimmosaunisto.net
This article was originally published in audioXpress, September 2024.


