While the use of multiple mics in a smart device can provide distinct benefits to the end product — for example, with multiple mics beam forming can be used to improve the signal-to-noise ratio (SNR) of the active speaker and reject background noise — it also complicates the testing process used to evaluate and characterize designs owing to the need for simultaneous, multichannel measurements.
In the development process, it is also critical to be able to accurately analyze inter-channel phase information for MEMS microphone arrays. The test configuration may require the ability to measure two or more digital microphones simultaneously and those digital microphones may require reference to the signal from one or more analog measurement microphones as well. In addition to that challenge, in some test scenarios the test system may be required to provide the system clock; in others it may need to synchronize to an external clock.
Microphone Array Testing
Conducting microphone array tests involves many stages and requires the following equipment: a generator/analyzer for stimulus and acquisition; a source loudspeaker to generate the acoustic test signal; an amplifier for the speaker driver; at least one measurement microphone (for reference); and a power supply for this reference mic. An anechoic test chamber and a sound level calibrator are also needed.
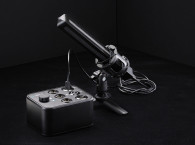
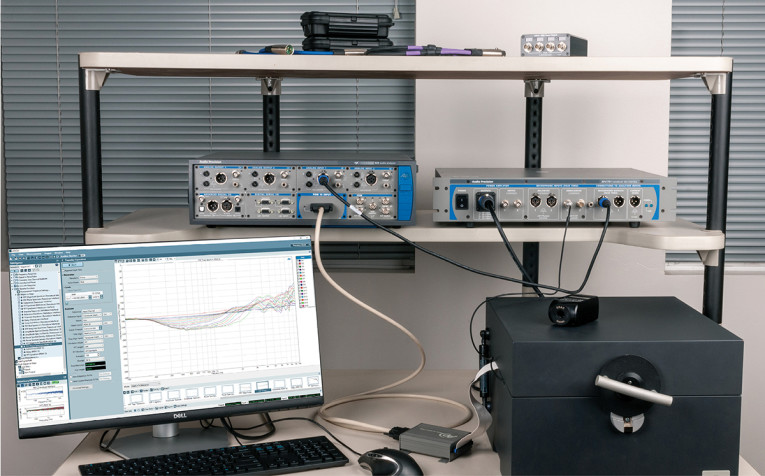
For the sake of this article, I employed the equipment shown in Photo 1. The equipment includes an APx525 audio analyzer with PDM 16 module and remote pod; an APx1701 Transducer Test Interface as both the speaker driver amplifier and the microphone power supply; an Interacoustics TBS25 anechoic test chamber with an integrated speaker; a 1/4” free-field measurement microphone; and a sound level calibrator.
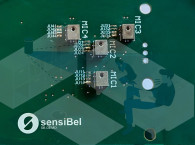
The device under test (DUT) is a microphone array fixture developed in-house at Audio Precision (AP) as a demonstration board. The small PCB has 16 pulse density modulation (PDM) microphones mounted along one edge of the board with a constant spacing of 6.6mm (0.260”) between microphones (Photo 2). It also has the same connector as the interface module (in this case, AP’s PDM 16 module) and connects to this remote pod via a 40-pin connector and flat ribbon cable.
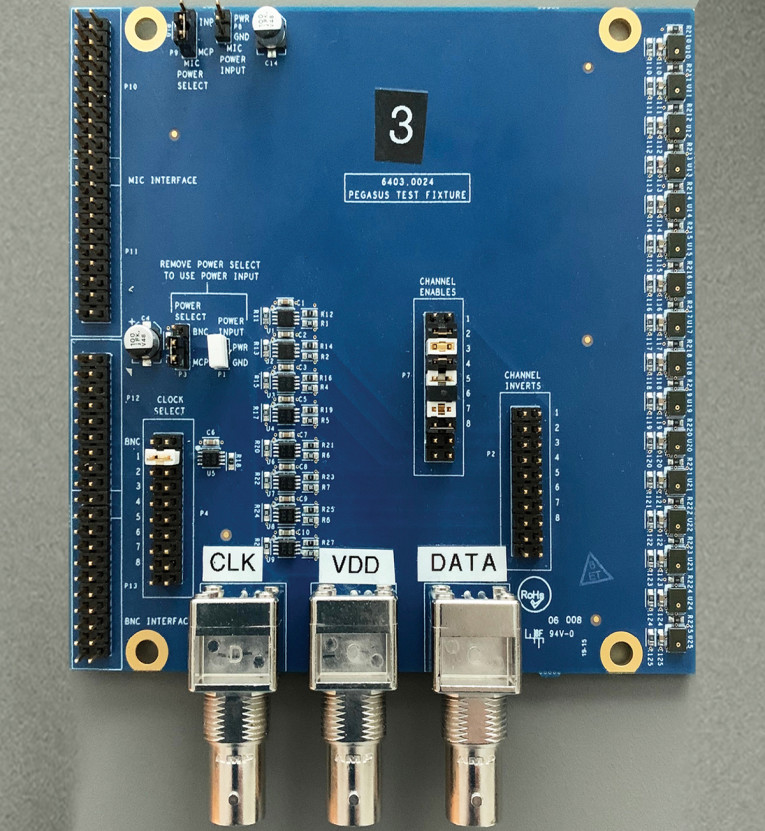
With microphones mounted in a straight-line array, this fixture was not developed for any practical microphone array acoustic measurements (e.g., beamforming), but it serves as a suitable DUT for demonstrating the simultaneous acquisition and measurement of multiple MEMS microphones.
Test Setup
Ideally, microphones should be tested in an anechoic chamber with a low level of background noise, using fixtures that precisely position the DUT and the reference microphone in the sound field. A single reference microphone can be used centered over the array, or multiple reference microphones can be used, depending on the size and arrangement of the array being tested.
In this example, a small desktop test chamber — the Interacoustics TBS25 — designed for testing hearing aids was used. The TBS25 is typically used for acoustic tests in the speech frequency range as it provides approximately 40dB of noise isolation and is anechoic at 500Hz and above. It also has a full-range loudspeaker with a flat frequency response within ±3dB (when the chamber is empty) from 100Hz to 10kHz.
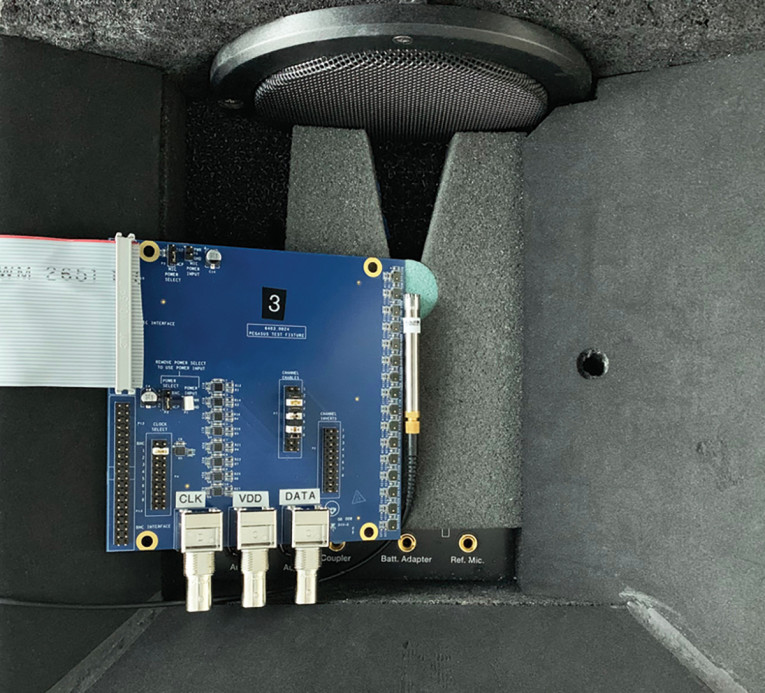
Photo 3 shows the microphone array test fixture in the chamber with the linear microphone array positioned on the axis of the loudspeaker. A 1/4” free-field measurement microphone is located next to the second microphone in the array, at the chamber’s “Test Point” directly in front of and on axis to the loudspeaker. This is the center of the light blue circle in front of the speaker shown in the photo.
Test Procedure
To measure microphone performance, the analyzer was configured for acoustic input (to measure sound pressure from the measurement microphone). In turn, the microphone was calibrated to measure pressure in pascals and levels in dBSPL, using the Transducer Electronic Data Sheet (TEDS), and then checked with a sound level calibrator.
The DUT microphone array and the measurement microphone were placed in the test chamber and the analyzer output was set to Acoustic Mode. Regulation was used to calibrate the generator in dBSPL at a reference level and at one reference frequency (e.g., 94dBSPL at 1kHz).
The acoustic frequency response magnitude was measured at the Test Point. (It is advisable to repeat the measurement a few times to ensure consistency.) When satisfied, this relative level result can be exported and used to equalize the generator output, such that the frequency response magnitude is flat at the Test Point. Checks are made to the acoustic output level and, if required, the output regulation step can be repeated. Next, the input connector and settings can be configured before measuring the acoustic response of the microphone array using the same settings as for the frequency response magnitude.
Leveled Sound Field
While we have calibrated the output from the chamber speaker to ensure the acoustic response is flat at the test point, the generator output should also be equalized. There are two methods for accomplishing this: output EQ and measurement EQ.
Output EQ is applied in the signal path setup, using 30-pole digital filters to equalize all signals generated in a signal path. Measurement EQ is applied in specific sine-based measurements (including acoustic response). The amplitude of the signal is adjusted at every specified frequency to achieve a very flat response.
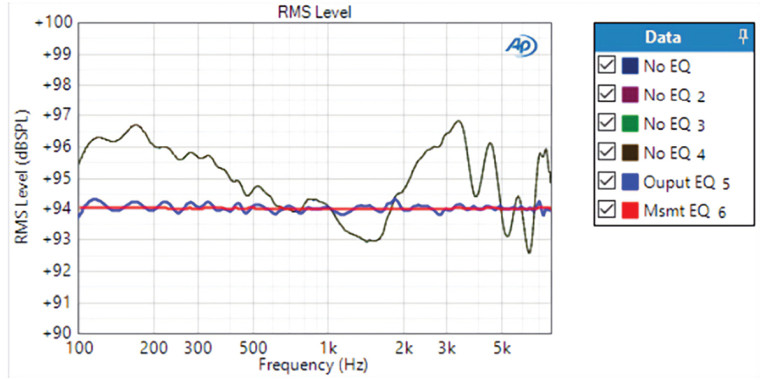
Figure 1a shows the frequency response magnitude measured at the Test Point in the chamber with no EQ, Output EQ, and Measurement EQ. The corresponding deviations from flatness were ±3.33dB (no EQ), ±0.28dB (with Output EQ), and ±0.07dB (with Measurement EQ).
It should be noted that this procedure only calibrates the sound field at the Test Point—the response will vary at other locations in the chamber. Only the response of the DUT microphone at the Test Point can be measured using this setup.
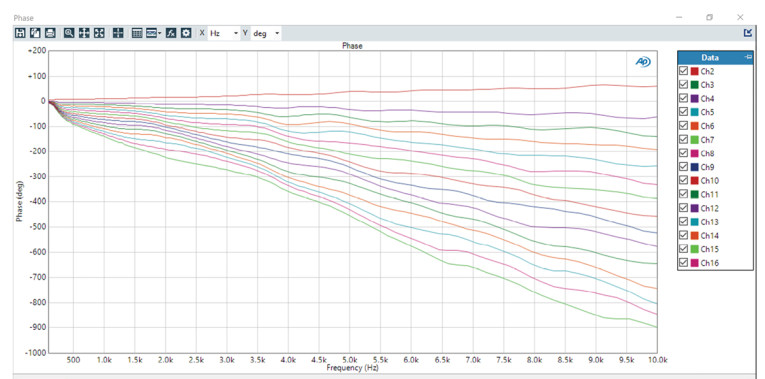
The measured phase response at the Test Point with Measurement EQ (Figure 1b), represents the phase between the reference microphone and the loudspeaker with propagation delay and any constant group delay removed from the phase calculation.
Microphone Array Response
Figure 2a shows the frequency response magnitude of the microphone array. It is important to note that Ch1, the blue trace (dashed line) represents the true frequency response of a DUT microphone, because only this microphone was at the Test Point, where the sound field was calibrated.
The shape of the Ch1 trace is very close to the typical frequency response of this microphone. The RMS Level at 1kHz is approximately -26dBFS. This is, by definition, the sensitivity of the microphone; the electrical response to a standard acoustic input of 94dBSPL at 1kHz.
Another interesting way to look at the phase data is in terms of inter-channel phase. The phase result in the Acoustic Response measurement can also be set to phase relative to Channel 1 (Figure 2b). In the fixture used in this example, Ch1 is the second closest microphone to the speaker and Ch2 is the closest. The average delay of 18.85µs between microphones shows up as a phase difference that increases linearly with frequency. At 10kHz, the phase difference due to one microphone spacing is about 67.9º.
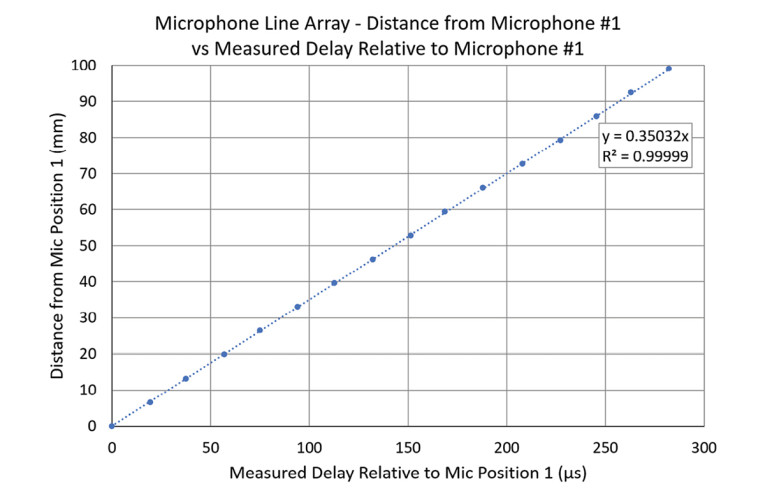
The Acoustic Response Measurement also has a Delay result, which measures the delay of the signal from the speaker to each microphone in the array. Figure 3 shows the relationship between the measured delay at each mic in the array and its distance from the reference position. Note that the curve is a straight line with a slope of 350m/s—very close to the nominal speed of sound in air at room temperature (343m/s). The difference may be due to error resulting from the small distance over which the measurements were made.
Transfer Function Measurements
Using transfer function analysis, the frequency response of microphone arrays can be measured using any broadband signal, including speech or music. Input signals can also be saved to .wav files as they are acquired and analyzed.
This can be useful in applications where the DUT has DSP that blocks sinusoidal signals from being transmitted (e.g., telephony, smart speakers, etc.). For example, users might want to measure transfer functions with speech signals and then run the acquired signals through a DSP algorithm.
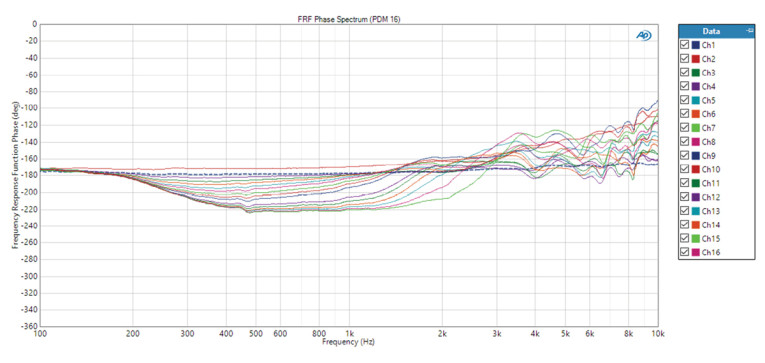
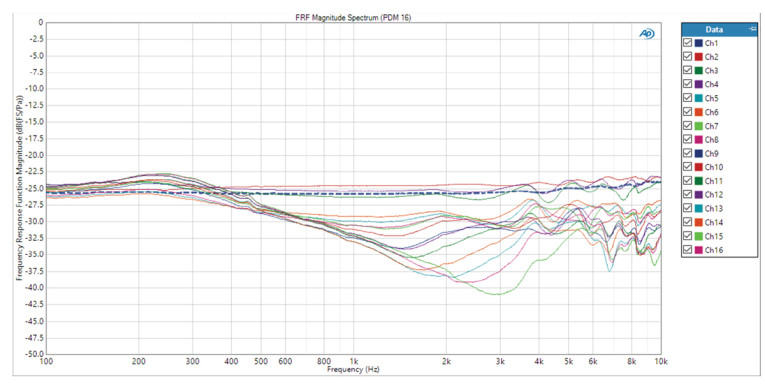
Figure 4 and Figure 5 show the frequency response magnitude and phase, respectively, of the DUT’s microphones relative to microphone Ch1 at the Test Point.
Final Thoughts
The rapid growth of smart, voice-activated devices — and the associated competition among various device manufacturers — is driving the ongoing need to design and produce improved MEMS microphones, microphone arrays, and DSP algorithms for speech processing and beamforming.
Verifying and characterizing the performance of these components and systems requires audio analysis systems capable of simultaneous multichannel acquisition and measurement. VC
This article was originally published in audioXpress, March 2022.