Studio setup is hard. Really hard. Every speaker has a flawed frequency response, every room has acoustic problems, and speaker and especially subwoofer placement are not intuitive but only mildly predictable even to studio design experts. But for a mix or mastering engineer to deliver accurate audio that translates to a variety of playback systems, guessing isn’t good enough. One needs to know what problems exist in the room, and whether any new adjustments are helping or hurting.
FuzzMeasure, an audio analysis program, gives us the tools to know what is happening in a room. The concept is simple: Use the application to play test tones through the speakers, record back those sounds with a measurement microphone, and the software interprets the microphone’s results to graph out frequency response aberrations, impulse response data, harmonic distortion, and much more. With measurements, one can place speakers and subwoofers with precision, accurately set crossover settings, and even dial in equalization using additional hardware or software to achieve a flatter, more accurate sound.
From Røde Microphones to RødeTest
FuzzMeasure is a product of the new RødeTest division of Røde Microphones, a subsidiary of Freedman Electronics, which is also the owner of Aphex, Event Electronics, and SoundField. Peter Freedman started Røde Microphones in 1990 to design and manufacture mics in Australia, aiming for low-cost, high-quality products with home recording enthusiasts in mind. Freedman began experimenting with microphones for cameras in the early 2000s to better record his son’s sporting events. This exploration lead to a broad product line of successful on-camera microphones, extending Røde’s reach outside the studio. Camera mics range from $60 to $600; studio mics, including tube and ribbon mics, range from $150 to $800; and Røde’s most expensive mics at $1,000 each include a 22” shotgun condenser and a four-channel condenser for Ambisonic recordings targeting artificial reality applications.
But the story of FuzzMeasure doesn’t start with Røde. Canadian software designer Chris Liscio created a program to help test the impedance of a DIY speaker project he was building. When Liscio realized there could be a market for measurement software, he spent months developing the program for its initial release in 2004 as FuzzMeasure. The market showed interest in more than just impedance, and Liscio broadened FuzzMeasure to include more functionality, growing into the audio and acoustics measurement software it is today.
Liscio, behind the brand SuperMegaUltraGroovy, began blogging about his progress in 2003. Early posts not only include insights on the challenges and developments related to FuzzMeasure, but his personal computer woes, a baby announcement, and even recounting dates with his wife. But the blog shifted over time to include his company’s other projects, starting with TapeDeck, released in 2008. And in 2009, Liscio debuted Capo, an award-winning program designed to help amateur musicians learn to play instruments by ear.
Liscio shared on his blog that he thought Capo’s success would enable him to hire development help so he could return to FuzzMeasure. He wrote that he missed the old days of losing himself in development for a week or three, making rapid progress on new software features, but that just wasn’t the reality running a larger software business. In 2014, Liscio handed off the administration of SuperMegaUltraGroovy to return his focus to product development and, in 2018, Røde acquired FuzzMeasure from SuperMegaUltraGroovy.
The strategy, confirmed by Peter Freedman, was to use FuzzMeasure as the foundation move for RødeTest, a new measurement division, adding a range of professional acoustic measurement microphones and accessories in the near future.
FuzzMeasure 4.0, the program’s most recent major release, debuted in 2015 with numerous UI updates, more usable graphing functions, and many quality-of-life changes. It’s unclear how much of FuzzMeasure’s current functionality, if any, Røde has added. However, the accompanying documentation is significantly more helpful than it was in 2015, and RødeTest muddies the waters with its Software Maintenance Subscription, though FuzzMeasure is a perpetual license.
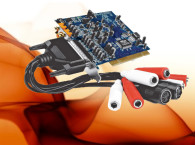
Røde has already rolled out additional hardware to aid in acoustic measuring, including a Røde single-input audio interface. Measurement microphones have been in development at least since 2018, though a product has yet to surface. Fortunately, FuzzMeasure is compatible with all varieties of measurement mics and can load in their unique calibration files.
A Competitive Field
FuzzMeasure is far from the only acoustic measuring software available. Despite its complexity, Room EQ Wizard (REW) remains ever-popular because it’s available on Windows, macOS, and Linux, and it’s free. AudioVero Acourate is a mid-priced option that features an interface and graphs as dated-looking as REW. Smaart by Rational Acoustics is a comprehensive tool used in the live sound environment, specializing in large public address systems including concert line-arrays. What separates the macOS-only FuzzMeasure is that it’s relatively inexpensive at $100 for consumers and $500 for commercial use, its graphing looks the way you’d expect in 2020, and it’s able to provide deep complexity from within a simple and easy-to-understand interface.
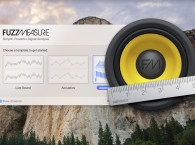
The FuzzMeasure layout is clean: The left side shows recorded measurements to choose from, and the right contains the selected graphs, displaying the data of selected measurements. The top of the interface shows how much gain the connected microphone is receiving at any given time (see Photo 1).
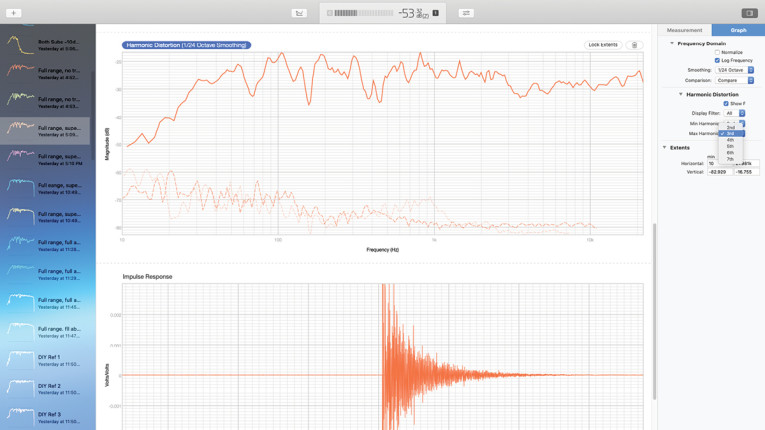
There are only four buttons on the interface. The first is to take a new measurement; the second is to add a new graph to view measurements; the third includes the minimal amount of I/O settings, including sample rate and the number of channels being recorded. And, the last button opens up the Measurement and Graph sub-panels with additional options and information.
Graphs look crisp and high-resolution, and colors are automatically assigned. Exporting graphs as an image is a great feature: The visual is re-rendered according to the dimensions you choose, and there’s even an option to internally render at 2× the resolution and downscale the final result. I rendered a couple of graphs at 3840 × 2160, and they looked great.
Measurements are taken by sine wave sweeps, a far more accurate method over real-time analysis for most purposes. FuzzMeasure includes the ability to export its measurements as a .csv file containing magnitude for 16,383 different frequencies, regardless of the sample rate. Technically, this means that a measurement of the audible range is more detailed when created at 44.1 kHz than 96 kHz.
Rather than share endlessly about its feature set, well-described in its help documentation, allow me to take you on a tour of how I’ve found FuzzMeasure useful in my time with it. And the timing is just right, as I’m still dialing in my new studio space.
A Simple Frequency Test
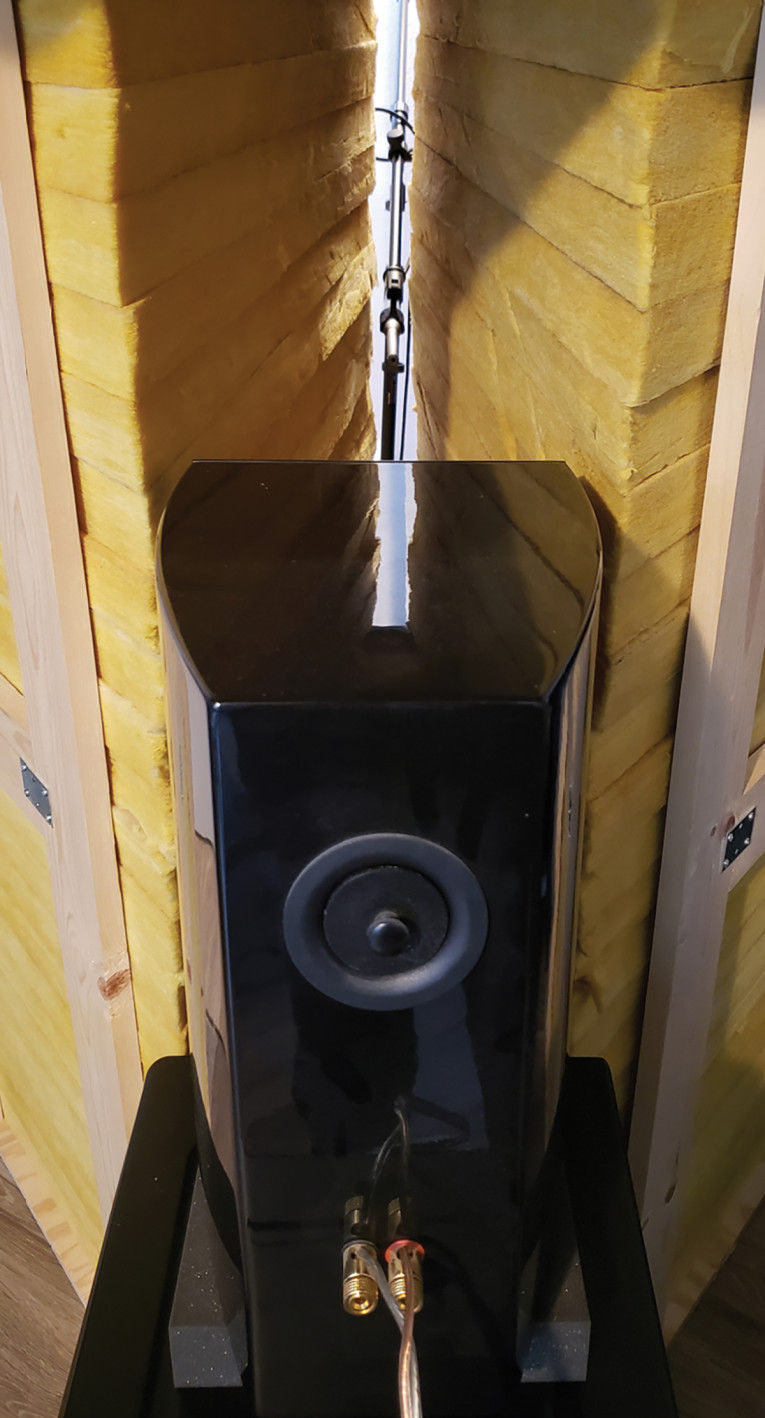
When I built my power amplifier with the Audio Society of Minnesota, I opted to install two sets of inputs, one with a capacitor for filtering out low frequencies and one without, though I’ve never measured at what frequency the filtering begins and how aggressive it is. The perfect job for FuzzMeasure? I rearranged two super-chunk bass traps and an absorption panel to make a “poor man’s anechoic chamber” with a speaker firing into the absorption toward the measurement mic (see Photo 2), and in just a couple minutes of testing, I had results (see Figure 1).
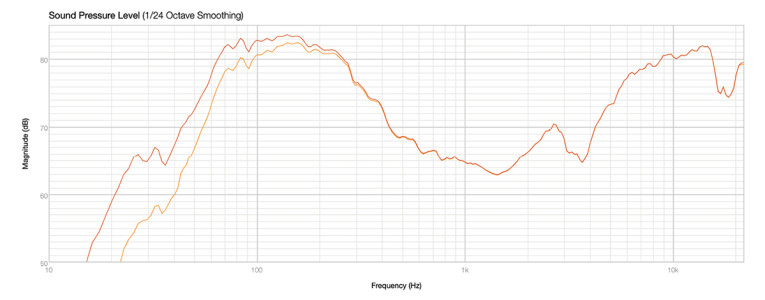
The relevant numbers are that the capacitor rolls off the sound by 1 dB at 150 Hz, 3 dB at 80 Hz, and 6 dB at 49 Hz. That could be relevant for some people when dialing in their sub’s low-pass filter or subtly shaping the tone of a monitor’s low-end.
Unique Approach to Comb-Filtering
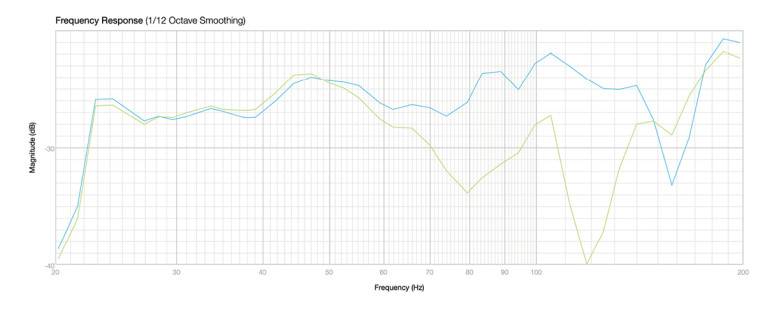
Ever in the pursuit of purer sound, I searched for weeks for a 2’ × 4’ desk with a roll-out keyboard tray so I could cover the surface with an absorption panel to combat comb-filtering, the ugly acoustic phenomenon of high frequencies doubling and negating each other as the result of minutely delayed reflections. I measured with and without my absorptive surface to see if it was making a difference (see Figure 2).
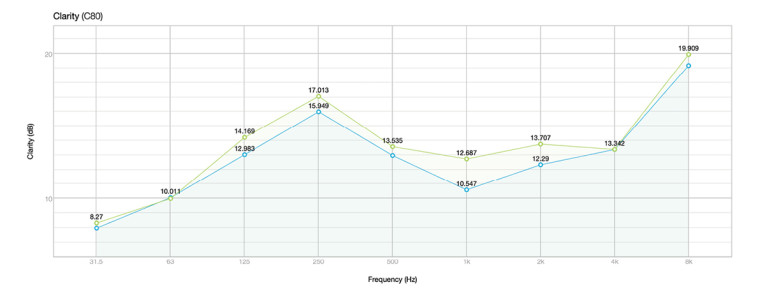
The results were not what I was expecting: The frequency response was different, but not a net positive or negative. However, the clarity improved enough to make the DIY project worthwhile (see Figure 3).
A Small Speaker Shootout
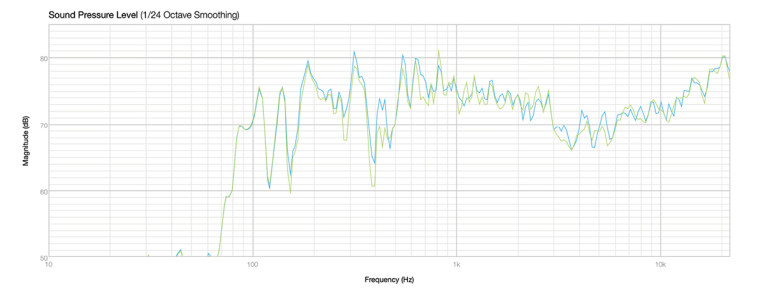
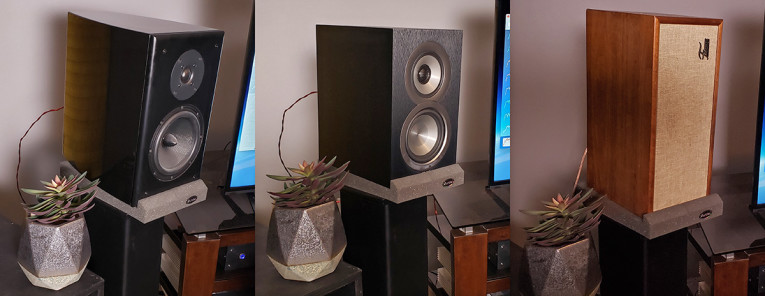
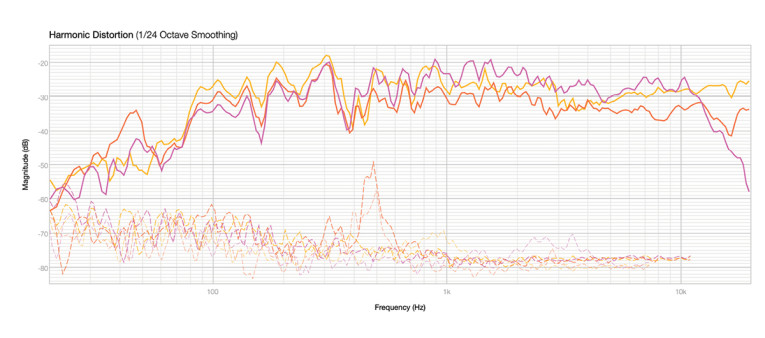
Next, I put my DIY monitors to the test against an Elac concentric three-way and a pair of vintage Frazier one-way speakers (see Photo 3). When measuring audio, it’s important not to apply too much smoothing, and to keep the graph’s scale relevant (see Figure 4).
After viewing a more reasonably detailed graph, none of the speakers look perfect, and the frequency differences begin to stand out (see Figure 5). This graph also includes first and second harmonic distortion, and each of the three speakers has its trouble areas with distortion. Something worth noting: The frequency curves of the speakers are heavily correlated from 100Hz to 300Hz — this speaks to acoustical problems in my room.
Finding the right frequency to cross over signal from your monitors to your subwoofer is important: Set it too high and your system will sound uneven and bloaty; set it too low and deep bass may sound defined, yet there will be a sizable gap in the mid- and upper-bass frequencies. Can FuzzMeasure be used as a tool for finding the best crossover frequency? Let’s find out (see Figure 6).
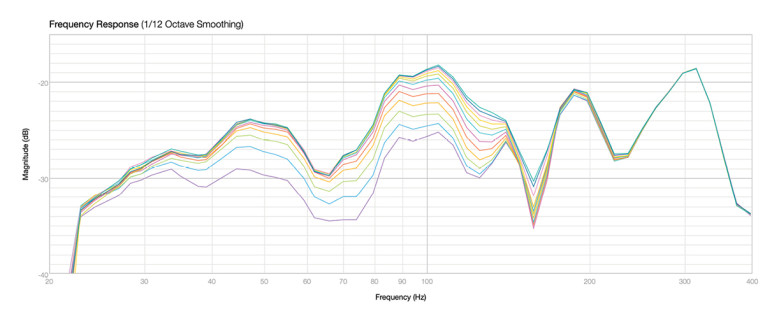
I had expected a dramatic upper-bass bloat or a deep mid-bass hole, but the results were not as cut-and-dry. It’s easy to forget that crossovers are gradual and continue to interact much further along the spectrum. Following the purple trace, the 40Hz crossover contributed the least to the 100Hz bump but dropped far too low in the
70Hz dip. And following the sea-green and navy blue traces, we see that 140Hz and 150Hz have the opposite problem. All of these options would benefit from corrective equalization (EQ), and assuming EQ, most of the crossover frequencies in the middle of the graph would suffice. However, my setup with sealed monitors and dipole subwoofers is unusual — most monitors and subs are ported and experience a much steeper 24 dB/octave roll-off, making the right crossover frequency both more important and easier to find.
FuzzMeasure has many additional uses for subwoofer setup, including checking phase (see Figure 7).
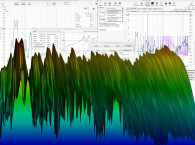
Virtually all rooms benefit from acoustic treatment. For those of us outside of large venues, that means copious absorption, and as thick as possible to be useful at low frequencies. I built my absorption using Owens Corning 703 that comes in 48” × 24” sheets. I made six full-size broadband absorption panels at 6” thick and three more at 4” thick. Also, I cut additional full-size sheets into four triangles each, measuring 24” × 24” with a 33” hypotenuse. I stacked these triangles into wooden frames 54” tall and placed one of these “super-chunk bass traps” into each of my room’s four corners. Does it make a difference? Let’s start by looking at my bass response with and without just the four corner traps (see Figure 8).
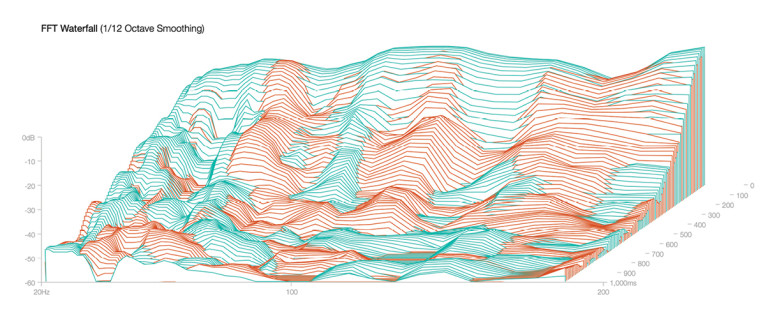
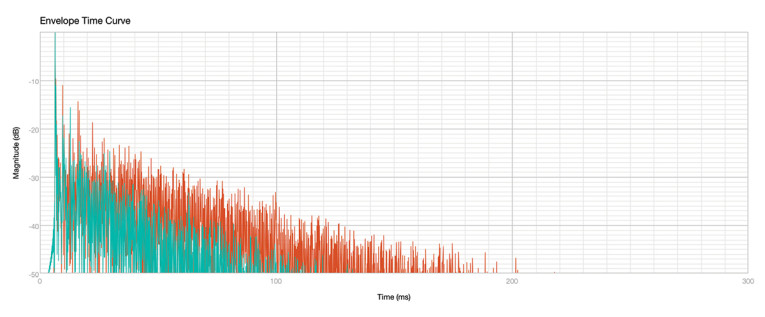
I used a waterfall graph for this test, to demonstrate sound decay over time. The red ridges sloping down demonstrate a longer decay without absorption. The teal upper ridge shows a more even bass response and even increased bass loudness at the listening position. Curiously, absorption seems to have lengthened the decay time of some low frequencies, though at much less relevant levels than the decay times reduced.
But the bass response still isn’t pretty. Can FuzzMeasure inform users as to where and how to use EQ to correct frequency response? It can’t work in tandem with certain EQ units as REW does, nor can it provide correction itself like Sonarworks Reference or Dirac Live. But I did use FuzzMeasure’s graphing to decide which areas need EQ. Boosting EQ to work against frequency nulls is a dangerous game and only to be attempted if you have the amplifier headroom. I applied EQ with my MiniDSP 2×4, and using just a few bands in less than 10 minutes, I was able to substantially cut down on a peak, partially fill in a null, and extend the deep bass output of my subs (see Figure 9) by measuring, making an EQ change, measuring again, and so forth.

Broadband Absorption Measured
What happens when we add my broadband absorbers into the room? I placed two at each of the side-wall first reflection points and another covering my desk. I placed the rest of the panels around the walls of my 20’ × 12’ room.
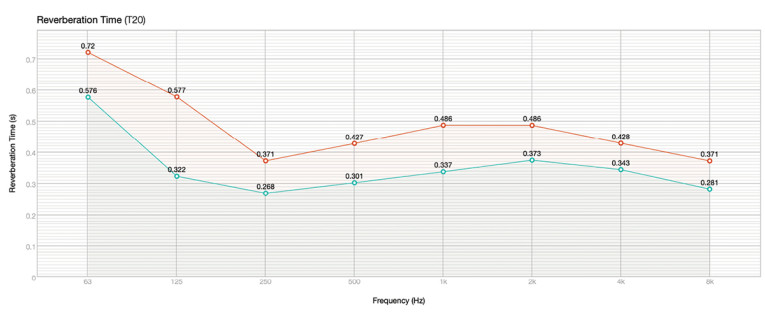
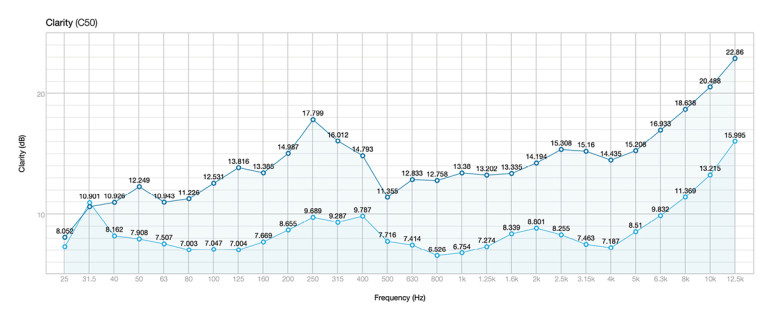
The frequency response improved, but less than I would have guessed. Yet, frequency response is not the full story: Reverberation time is reduced at all frequencies (see Figure 10), giving a tighter, clearer quality to audio. And clarity is substantially improved at all but the very lowest frequencies as well (see Figure 11).
Grading Third-Party Equalization
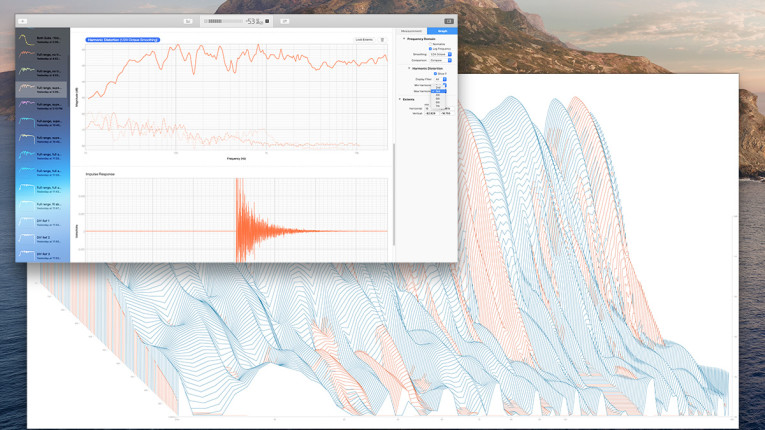
My biggest recent studio upgrade was adding Sonarworks Reference 4. Instead of providing you bountiful data, Reference measures the frequency response of your system and corrects for it (see Photo 4). Measurements are obtained with the provided calibrated measurement mic and a clever software tool, and correction is applied with a desktop application that affects the audio of all programs and/or a DAW plug-in to use on your master bus.

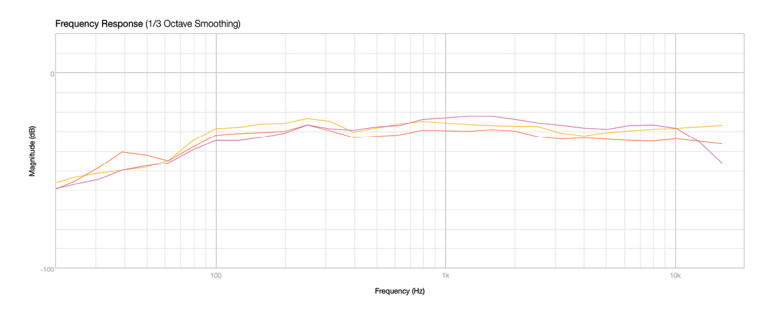
Reference provides the equalization, but what does that correction look like under FuzzMeasure’s microscopic analysis? Used without any acoustic treatment, it helps, but not nearly as much as I would have expected. Peaks are reduced, nulls are somewhat filled, high frequencies are more balanced, and bass response is slightly extended (see Figure 12). That’s great, but Reference only reduced a passable ±8 dB frequency response to a mediocre ±6 dB response.

If your theory is that Reference isn’t able to fill nulls that would better be served by absorption, repeating the test with all acoustic treatment back in the room tells a different story (see Figure 13). I don’t understand why the response without EQ drifted to ±12 dB, and EQ can only rein it in to ±6.5 dB. However, all the clarity benefits of adding treatment are there, and room decay is reduced as expected (see Figure 14).

A little more testing revealed the mystery: Reference 4 decides its EQ curve based on the summing of 37 sine sweeps in unique locations around the listening position. I couldn’t remember all 37 locations, but I remembered 25 of them, measured with FuzzMeasure, and averaged the results (see Figure 15). There’s the ±2.5 dB I would expect from a sufficiently advanced EQ. And without the room-induced dramatic frequency swing between 100 Hz and 110 Hz, the response is more like ±1.75 dB—truly exceptional.

A few caveats, though: I wish Reference could correct for a smaller listening area, which would further flatten the true frequency response in the mixing seat. And I’m forming the opinion that the acoustic treatment I built for my previous studio location is not adequate in this new, larger room. I would not have thought of these without FuzzMeasure.
Slightly Buggy
I struggled to get my mic preamp gain loud enough for FuzzMeasure without clipping. Eventually, I discovered that I couldn’t keep my mic plugged into my interface’s second input without offering FuzzMeasure another mic in the first input. It took some hair-pulling to get FuzzMeasure to work at 96kHz, wrangling sample rate settings in three places and performing a couple of computer restarts — I can’t be sure if this is the fault of FuzzMeasure or my interface, though I’ve never had such troubles with the interface before in Windows.
Try as I might, I can’t get useful data out of the Difference tool. In theory, I should be able to use it to see how the frequency of the left and right channels differ by 3 dB to 10 dB. Instead, I get readings that separate the channels by more than a million decibels.
Conclusion
FuzzMeasure is a powerful program that’s also simple to use. I found it incredibly helpful in answering questions that have long plagued me, it showed the strengths and weaknesses of my current acoustic treatment in a way I hadn’t seen before, and it even revealed a significant shortcoming in my favorite room correction software.
The clean-looking, high-fidelity graphs are perfect for anyone publishing their work, professional or hobbyist. And FuzzMeasure has additional uses beyond the scope of this review, including direct equipment measurement.
I get the sense that FuzzMeasure has not grown a great deal since it was acquired two years ago, but I look forward to Røde measurement mics coming in the future, and I like the idea of Røde taking on the world of measurement equipment and software just as it did on-camera microphones.
As FuzzMeasure does not provide any function beyond measuring and displaying information, it’s a powerful tool for select uses only. Considering that, and its macOS-only status, you’ll know whether or not you have need of it. And if you do, I heartily recommend it. aX
Test Gear | Sources
2× Crown XLS1000 amplifiers for subwoofers
DIY stereo preamp based on the Nelson Pass BA-3
DIY stereo power amp based on the Nelson Pass F5
Focusrite 18i20 first-gen audio interface
Focusrite, PLC | https://focusrite.com
Loss Senderos Studios, LLC | https://lossenderosstudio.com
Micromega MyDac | https://micromega.com
MiniDSP 2x4: used for subwoofer crossover and dipole correction; not in the signal chain for the monitors
miniDSP | https://www.minidsp.com
Monitors: sealed DIY speakers in curved cabinets, MISCO 6.5” woofer and SB Acoustics 1” tweeter
FuzzMeasure 4.2.2
RØDE Microphones | https://www.rode.com
RØDE Test | https://www.rodetest.com
Sonarworks Reference 4, version 4.4.3.2 and Sonarworks Reference calibrated measurement microphone
Sonarworks | https://www.sonarworks.com
Subwoofers: 4× cabinets, DIY dipole design by Siegfried Linkwitz, 2× 12” drivers per cabinet
SuperMegaUltraGroovy | https://supermegaultragroovy.com
TC Electronic BMC-2 volume control
This article was originally published in audioXpress, May 2020