Under development since 2009, CrossLite+ is a dual-channel FFT analyzer that will function with basically any USB-type recording interface and a measurement microphone. Measured data can also be imported from other analyzer as Rational Acoustics Smaart, Audiomatica CLIO, Klippel KA3, and ARTALabs ARTA. Once data has been measured or imported to CrossLite+, it can be used to design a complete crossover for a powered loudspeaker.
Once data has been measured or imported, CrossLite+ can be used to design a complete crossover for a powered loudspeaker. Next, a user can create DSP FIR and IIR filters — high pass (HP), low pass (LP), shelving HP/LP, and parametric EQ — these can then be downloaded to processing platforms that currently include miniDSP and Armonia Plus from Powersoft. For powered studio monitor design or powered WiSA home theater speakers, this should be an outstanding tool for designing DSP-type powered loudspeakers.
I wanted to provide some more detail about this interesting software via a short two-way speaker design tutorial. The drivers that F.MonteiroScience used for this explication were an 8” pro sound woofer and a 1” titanium compression driver and horn.
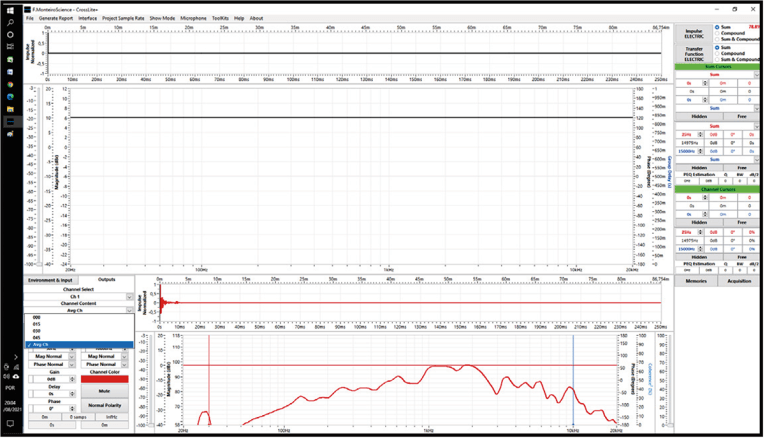
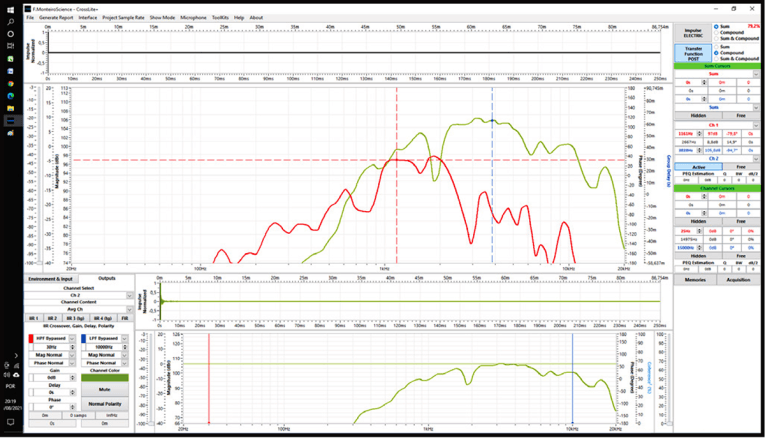
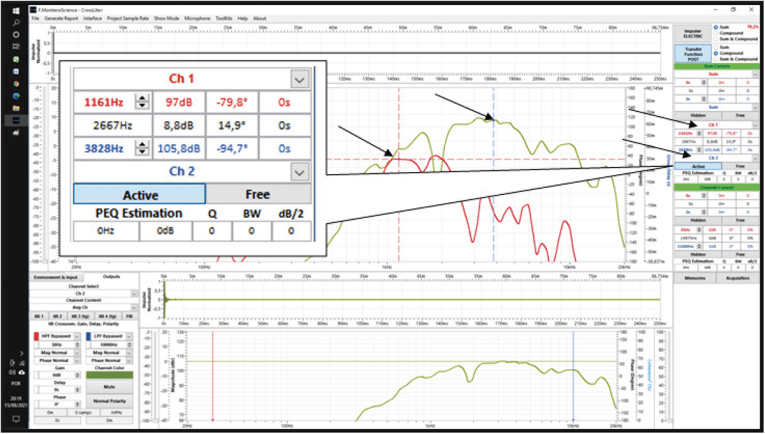
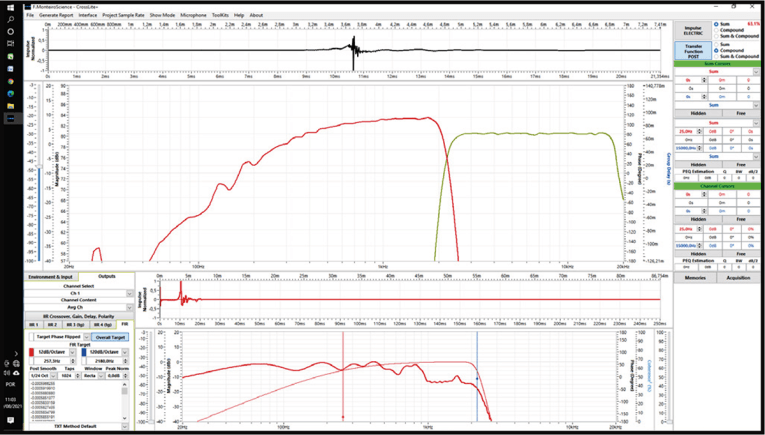
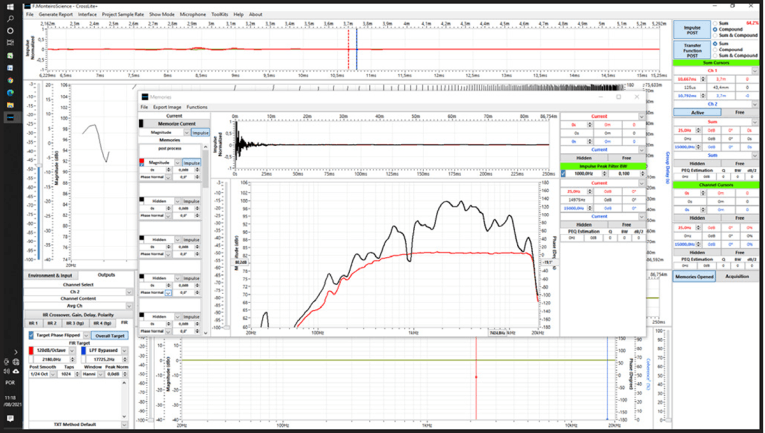
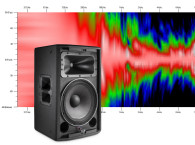
Figure 1 and Figure 2 show the response curves (both on- and off-axis) measured by the built-in Fast Fourier Transform (FFT) analyzer — the red curve being the woofer and the green curve the titanium high-frequency driver. Figure 3 illustrates the method used to do a sensitivity calculation. In this case the high-frequency driver was determined to be an 8.8dB SPL differential between the two drivers.
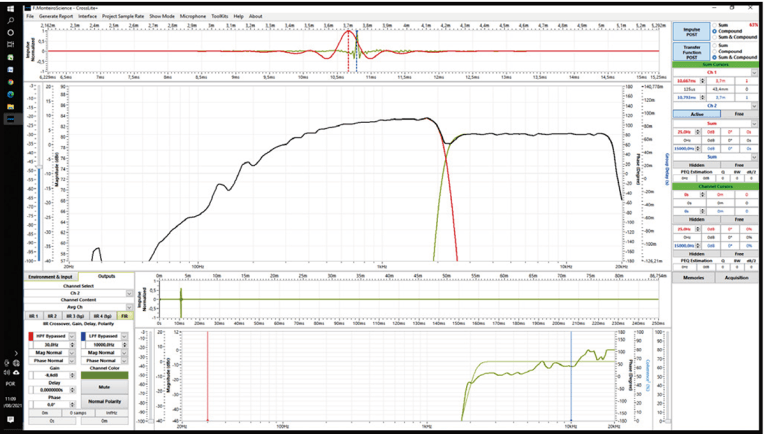
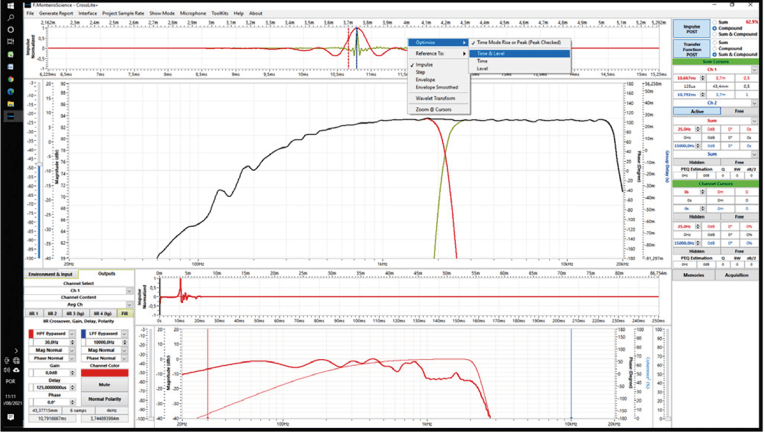
Next, a flat target response was applied to both drivers and Crosslite+ optimized the FIR filter response as seen in Figure 4 and Figure 5. However after optimizing the filters, we still have a sensitivity issue. Note also the impulse curves at the top of the graph in Figure 5 indicate that these drivers were not time aligned. Looking at graph in Figure 6, Crosslite+ has now adjusted the sensitivity and corrected the alignment issue by zeroing the phase.
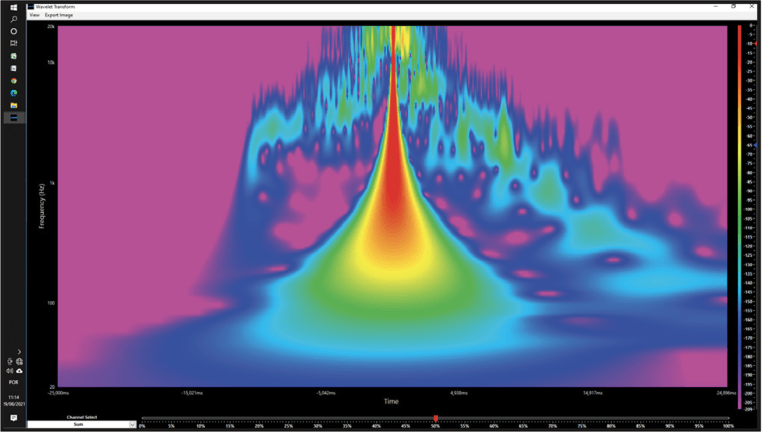
The result was an acceptably flat response profile. The Wavelet Transform shown in Figure 7 confirms the phase linearity at all frequencies, as well as symmetry between left and right impulse sides, while Figure 8 shows the corrected phase response that facilitated the time alignment of the two impulse responses.
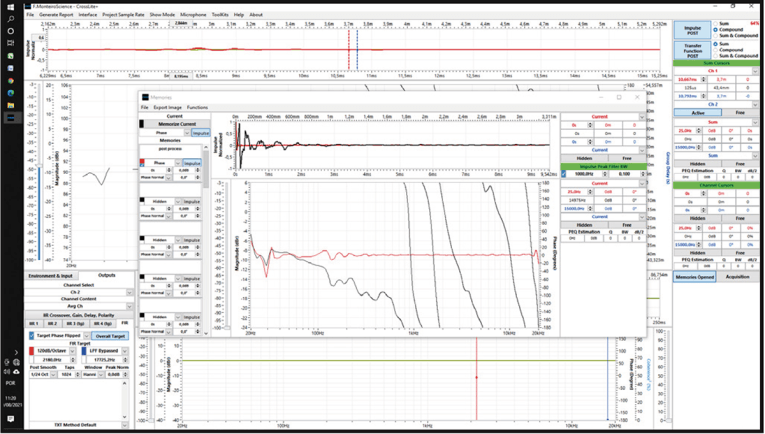
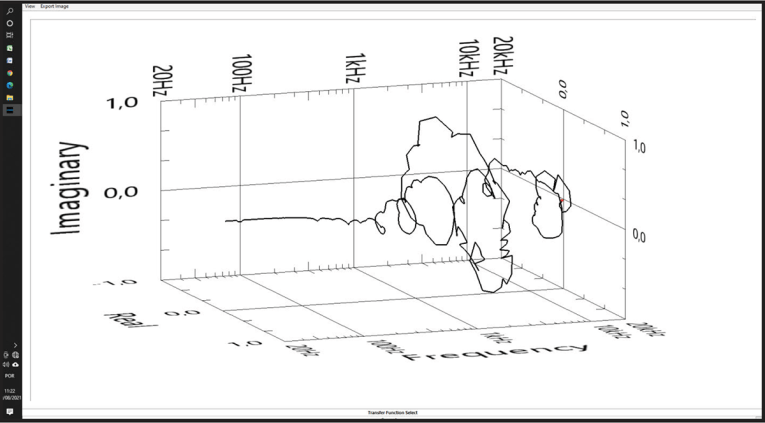
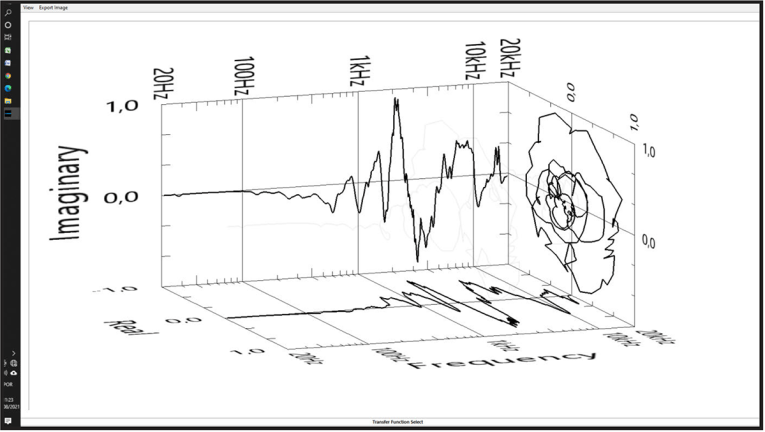
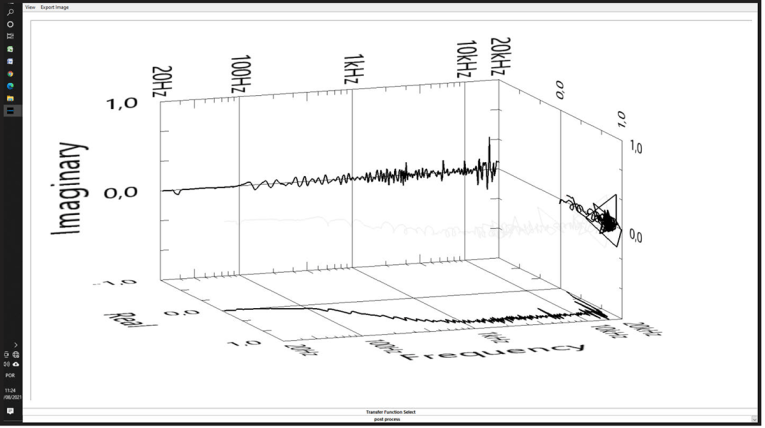
Another way to compare phase linearity at all frequencies, is to use the complex (real and imaginary) transfer function 3D graphs shown in Figures 9–11. Looking at the graph shown in Figure 12, a memory button has allowed us to compare the original on-axis response with the final FIR developed filter response. This complete filter set can now be downloaded to a DSP platform such as miniDSP or Powersoft’s Armonia Plus.
Obviously, Crosslite+ is a very powerful software for the development of DSP crossovers for powered loudspeakers. Priced at $500, Crosslite+ is available online from F.MonteiroScience. VC
www.fmscience.com.br