In the studio monitor market, Ex Machina Soundworks uses a TPCD midrange cone in a coax driver (based on the SEAS King Coax) for both of its monitors priced from $8000 to $11,500, plus THX certified the Perlisten Audio’s $15,000/pair S7t tower, which uses four 6.5” TPCD monitors, it’s obvious that this relatively new diaphragm material has gained a fair amount of attention and acceptance rather quickly.
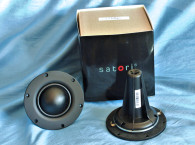
In terms of features, the 6.5” MR16TX-8 is built on a proprietary two-piece six-spoke cast-aluminum frame, comprised of narrow (about 10mm) spokes, completely open below the spider (damper) mounting shelf for cooling. Additional cooling for this driver is provided by six 4mm diameter vents in the voice coil former, as well as a 12mm diameter flared pole vent.
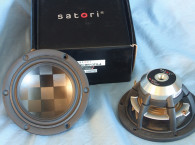
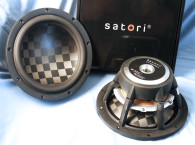
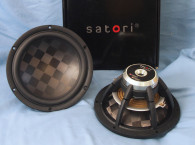
The cone assembly consists of a curvilinear inverted single piece “bowl” shaped cone (Photo 2). The cone is glued to a conventional-looking conic section of TPCD joining the cone to a normal-looking voice coil next joint. Compliance is provided by an inverted NBR surround, with the remaining compliance coming from a 3.5” diameter flat BIMAX spider (damper).

The motor is an FEA-optimized neodymium magnet-type with milled plates and extended copper sleeve shorting ring (Faraday shield) on the pole piece. Driving the cone assembly is a 35.5mm (1.4”) diameter voice coil wound with round copper-clad aluminum wire (CCAW) on a non-conducting fiberglass former. Last, the IEC 268-5 power handling is rated at 30W (obviously also dependent upon whatever high-pass filter frequency is incorporated), and the voice coil silver lead wires are terminated to gold-plated solderable terminals located on opposite sides of the former to discourage rocking modes.
Since this midrange is likely be crossed over at a minimum of 200Hz, I chose not to use the multi-voltage LEAP 5 LTD TSP testing protocol and instead established parameters with a single two-wire impedance measurement that uses the source impedance of the generator. The goal here was to establish an enclosure volume to ascertain the impedance resonance and Q. This information is useful if a passive high-pass network is employed, and of course, not relevant if using active filters.
Following my established protocol for Test Bench testing, I no longer use a single added mass measurement and instead use the company supplied Mmd data (9.57 grams for the MR16TX-8). The single impedance sweep for each driver along with the Mmd data was used to produce the TSL parameters for the two Satori MR16TX-8 samples. Figure 1 shows the data for the free-air impedance curve. Table 1 compares the single sweep TSL data and factory parameters for both of SB Satorti midrange samples.


Since this driver will likely have a high-pass filter of at least 200Hz to 250Hz, I only wanted to establish the F0 and Q for a box volume as reference for a passive network design. Using the LinearX LEAP 5 legacy software’s Quick Design utility, I came up with two volumes, a 685in3 sealed enclosure and 1059in3 vented box tuned to 40Hz, however the upper impedance peak of the vented box was very close to the exact frequency of the sealed box resonance (70Hz), so it would not provide any passive network advantage over the sealed box and was discarded.
Figure 2 displays the frequency response result for the SB Satori TPCD 6.5” midrange in the single simulated sealed enclosure at 2.83V. The closed box alignment produced a 3dB down frequency of 69Hz, Qtc=0.67. Figure 3 and Figure 4 give the box impedance and group delay curves, respectively. Here the F0 and Q data could be used to design an LCR resonance conjugate filter to facilitate a 100Hz to 400Hz passive high-pass filter. For the purposes of this explication, Klippel analysis was not appropriate, since this device is not being used in its piston range.


I next mounted the SB Satori MR16TX-8 TPCD midrange in a foam-filled enclosure that had a 15”×8” baffle. Then, I measured the device under test (DUT) using the Loudsoft FINE R+D analyzer and the GRAS 46BE microphone (courtesy of Loudsoft and GRAS Sound & Vibration) both on- and off-axis from 200Hz to 20kHz at 2.0V/0.5m, normalized to 2.83V/1m using the cosine windowed FFT method. All of these SPL measurements also included a 1/6 octave smoothing (this is done to match the resolution of the 100- to 200-point LMS gated sine wave curves that I’ve been using in the column for a number of years).
Figure 5 gives the on-axis response, indicating a moderately smooth rising response that is ±3dB (assuming the response flattened with a shelving filter) from 200Hz to 4kHz with breakup mode at 5kHz and a response that extends out to 18kHz. Figure 6 displays the on- and off-axis frequency response at 0, 15, 30, and 45 degrees. The -3dB at 30 degrees with respect to the on-axis curve occurs at 2.5kHz, so a low-pass cross point in that vicinity should be work well to achieve a good power response.


Figure 7 gives the normalized version of Figure 6, while Figure 8 displays the CLIO Pocket Analyzer’s horizontal polar plot (in 10° increments with 1/3 octave smoothing). And finally, Figure 9 gives the two-sample SPL comparisons for the 6.5” SB Acoustics Satori TPCD driver, showing a close match between 0.75dB to 1dB up to 18kHz.


For the remaining series of tests on the SB Satori MR16TX-8 midrange transducer, I launched the Listen SoundCheck AudioConnect analyzer software along with the ¼” SCM microphone (graciously supplied to Voice Coil magazine by the folks at Listen, Inc.) to measure distortion and generate time-frequency plots. For the distortion measurement, I mounted the 6.5” driver in free air and set the SPL to 94dB at 1m (3.92V), using a pink noise stimulus. I then measured the distortion with the Listen microphone placed 10cm from the driver. This produced the distortion curves shown in Figure 10.

I then employed the SoundCheck software (V21) to get a 2.83V/1m impulse response for this driver and imported the data into Listen’s SoundMap Time/Frequency software. Figure 11 shows the resulting cumulative spectral decay (CSD) waterfall plot. Figure 12 shows the Short Time Fourier Transform (STFT) plot.


Looking at all the objective TSP and response data I collected for the new SB Satori MR16TX-8, the performance looks good and provides the desirable timbre of a 6.5” TPCD midrange to the SB Satori line of TPCD transducers. For more information, visit the SB Acoustics website at www.sbacoustics.com. VC
This article was originally published in Voice Coil, December 2024