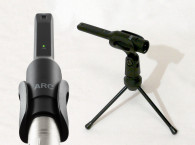
ARC 2.5 is an updated version 2.0 with several new features such as 64-bit OS support and up to 192 kHz sample rate (although the User Manual still says 48 kHz). But the biggest improvement is the inclusion of a MEMS microphone (see Photo 1) with a flatter frequency response as compared to the 2.0 mic.
Both versions use the patented Audyssey MultiEQ XT32 room correction technology, which corrects both the frequency and time responses. Windows and Mac OSX are supported but the ARC system is 64-bit so the OS and DAW must be 64-bit. There are two plug-ins: the measurement module and the correction module. Both are standard VSTs for Windows. Of course, this means that all your music listening must be done through your computer, but the acoustic improvement is worth the effort.


Measurement Module
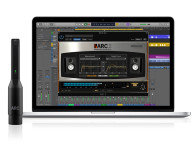
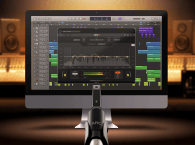
The measurement module’s first screen is simply introductory, click NEXT. You are then asked to select a microphone, click the MEMS mic and click NEXT. The Step 2 screen (see Photo 2) is Audio setup. Select your audio hardware (sound card) and click NEXT. The Step 3 screen (see Photo 3) sets the measurement sound level. Click the TEST bar and adjust the speaker’s volume control, mic preamp gain or the on-screen slider until the bar indicator is in the OK range, again click NEXT to load the Measurement screen (see Photo 4). A minimum of seven measurements are required around your listening position.
The User Manual, included in the Supplementary Material, has some suggestions for various chairs and sofas. I used the positions shown in Figure 1. Move your microphone to start position, number 1, near the center of the listening area. The vertical arrow will be under the on-screen “1” box. Click the TAKE MEASUREMENT bar. The arrow will move to box “2” so move your mic and take that measurement. Continue until you have taken at least seven, only then can you proceed to the next step to save your measurement file — give it a name and click SAVE.
After I used the seven positions shown in Figure 1, I took a set of 11: the original seven plus two equally spaced behind the chair and two in front. When I measured the correction results, there was no noticeable difference between the two. It seems seven measurements were adequate.


by Reaper on the other computer. I exported each display as a text file for later averaging of the data from the seven
mic locations. The two “before” and the two “after” averages are graphed in Figure 3.

Correction Module
I attempted to use the free Room EQ Wizard (REW) to verify the correction but this didn’t succeed. Primarily, I use Reaper as my DAW and for it to work in pass-through mode, it must be installed with its optional ASIO driver. The sound card must also have an ASIO driver, which my ESI Juli@ card does, and REW must have an ASIO driver, which it does. Despite this apparent compatibility, my prior EQ measurements using REW through Reaper showed a 60 dB drop in level between 2 kHz and 22 kHz. I’ve measured this room many times and knew this was a gross error.
I tried three different microphones, including the MEMS, different speaker volume levels with compensating changes in the mic preamp gain. All to no avail so I went to “Plan B” — white noise as diagrammed in Figure 2.
Using the free Audacity audio editor, I generated a 30-second segment of white noise and saved it as a 24-bit, 96 kHz wav file. Reaper played this file directly into the sound card for the Before-EQ measurements and then through the ARC Correction plug-in for the EQ measurements. The mic’s output was recorded by TrueRTA running on a second computer. Photo 5 shows a typical recording. I exported each of the TrueRTA sixth-octave displays as text files and then imported them into a Microsoft Excel spreadsheet and averaged them. The averages are graphed in Figure 3.


The correction module has the setup screen (see Photo 6) with drop down menus for the correction file to be loaded and for the correction curve (see Photo 7). This menu includes a variety of presets including four custom targets. If you happen to be feeling wild and crazy, you could produce some interesting sounds. I just chose flat and sequentially loaded my two correction files.
The Left and Right orange lines (see Photo 8) are ARC’s room measurements and the white lines are the calculated corrected responses. The green target line is hidden behind the white line. The bar-graph meters under the frequency response displays show the Left and Right levels either into the module if the PRE button is depressed or the output level when the POST button is depressed. It’s a good idea to keep the level below 0 dB to
prevent clipping.
Figure 3 shows the Left and Right before and after correction frequency responses. The measured correction isn’t as flat as the calculated white lines but they are a great improvement over the uncorrected. Clicking the MONITOR bar near the screen’s bottom displays the screen with its Level and Mode controls and large Volume control— attractive as well as functional (see Photo 9).

Time Response
As I mentioned earlier, ARC corrects the time response in addition to the frequency response. Before and after-correction waterfall plots would be useful, but not possible, because the needed phase information is not available because I couldn’t use REW. So on to “Plan C” to measure reverberation time, RT-60, the time it takes an impulsive sound to decay to 60 dB below its initial value.
Getting a single measurement of a room’s RT-60 is easily done with a balloon burst, a clapper, or gun shot. But measuring it as a function of frequency is more difficult without phase data. However, I found an informative video presentation by Prof. Clive Greated in which he explained how to do it—using band-pass filtered white noise.
It seems a four-pole Butterworth filter with a 1-octave bandwidth works well and may even be optimal. I searched online and found a free VST plug-in that’s perfect for this job: Engineers Filter. Again, using Audacity, I generated and saved a two second white noise file. I filtered this file eight times saving the files as white-63.wav through white-8000.wav—each with center frequencies one octave apart. Photo 10 shows a screenshot of one of the filters.


Ideally, I would use an omni-directional speaker and microphone but I used my main speaker system (see Photo 11) with the omnidirectional MEMS mic pointed at the center of the wall behind the speakers. Using Reaper, I played each of the filtered files without ARC correction and recorded the mic’s output with Audacity naming them NoEQ-63.wav through NoEQ-8000.wav. This was then repeated through the ARC correction plug-in.
Audacity is a good choice for analyzing these files because its amplitude scale can be easily switched to decibel with the signal’s peak at 0 dB and -60 dB at the center line. Measuring a 60 dB range is challenging so I normalized the wav file to -30 dB, measured the time and doubled it. But even working with a 30 dB range requires care. I found I got the best signal-to-noise ratio (SNR) by turning the mic preamp’s gain down to 20 dB and increasing the speaker volume to LOUD. Photo 12 clearly shows a 100 mSec decay time, which doubles to 200 mSec.
Last year I evaluated an actual “room correction system,” the Primacoustic London 12 Kit of sound absorption panels. The article “Primacoustic London 12 Kit: Installation and Performance Tests” (audioXpress, February 2017) included my REW room measurement graphs. The after-correction, third- octave RT-60 data is included here in Figure 4 along with my current before-and-after curves. Although the one-octave curves have less frequency detail, they are all very similar and well within the guidelines for a small room.
Even with the absorption panels the RT-60 times at the lower audio frequencies show a noticeable increase. The larger panels on the rear wall (see Photo 13) are only 2” thick which is minimally effective below 200 Hz even though they are separated from the wall by at least 3” (one is corner mounted) with mesh bags of Acousta-Stuf hung behind them. Thicker panels would have higher absorption below 200 Hz but were not included in this kit.
There is very little difference between the current before-and-after correction curves. It may be that the London 12 Kit provides sufficient time correction that the ARC system could not improve. Certainly, music sounds excellent through the ARC correction.


Final Thoughts
The ARC system is very easy to use and quickly gives good correction. Measuring just the minimum seven locations around a single chair worked fine for me. But I expect if the listening area is larger, a sofa, or group of seats in a home theater, a larger number of locations would be better. I think it’s a good buy at $199.99 and a real bargain if you have version 2.0. Buy the MEMS microphone for $69.99 and download the version 2.5 software from the IK Multimedia website. You can activate it with your 2.0 license. aX
Project Files
To download additional material and files, visit http://audioxpress.com/page/audioXpress-Supplementary-Material.html
Resource
C. Greated, “Introduction to the Measurement of Reverberation,” University of Edinburgh, Scotland.
www.youtube.com/watch?v=imHvRBOMg84
Sources
Audacity Audio Editor - Audacity | www.audacityteam.org
Reaper DAW - Cockos, Inc. | www.reaper.fm
ARC 2.5 System IK Multimedia | www.ikmultimedia.com/products/arc2
Engineers Filter - KVR Audio, Inc. | www.kvraudio.com/product/engineersfilter_by_rs_met
Acousta-Stuf polyfill - Parts Express | www.parts-express.com
REW - Room EQ Wizard | www.roomeqwizard.com
TrueRTA Spectrum Analyzer - True Audio| www.trueaudio.com
This article was originally published in audioXpress, March 2018


