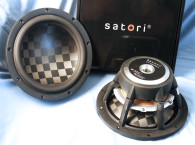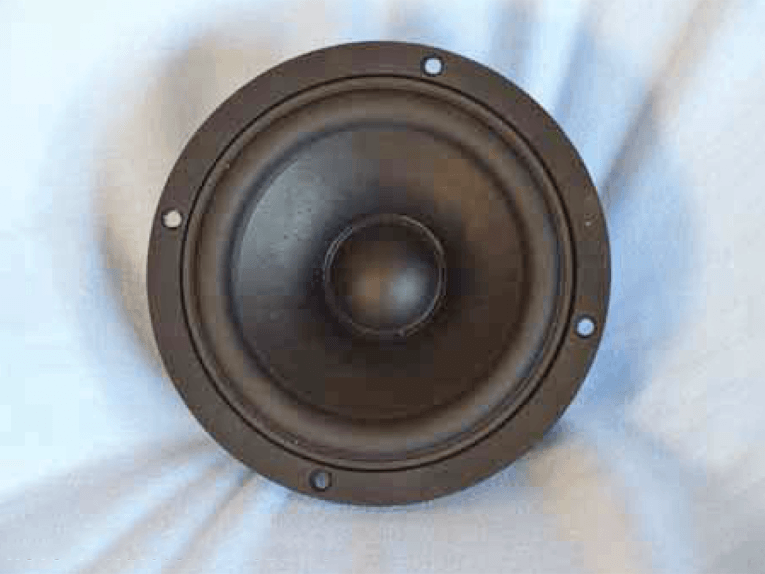
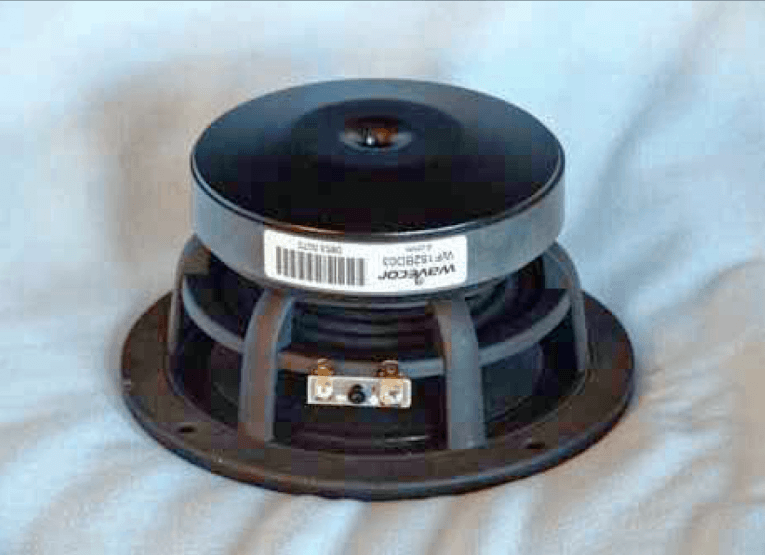
In terms of features, like the WF120BD04, the WF152 is built on a six-spoke cast aluminum frame that sports a completely open area below the spider mounting shelf for enhanced cooling. The WF152 cone assembly includes a very stiff curvilinear black coated semi air dried cone with a 1.5″ diameter convex black coated paper dust cap. These are suspended by an NBR butyl rubber surround that has a nice shallow angle where it attaches to the cone edge and a 4″ diameter black convex flat spider.
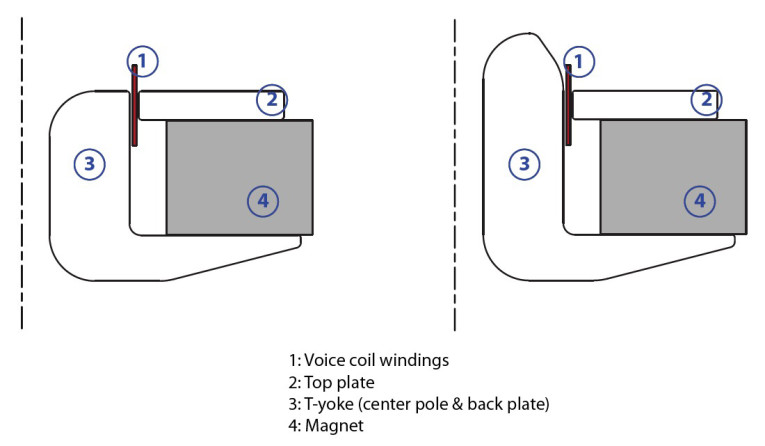
Driving the assembly is a 32mm (1.25″) diameter voice coil using round copper wire wound on a black nonconducting fiberglass voice coil former that incorporates a series of eight 4mm diameter former vents just below the neck joint. The motor uses a single 17mm × 107mm ferrite magnet sandwiched between a shaped T-yoke and 5mm high front plate, both with a black emissive coating for enhanced cooling performance. For additional cooling, the T-yoke incorporates a dual flare 8mm diameter pole vent.
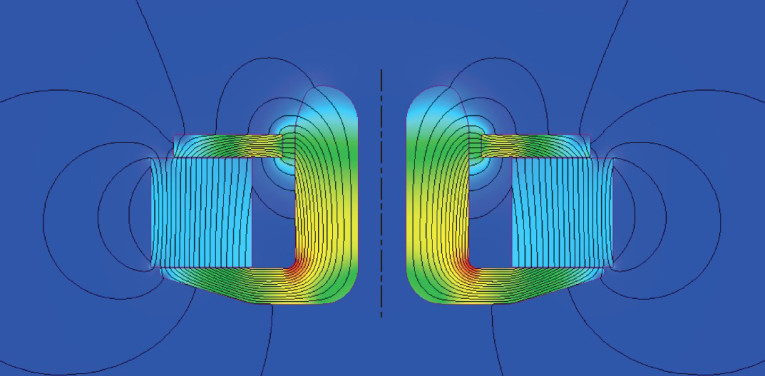
The motor also incorporates an aluminum Faraday shield/shorting ring as well as a copper cap on the top of the pole piece for distortion reduction. Voice coil tinsel lead wires are terminated to a set of gold-plated terminals.
I began testing the WF152BD03/04 midbass woofer using the LinearX LMS analyzer and VIBox to produce both voltage and admittance (current) curves with the driver clamped to a rigid test fixture in free-air at 0.3V, 1V, 3V, 6V, and 10V. As has become the protocol for Test Bench testing, I no longer use a single added mass measurement and instead used actual measured mass, but the manufacturer’s measured Mmd data. The 10V curves were just nonlinear enough to prevent a good curve fit, so I eliminated them.
Next, I post-processed the eight 550-point stepped sine wave sweeps for each WF152 sample and divided the voltage curves by the current curves (admittance) to derive impedance curves, phase added by the LMS calculation method, and, along with the accompanying voltage curves, imported to the LEAP 5 Enclosure Shop software. Because most Thiele/Small data provided by OEM manufacturers is produced using either a standard method or the LEAP 4 TSL model, I additionally produced a LEAP 4 TSL model using the 1V free-air curves. I selected the complete data set, the multiple voltage impedance curves for the LTD model (see Fig. 3 for the 1V free-air impedance curve) and the 1V impedance curve for the TSL model in the transducer derivation menu in LEAP 5, and produced the parameters for the computer box simulations. Table 1 compares the LEAP 5 LTD and TSL data and factory parameters for both WF152BD03/04 samples.
LEAP parameter Qts calculation results for the WF152 were close to the factory data, except for the sensitivity; however, mine is a calculated midband sensitivity that is part of the T/S calculation routine and Wavecor uses average SPL in the 300Hz-1kHz range. As is normal for these reviews, I followed my usual protocol and set up computer enclosure simulations using the LEAP LTD parameters for Sample 1. I programmed two computer box simulations into LEAP, one sealed and one vented. This resulted in a 0.085ft3 Butterworth sealed enclosure with 50% fiberglass fill material, and a 0.146ft3 vented QB3 alignment enclosure simulation with 15% fiberglass fill material and tuned to 60Hz.
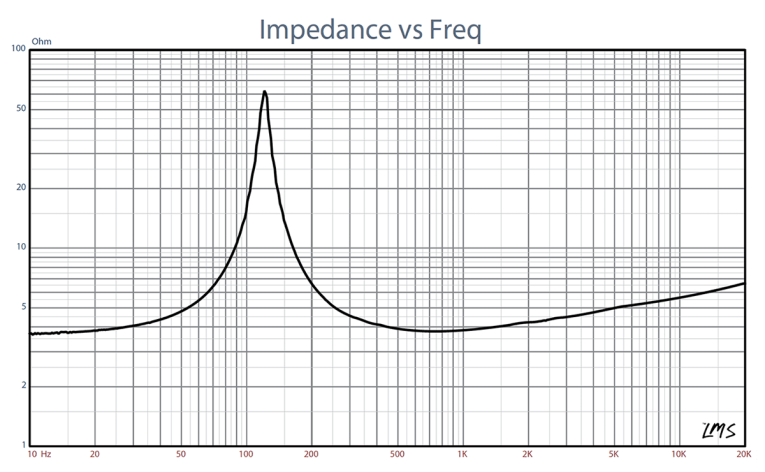
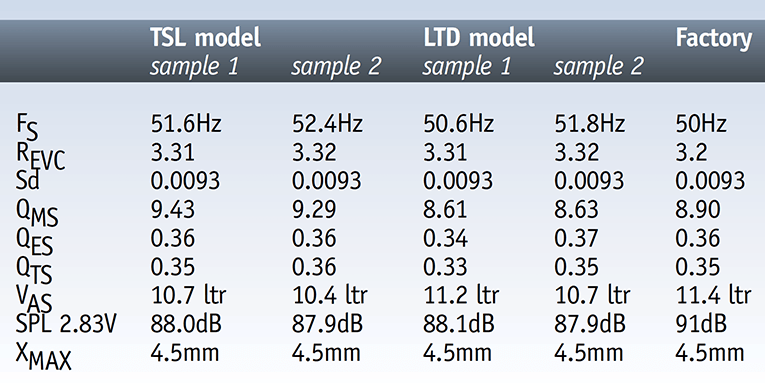
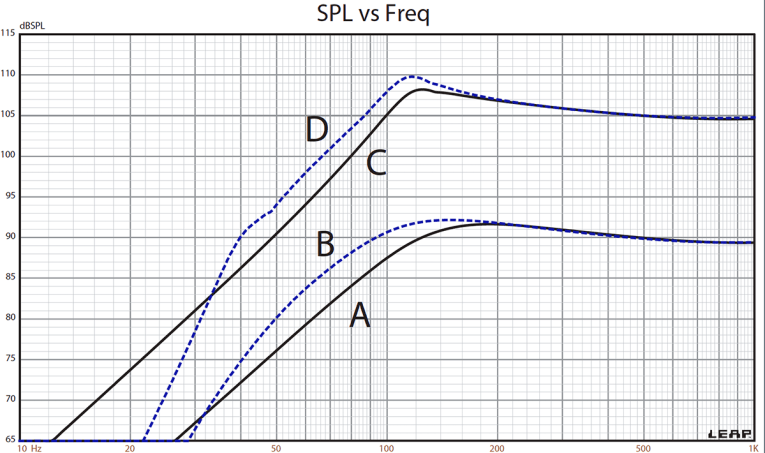
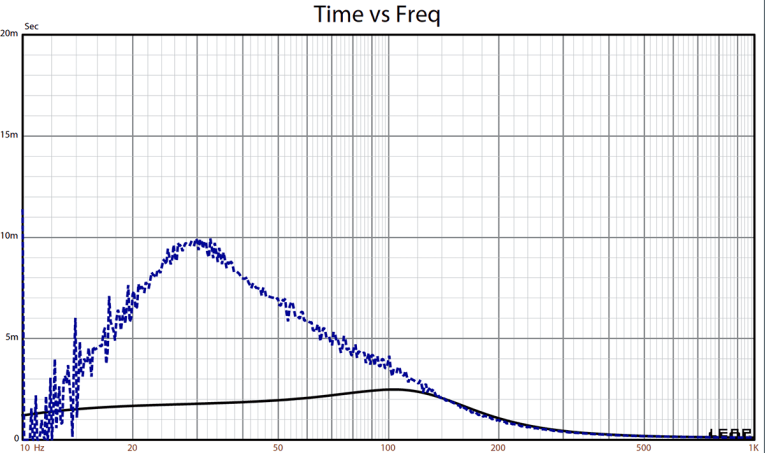
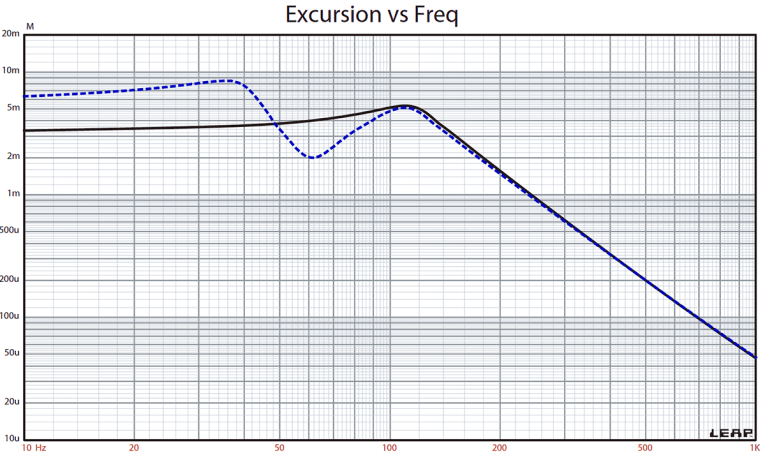
Figure 4 displays the results for the WF152BD03 in the sealed and vented boxes at 2.83V and at a voltage level high enough to increase cone excursion to Xmax + 15% (5.2mm). This produced a F3 frequency of 109Hz with a box/driver Qtc of 0.69 for the 0.085ft3 sealed enclosure and –3dB = 86Hz for the 0.146ft3 vented simulation. Increasing the voltage input to the simulations until the maximum linear cone excursion was reached resulted in 108dB at 20V for the sealed enclosure simulation and 110dB with a 20.5V input level for the larger ported enclosure (see Figs. 5 and 6 for the 2.83V group delay curves and the 20/20.5V excursion curves). Note that excursion begins increasing below 45Hz, so a high-pass filter below this frequency would greatly increase the power handling, which is true of most vented designs.
Klippel analysis for the Wavecor 6″ woofer (our analyzer is provided courtesy of Klippel GmbH), performed by Pat Turnmire, Red Rock Acoustics, produced Figures 9 and 10, which show the Kms(X) and Kms symmetry range curves for the Wavecor midbass woofer. The Kms(X) curve is definitely very symmetrical, and has a very minor rearward (coil-in) offset of less than 0.4mm at the rest position that decreases to 0mm at the 4.5mm Xmax location on the graph, which is trivial. Displacement limiting numbers calculated by the Klippel analyzer for the WF152 showed XBl at 82%, Bl is 3.7mm, and for XC at 75% Cms minimum was 4.2mm, which means that the Bl is the most limiting factor for prescribed distortion level of 10%.
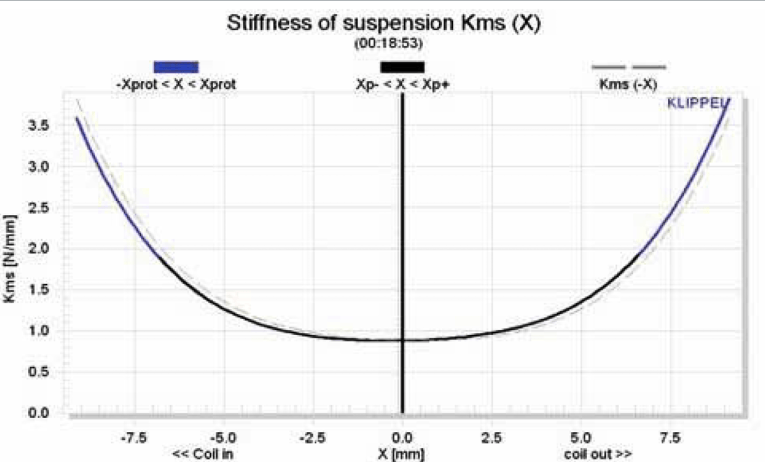
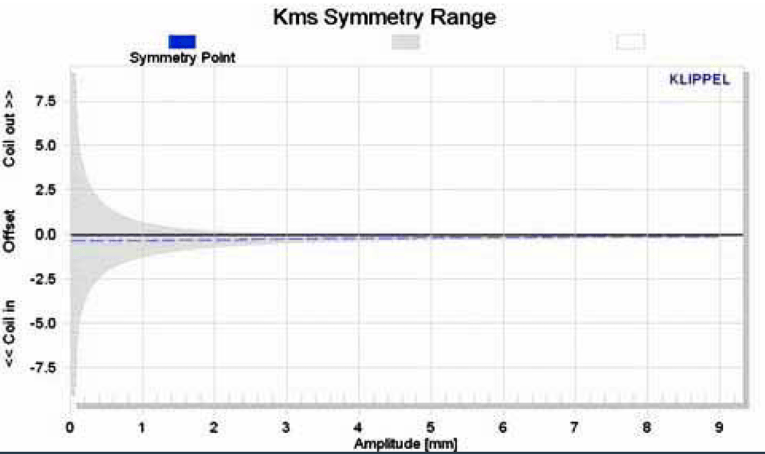
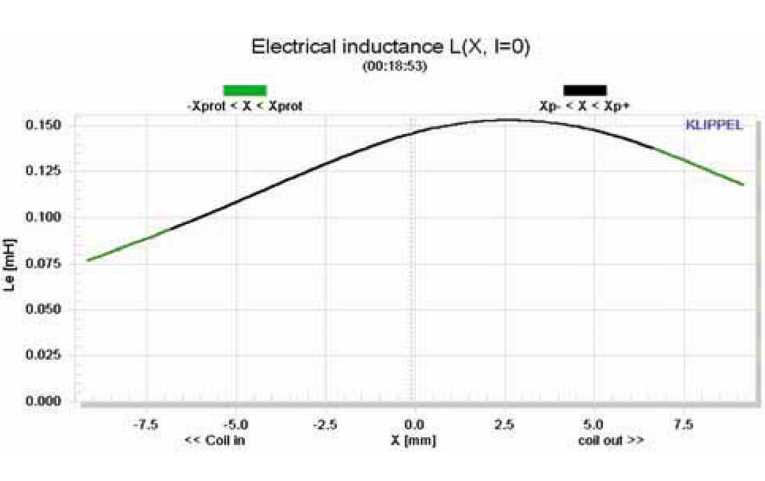
Figure 11 gives the inductance curve Le(X) for the WF152BD03/04. Inductance will typically increase in the rear direction from the zero rest position as the voice coil covers more pole area; however, the WF152 inductance stays mostly constant as the coil moves in due to the dual shorting ring configuration. The inductance variation is only 0.04mH from the in and out Xmax positions, which is very good.
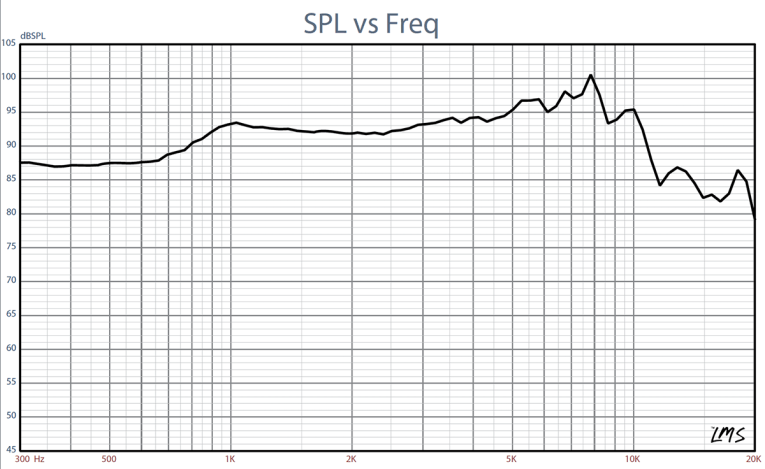
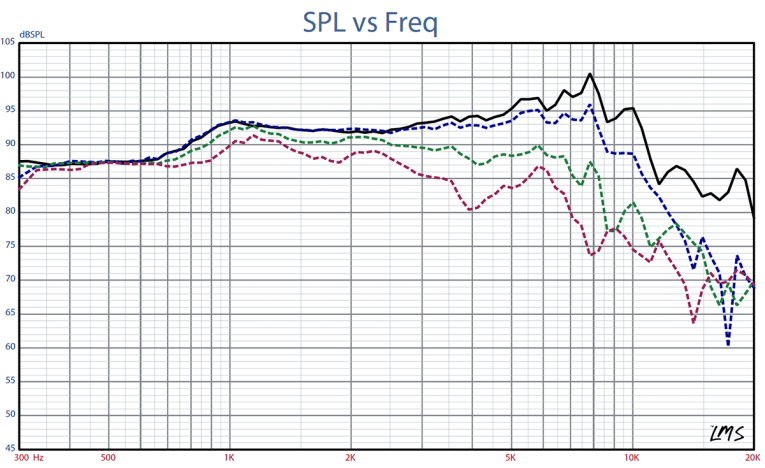
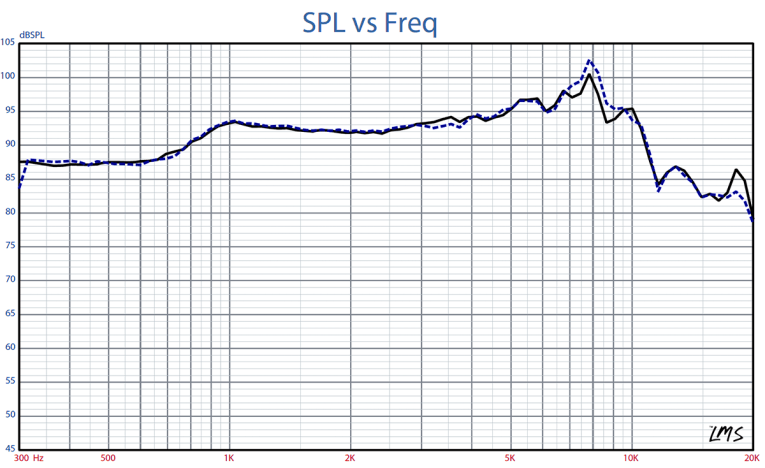
Next, I mounted the WF152 woofer in an enclosure which had a 16″ × 7″ baffle and was filled with damping material (foam) and then measured the DUT on- and off-axis from 300Hz to 40kHz frequency response at 2.83V/1m using the LinearX LMS analyzer set to a 100-point gated sine wave sweep. Figure 12 gives the on-axis response indicating a smoothly rising response to about 8kHz, rising 6dB at 1kHz and some break-up peaking at the highpass rolloff. Figure 13 displays the on- and off-axis frequency response at 0, 15, 30, and 45°. -3dB at 30° off-axis with respect to the on-axis curve occurs at 2.9kHz, so a crossover in the 3kHz region would be appropriate (Wavecor recommends a 3.5kHz upper limit for this driver). And finally, Fig. 14 gives the two-sample SPL comparisons for the 6″ Wavecor driver, showing a close match to within 0.5dB throughout the operating range (excluding a small 1dB differential centered on 3.5kHz).
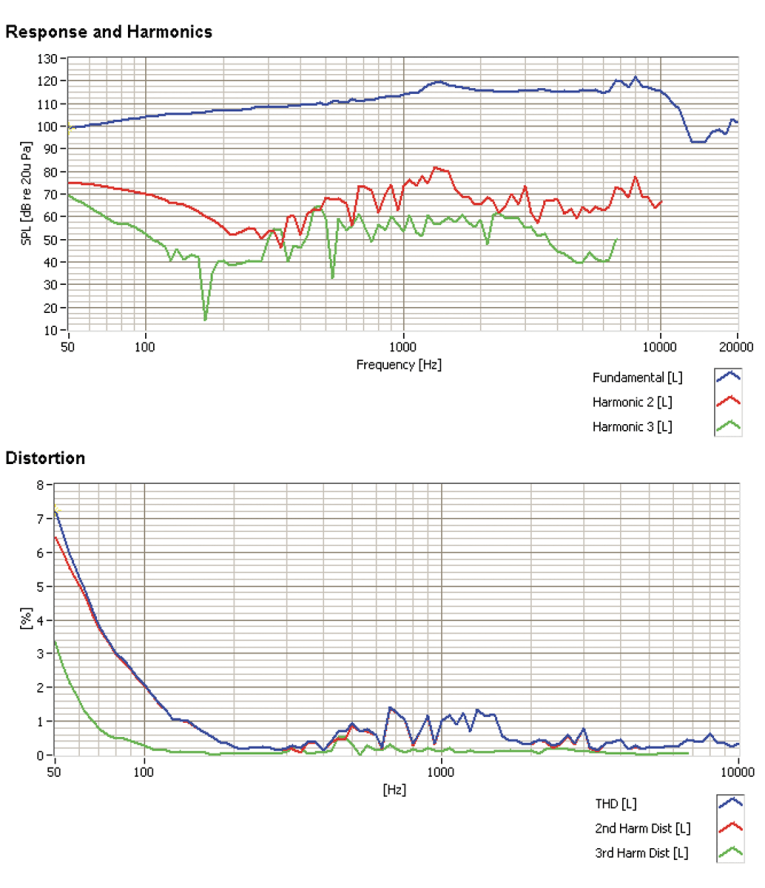
For the remaining battery of tests, I employed the Listen Inc. SoundCheck analyzer and ¼″ SCM microphone and power supply (courtesy of Listen Inc.) to measure distortion and generate time frequency plots. For the distortion measurement, I mounted the Wavecor woofer rigidly in free-air, and set the SPL to 94dB at 1m (3.8V) using a noise stimulus, and then measured the distortion with the Listen Inc. microphone placed 10cm from the dust cap. This produced the distortion curves shown in Fig. 15. I then used SoundCheck to get a 2.83V/1m impulse response for this driver and imported the data into Listen Inc.’s SoundMap Time/Frequency software.
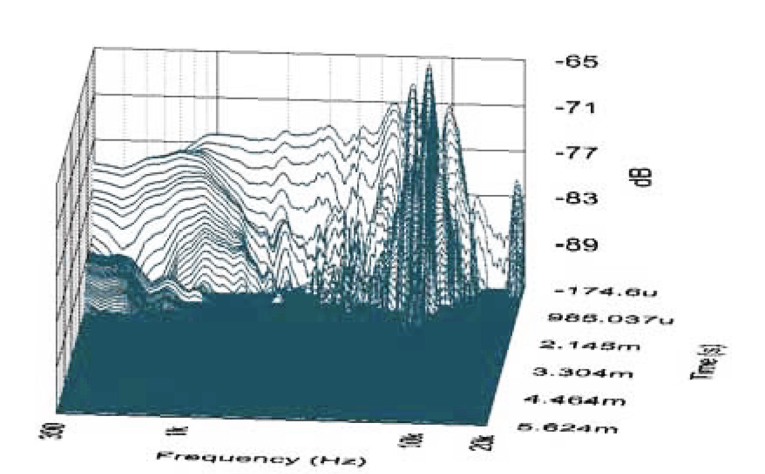
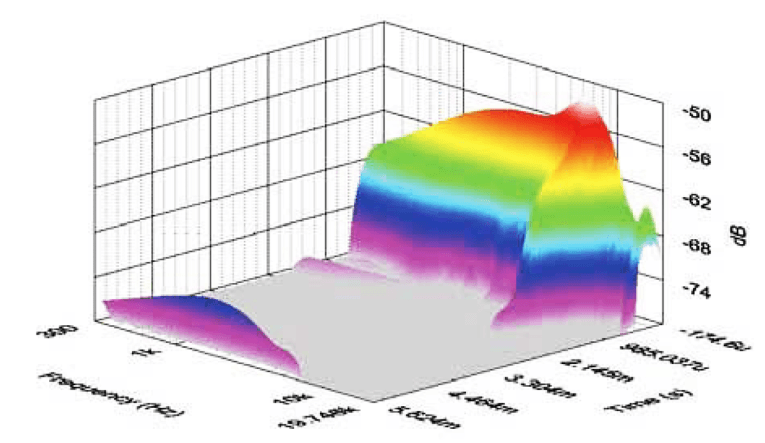
The resulting CSD waterfall plot is given in Fig. 16 and the Wigner-Ville (for its better low-frequency performance) plot in Fig. 17. For more on this well-crafted driver, visit the Wavecor website www.wavecor.com. VC
This article was originally published in Voice Coil, December 2010.