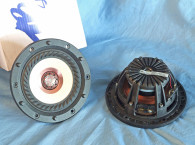
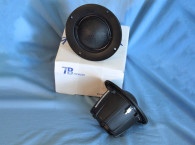
The W4-2356 driver is built on a proprietary and patented injection-molded polymer four-spoke frame. A patented frame? Yes, and this is where the story begins. Looking at Photo 1 of TB Speaker’s W4-2356, the first thing you should notice is that the voice coil is not centered in the 4” injection molded polypropylene cone, but offset by about 0.5”. According to TB Speaker’s brochure on the W4-2356: “This original 4” off-axis design solves the difficult diffraction problems and makes cabinet design easier.”
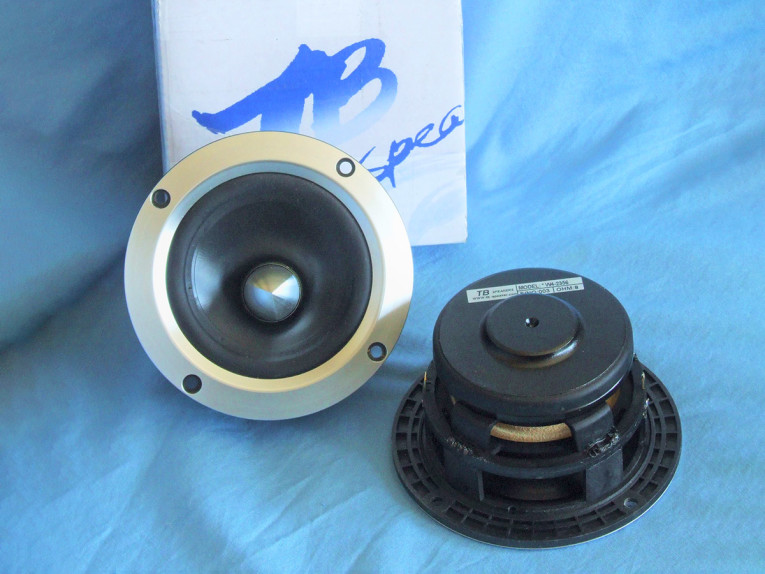
However, even though TB Speaker does not discuss it, I think that what is really going on is that this offset voice coil design is defeating concentric cone modes by virtue of not driving the center of the cone. In other words, TB Speaker has introduced a different methodology that would seem to achieve the same goal: defeating concentric cone modes, a well-known source of coloration in round voice coil transducers, using the patented two-piece frame design shown in Photo 2.
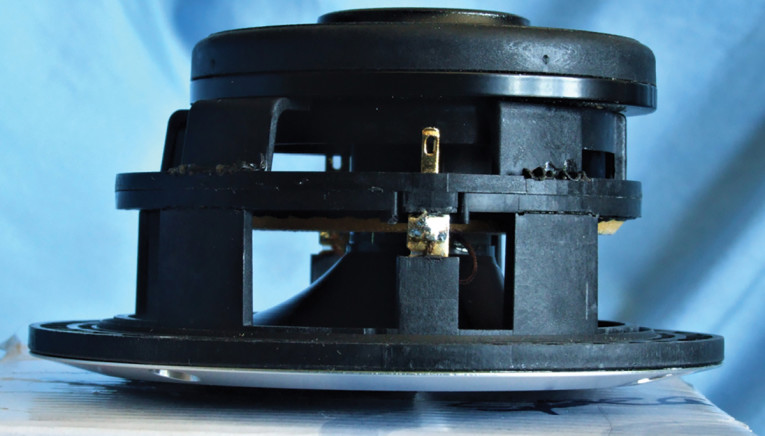
The features for TB Speaker’s W4-2356 include the previously described offset voice coil, an injection-molded poly cone suspended by a Santoprene surround and a cloth spider, a three-sided aluminum phase plug, an underhung neo ring magnet motor structure, a 1” (25.4mm) diameter voice coil, a patented two-piece frame, plus gold-plated terminals located on opposite sides of the frame.
I began testing the TB Speaker W4-2356 full-range using the LinearX LMS analyzer and the Physical Lab IMP Box (provided to Voice Coil courtesy of Physical Lab). Please note that the Physical Lab IMP Box provides current and voltage measurements in exactly the same manner as the LinearX VIBox, however, the LinearX VIBox is no longer available. The IMP Box was used to create both voltage and admittance (current) curves with the driver clamped to a rigid test fixture in free-air at 0.3V, 1V, 3V, and 6V. The 6V curves remained linear enough for LEAP 5 to get a good curve fit, which is impressive for a this small a diameter driver.
As has become the protocol for Test Bench testing, I no longer use a single added mass measurement and instead use actual measured mass, the manufacturers measured Mmd data (4.77 grams). Next, I post-processed the eight 550-point stepped sine wave sweeps for each of the W4-2356 samples and divided the voltage curves by the current curves (admittance) to produce the impedance curves, phase-generated by the LMS calculation method. I imported this data, along with the accompanying voltage curves, to the LEAP 5 Enclosure Shop software.
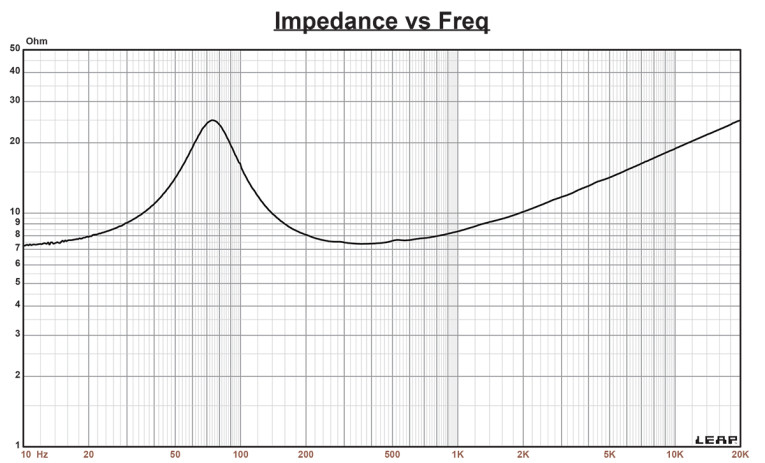
Since most Thiele-Small (T-S) data provided by OEM manufacturers is produced using either a standard driver model or the LEAP 4 TSL model, I additionally created a LEAP 4 TSL model using the 1V free-air curves. I then selected the complete data set, the multiple voltage impedance curves for the LTD model, and the 1V impedance curve for the TSL model in LEAP 5’s transducer derivation menu and created the parameters for the computer box simulations. Figure 1 shows the 1V free-air impedance curve. Table 1 compares the LEAP 5 LTD and TSL data and factory parameters for both of the TB Speaker W4-2356 samples.
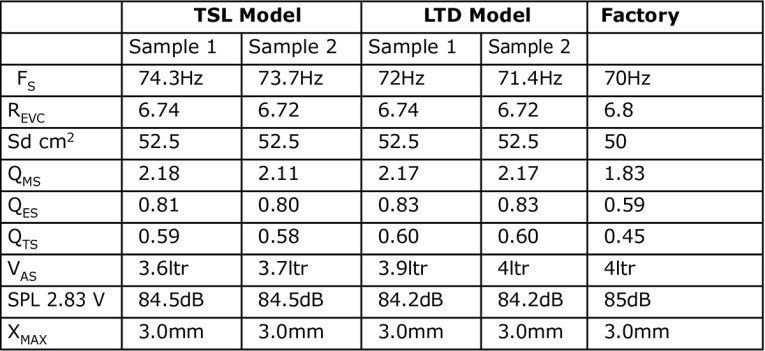
LEAP TSL/LTD parameter calculation results for the W4-2356 was not that close to the factory data, given the difference in the Qes numbers. However, this is preliminary factory data, so much so, that this driver was not yet showing up on the TB Speaker website at the time of publication. Following my usual protocol, I configured computer enclosure simulations using the LEAP LTD parameters for Sample 1. This consisted of a 379in3 Butterworth sealed box with 50% damping material (fiberglass), and a 75in3 Chebychev (Qtc=1.1) sealed enclosure also with 50% damping material in the box.
Figure 2 displays the results for the W4-2356 driver sealed box simulations at 2.83V and at a voltage level sufficiently high enough to increase cone excursion to Xmax + 15% (3.45mm for the W4-2356). This produced a F3 frequency of 87Hz (F6=69Hz) with a Qtc=0.72 for the 379in3 Butterworth sealed enclosure and –3dB=121Hz (F6=102Hz) with a Qtc=1.1 for the 75in3 Chebychev sealed box simulation.
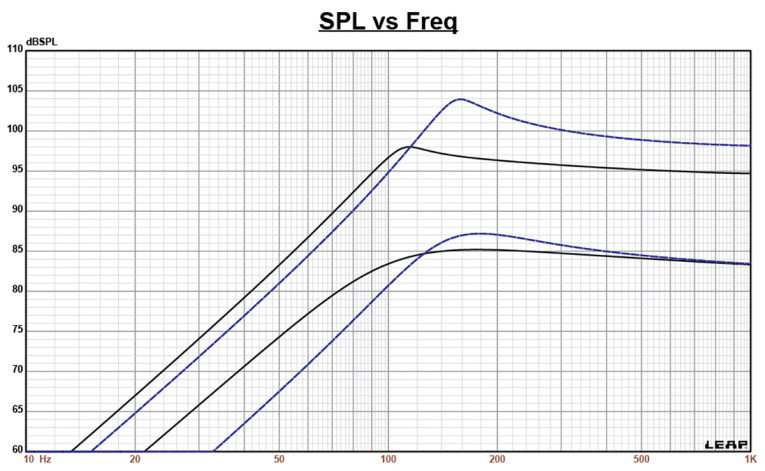
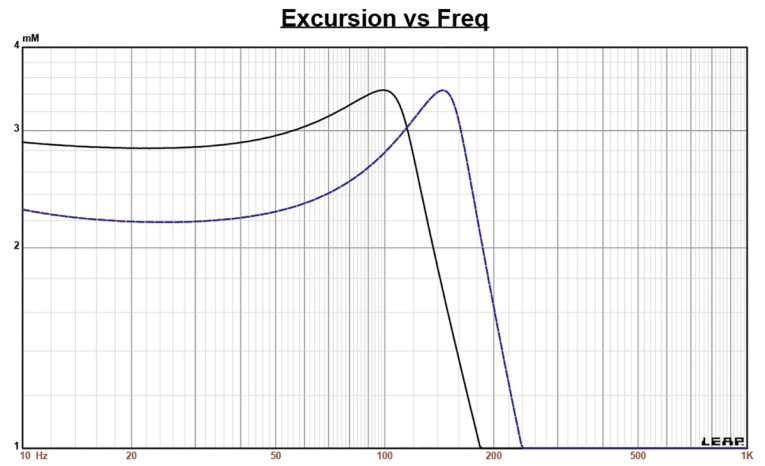
Increasing the voltage input to the simulations until the maximum linear cone excursion was reached resulted in 98dB at 14.5V for the sealed Butterworth enclosure simulation and 104dB at 23V input level for the Chebychev sealed enclosure. Figure 3 shows the 2.83V group delay curves. Figure 4 shows the 14.5/23V excursion curves.

Klippel analysis and testing by Jason Cochrane at Warkwyn for the TB W4-2356 full-range driver produced the Bl(X), Kms(X), and Bl and Kms symmetry range plots given in Figures 5-8. The Bl(X) curve for the W4-2356 (Figure 5) is relatively broad and symmetrical with a fairly minor amount of offset to the curve, which is not bad for a short Xmax 4” diameter driver. Looking at the Bl symmetry plot (Figure 6), this curve reveals a decreasingly small amount of positive coil-out (forward) offset that gets to a trivial 0.19mm at the physical 3.45mm (Xmax + 15%) position.
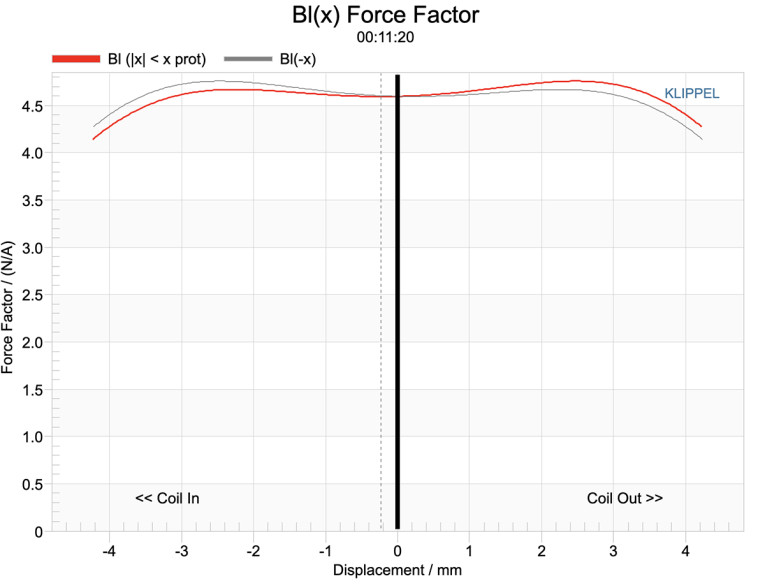
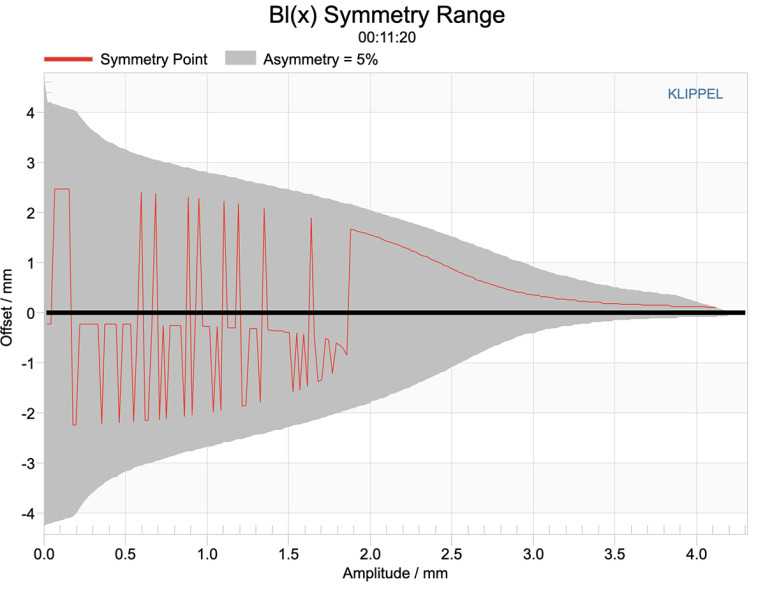
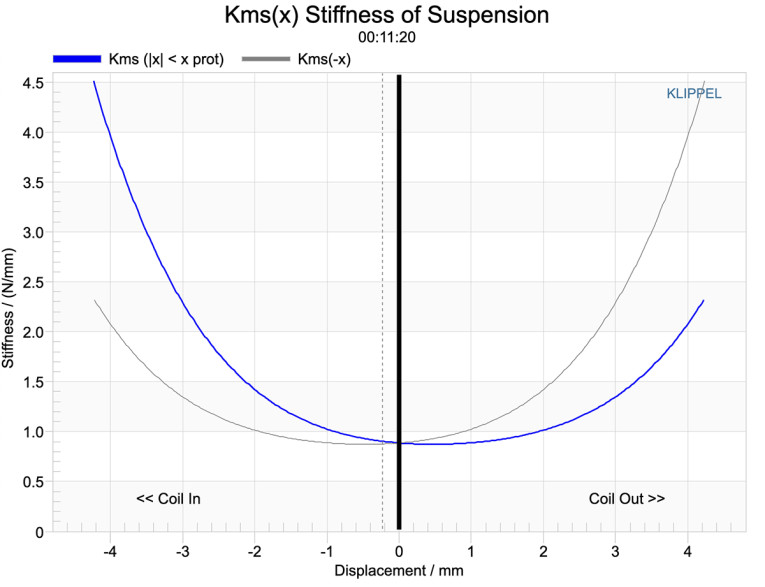
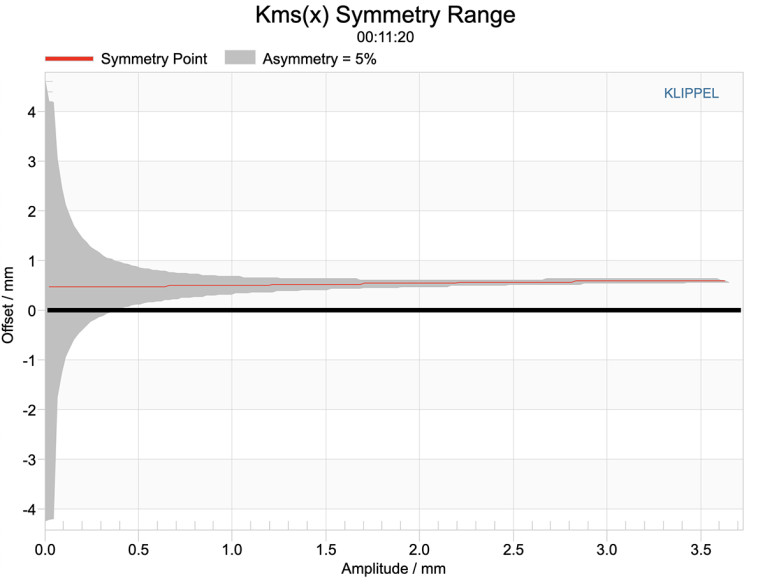
Figure 7 and Figure 8 show the Kms(X) and Kms symmetry range curves for the W4-2356 full-range driver. The Kms(X) curve (Figure 7) is somewhat asymmetrical, with a fairly constant positive offset. Looking at the Kms symmetry range curve (Figure 8), there is about 0.5mm to 0.6mm forward offset from 1mm to the Xmax position, which is reflected in the displacement numbers.
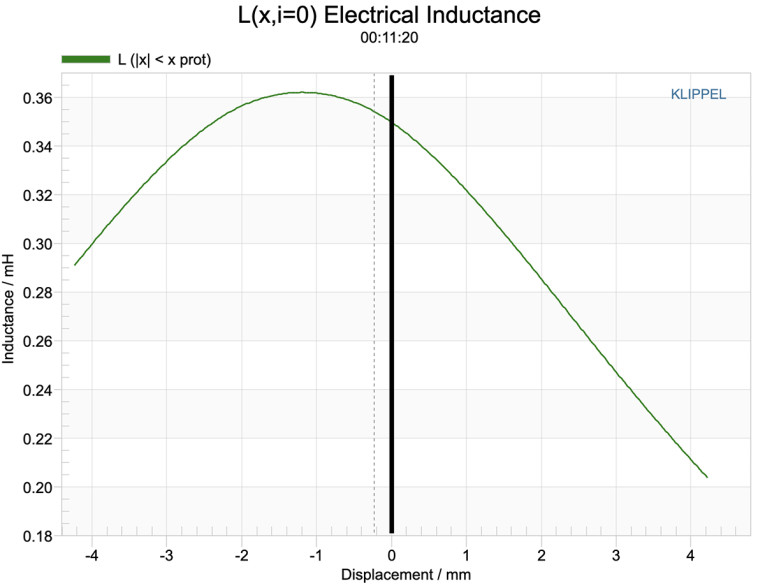
Displacement limiting numbers calculated by the Klippel analyzer for the W4-2356 full-range driver were XBl @ 82% Bl is > 4.24mm and for XC at 75% Cms minimum was 1.51mm, which means that for this woofer, compliance is the most limiting factor for prescribed distortion level of 10%. Figure 9 gives the inductance curve Le(X) for the W4-2356 driver. Inductance will typically increase in the rear direction from the zero rest position as the voice coil covers more pole area, however, this is not what happens with the W4-2356 inductance due to the neo ring magnet and return cup motor configuration. As such, the inductive variance is still small, ranging between 0.36 to 0.25mH, which is only a 0.09mH swing, so not bad.
Next I mounted the W4-2356 driver in an enclosure that had a 9”×4” baffle and was filled with damping material (foam). Then, I measured the transducer on- and off-axis from 300Hz to 40kHz frequency response using the Loudsoft FINE R+D analyzer and the GRAS 46BE microphone (courtesy of Loudsoft and GRAS Sound & Vibration) both on- and off-axis from at 2.0V/0.5m, normalized to 2.83V/1m using the cosine windowed FFT method. All of these SPL measurements also included a 1/6 octave smoothing, which approximate the 100-point frequency response resolution I used with LMS for a number of years.
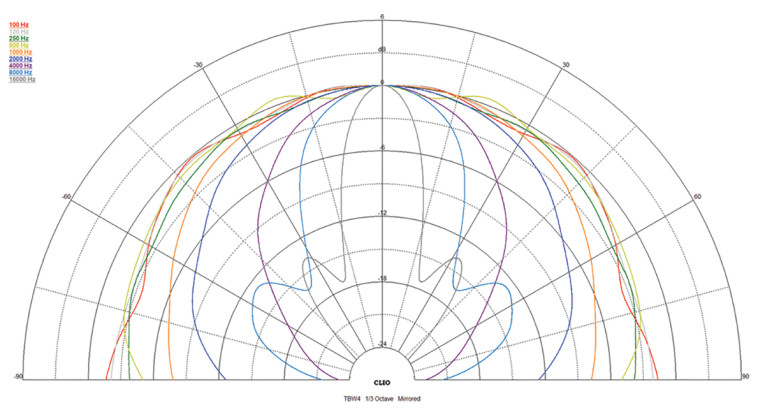
Figure 10 gives the W4-2356’s on-axis frequency response, which is ±2dB from below 200Hz about 7kHz. The response extends out to about 20kHz, with the -5dB depression centered on 8.5kHz. Since the offset voice coil produces an asymmetrical cone positioning, I decided to check and see what kind of directivity issues, if any, that this would cause. Figure 11 displays the on- and off-axis frequency response at 0°, 15°, 30°, and 45° with the driver in a vertical orientation (as shown in Photo 1).
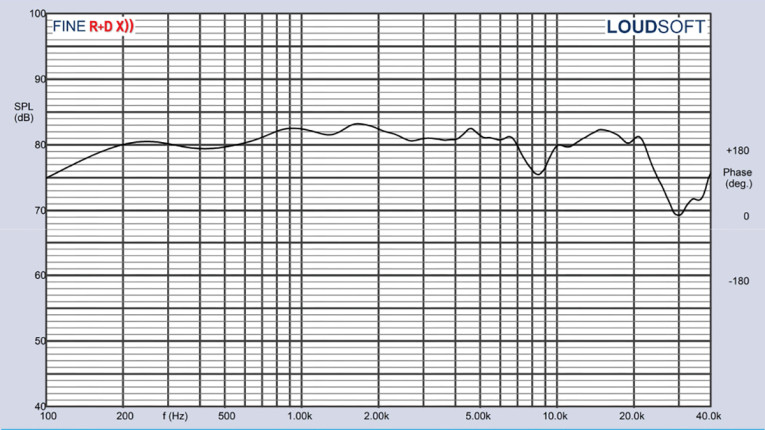
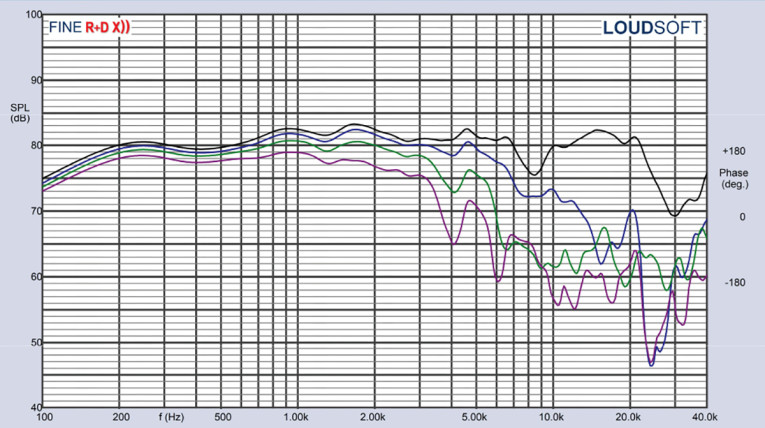
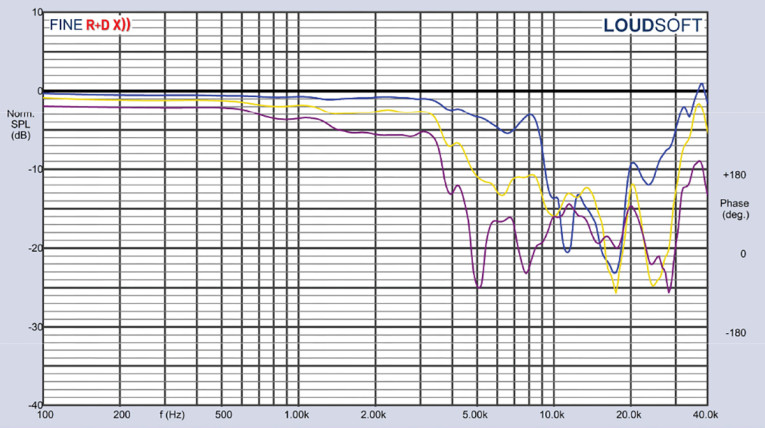
Figure 12 gives the off-axis curves normalized to the on-axis response. Figure 13 shows the CLIO 180° polar plot (measured in 10° increments).

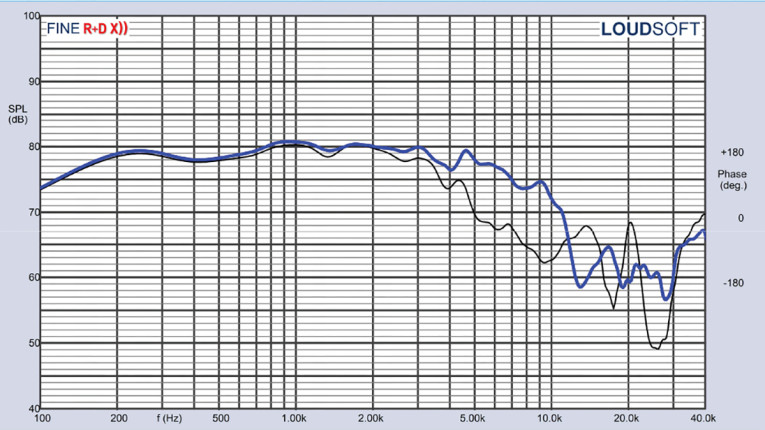
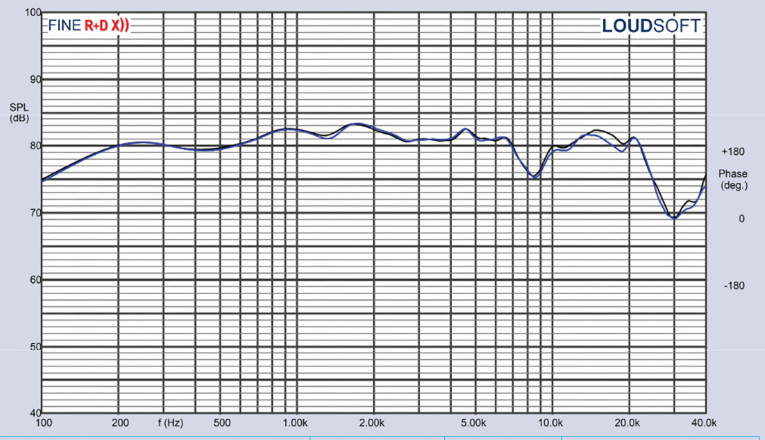
Following this set of SPL measurements, I rotated the cone 90° and again measured the on- and off-axis frequency response at 0°, 15°, 30°, and 45° (Figure 14), with the normalized version shown in Figure 15. These are the measurements with the driver rotated to the left. If you look at the comparison of 30° off-axis left and 30° off-axis to the right (Figure 16), we see an increase in directivity in the rotation right direction above 2kHz. I would conclude that this driver should be placed in the vertical orientation on a baffle for best results and let the direction change be in the vertical plane. This isn’t a huge problem, especially considering the directivity issue of ribbon and Air Motion Transformer (AMT) devices in wide application in the industry. Last, Figure 17 shows the two-sample SPL comparison, indicating the two samples were closely matched within less than 1dB out to 10kHz.

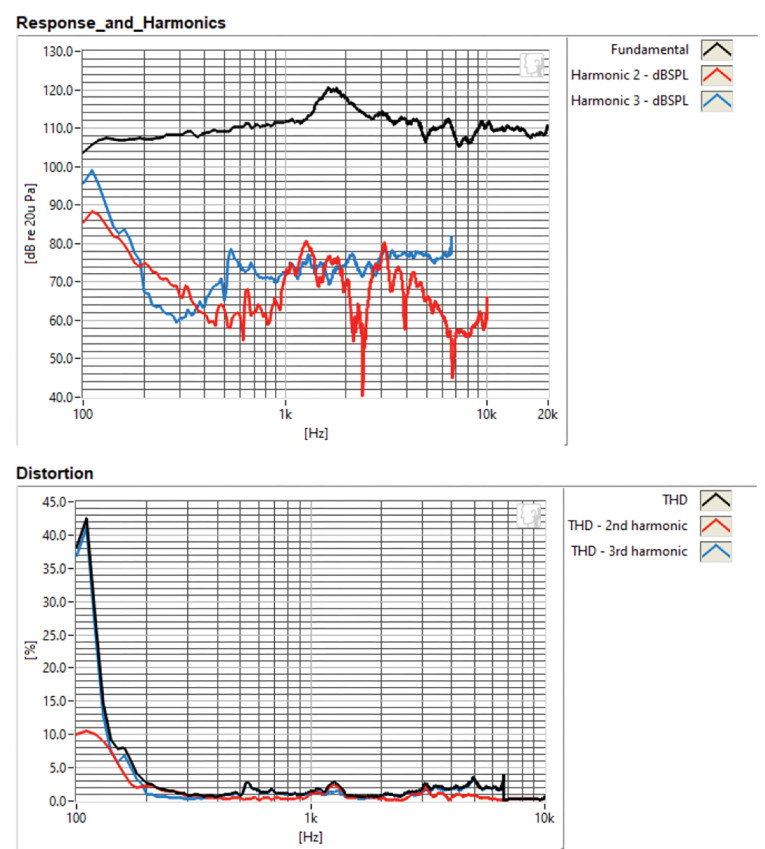
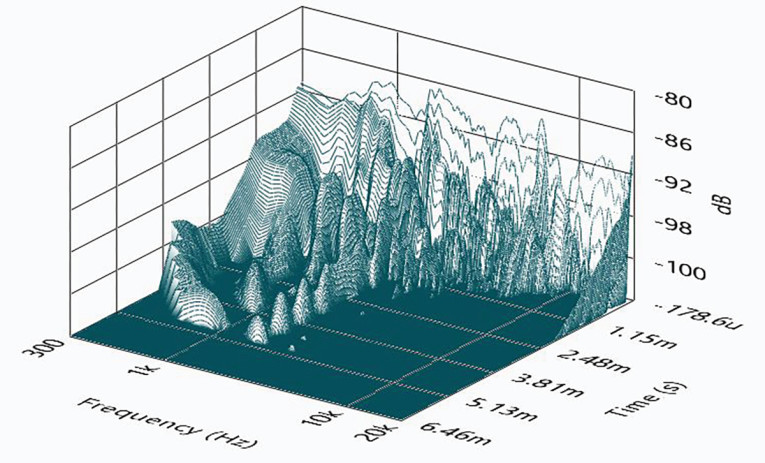
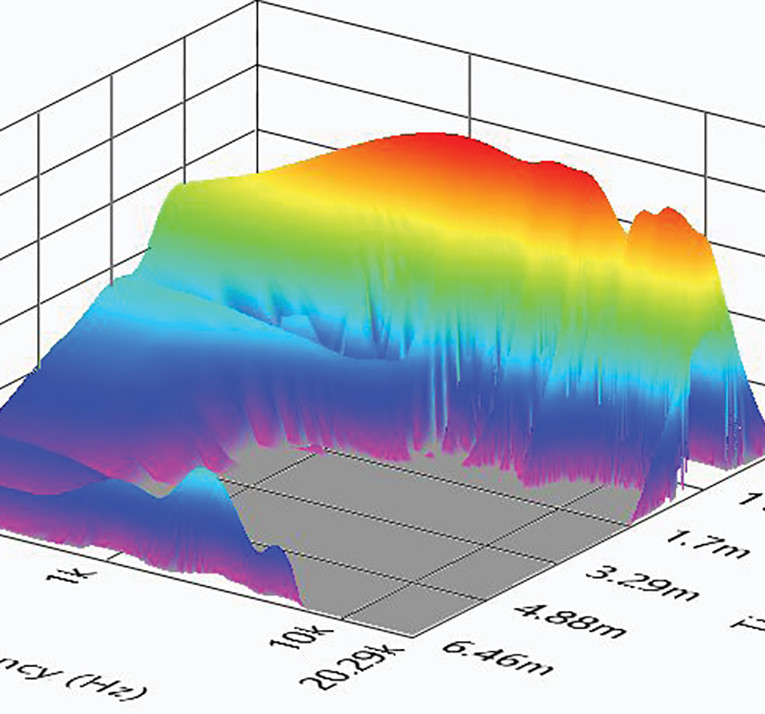
I employed the Listen SoundCheck 20 software, along with the AudioConnect analyzer with the Listen ¼” SCM microphone and power supply to measure distortion and generate time-frequency plots. (The equipment was provided courtesy of Listen, Inc.) For the distortion measurement, I mounted the W4-2356 driver rigidly in free-air, and set the SPL to 90dB at 1m (13.6V) using a pink noise stimulus, and measured it with the microphone placed 10cm from the dust cap. Figure 18 shows the distortion curves. I then used SoundCheck to get a 2.83V/1m impulse response for this driver and imported the data into Listen’s SoundMap Time/Frequency software. Figure 19 shows the resulting CSD waterfall plot. Figure 20 provides the Wigner-Ville plot (chosen for its better low-frequency performance).
Looking over all the data, and considering the cone mode reduction benefits to be had from the offset voice coil configuration, this is an important and interesting new transducer coming from TB Speaker. For more information, visit www.tb-speaker.com. VC
This article was originally published in Voice Coil, September 2022.