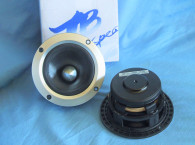
The T1-1942S is an augmented full-range system based on Tang Band’s W1-1942S 1” full-range dome device. Basically, the W1-1942S is a wide santoprene surround 1” polypropylene dome with a cloverleaf elastomeric damping material that overlays the dome (see Photo 1). Other features include a 28-mm voice coil diameter, XMAX = 1.3 mm, 82 dB 1 W/1-m sensitivity, F0 = 120 Hz, QTS = 0.24, and an operating range specified at 120 Hz to 20 kHz. The T1-1942S is the same driver designed into its own 154-mm × 54-mm × 30.1-mm composite enclosure with a built in 44-mm × 18-mm wide surround passive radiator, such that the system range is now specified at 78 Hz to 20 kHz.
Suggested applications include portable audio, soundbars, and multimedia. Both devices have patented technology, although exactly what is patented is not specified in the literature on either product.
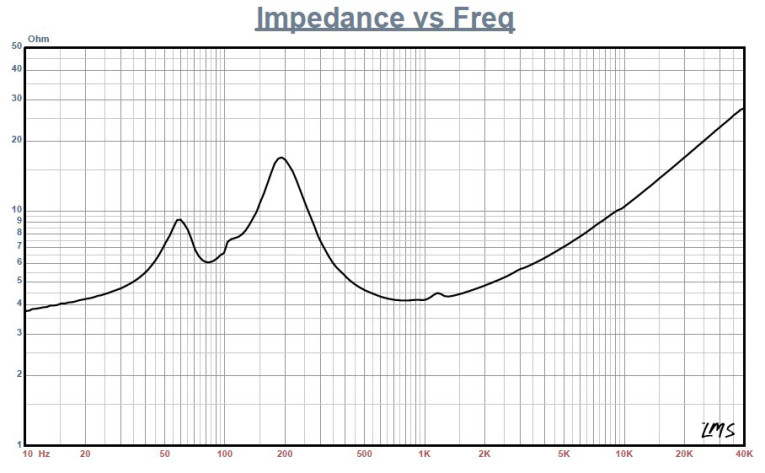

I tested the Tang Band T1-1942S by generating a stepped sine wave impedance plot using the LinearX LMS analyzer. The result of the LMS 300-point impedance sine wave sweep is shown in Figure 1. The 1” full-range passive radiator system exhibits the typical vented-type twin-peak impedance profile that has a 83.8-Hz tuning frequency. Minimum impedance for this device is 4.2 Ω at 795 Hz with a measured RE = 3.7 Ω. The factory TS specification for the W1-1942S motor QMS = 1.79, QES = 0.27, QTS = 0.24, LEVC = 0.046 mH, and the VAS = 0.16 ltr. After completing the impedance measurements, I placed the small enclosure that has a baffle area of about 2” × 8” on the measurement stand and measured the on- and off-axis frequency response at 2.83 V/1 m.
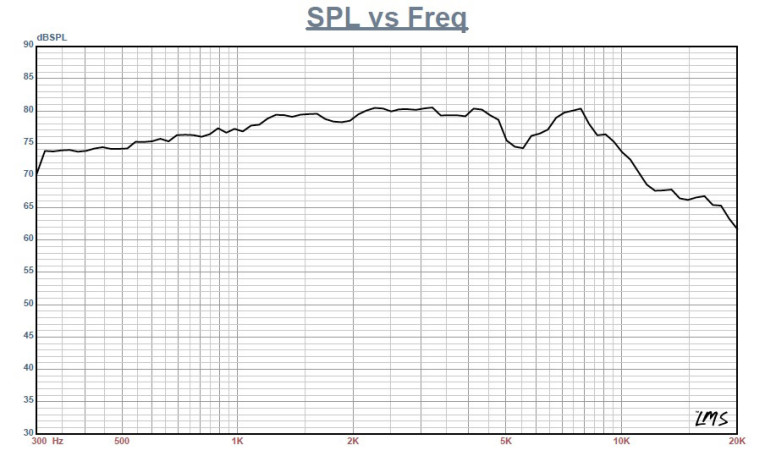
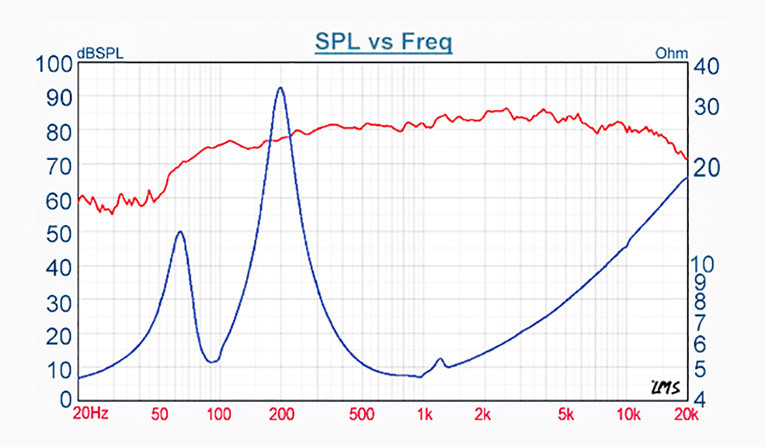
Figure 2 shows the on-axis response. The frequency response for the T1-1942S is smooth, rising out close to 10 kHz. Obviously, this will be very baffle dependent, with a more flat response on a larger baffle, such as the factory response (see Figure 3). Figure 4 provides the T1-1942S module’s on- and off-axis response. Off-axis, the device is substantially better than most 1” domes.

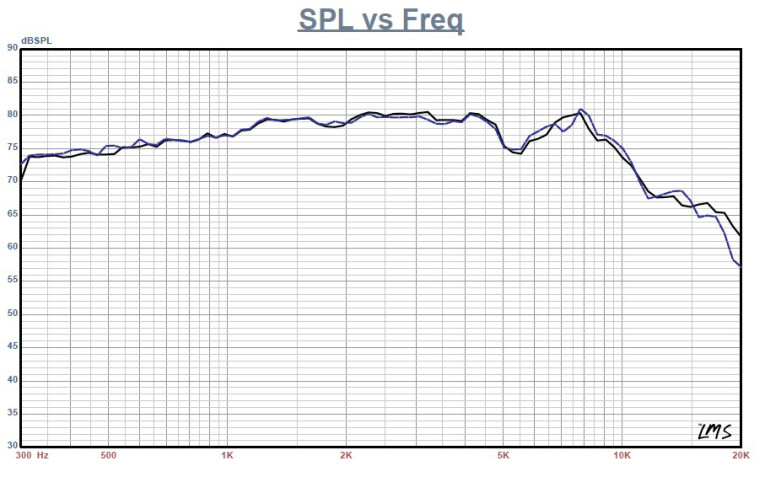

Figure 5 shows the normalized version of Figure 4. In terms of production consistency, the two-sample SPL comparison is depicted in Figure 6, indicating the two samples were well matched with some minor variation in the 6-to-10-kHz region. The last SPL measurement I performed was a near-field measurement with the microphone placed between the dome and passive radiator (see Figure 7). The F3 is about 140 Hz, but if measured far-field with a larger baffle or in- or on-wall, it would likely be closer to the Tang Band factory measurement shown in Figure 3. Tang Band suggests a high-pass filter be used at between 80 to 100 Hz for this device.
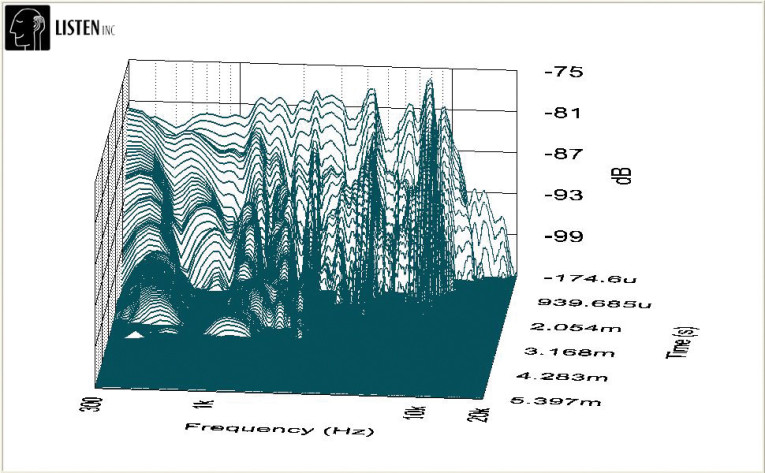
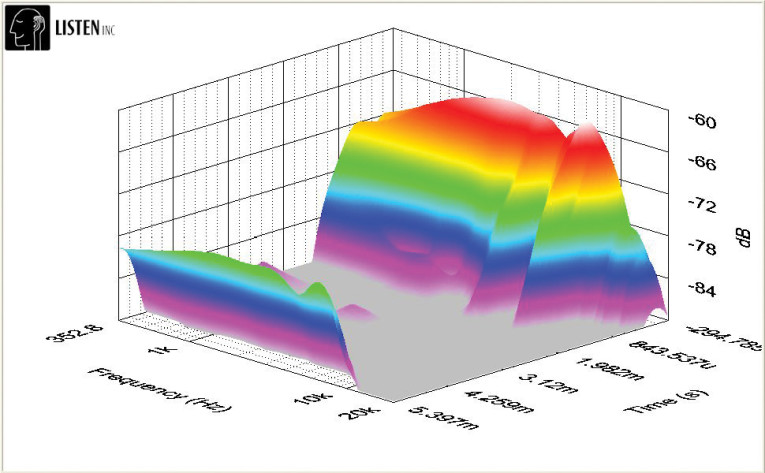
Next, I recess mounted the tweeter and used the Listen SoundCheck analyzer and 0.25” SCM microphone to measure the impulse response. Importing this data into the Listen SoundMap software produced the cumulative spectral decay (CSD) or waterfall plot shown in Figure 8. Figure 9 shows the short-time Fourier transform (STFT) as a surface plot. Last, I used the SoundCheck noise generator and SLM utilities to set the 1-m SPL to 94 dB (3.5 V) and the sweep range to 2 to 20 kHz. I measured the second- and third-harmonic distortion at 10 cm (see Figure 10). This test revealed the relationship between second- and third-harmonic distortion; however, the correlation to subjective preference based on THD is not well established.
For more information on this transducer, visit: www.tb-speaker.com

This article was originally published in Voice Coil, March 2013.