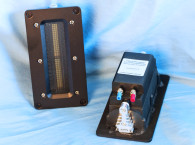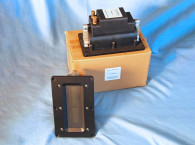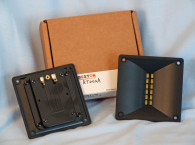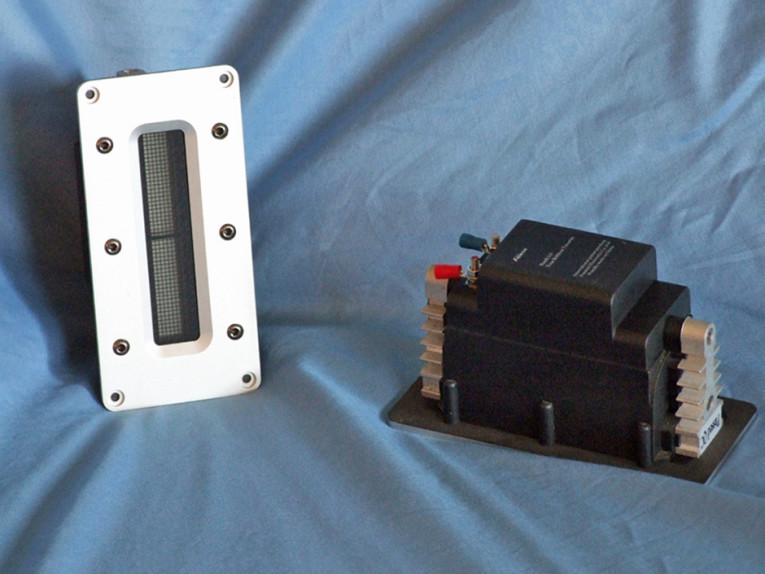
Fountek was founded in April 2003 with a mission statement to supply strictly high-end two-channel products. The company released its first ribbon transducer, the JP3.0, in June 2003, followed by its JP2.0 ribbon transducer in October 2003, and its NeoPro5i released in October 2004. Fountek sent its new third-generation ribbon tweeter, the NeoX 3.0 (see Photo 1). The NeoX 3.0 utilizes an 80 mm × 12 mm × 0.15 mm thick reinforced sandwich (960 mm2 radiating area). The NeoX 3.0 uses a closed-back injection-molded rear cavity with two aluminum heatsinks and a built-in transformer. Other features for this design include the neodymium motor system, a cosmetically attractive 144 mm × 69.5 mm brushed aluminum faceplate, a black mesh screen protecting the diaphragm, and a pair of bolt-on type terminals.


First, I performed a 300-point impedance curve (see Figure 1). The primary resonance occurs at 331.5 Hz with a secondary resonance 1.26 kHz. The NeoX 3.0’s measured direct current resistance (DCR) is 0.16 Ω, which is typical of this kind of transformer coupled ribbon device.
The TB Speaker RT-2202S, reviewed in the April 2016 issue of Voice Coil, was also a transformer coupled ribbon and exhibited similar behavior. It is not an issue once a crossover is applied. However, you need to be aware of it when you are characterizing this type of transducer and limit your analyzer’s frequency range to, in this case, about 70 Hz. The minimum impedance above the primary resonance was a normal 7.33 Ω at 2.35 kHz.
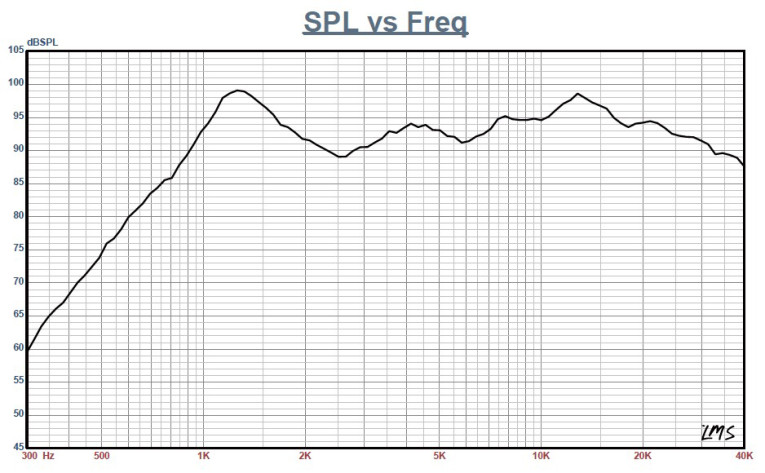
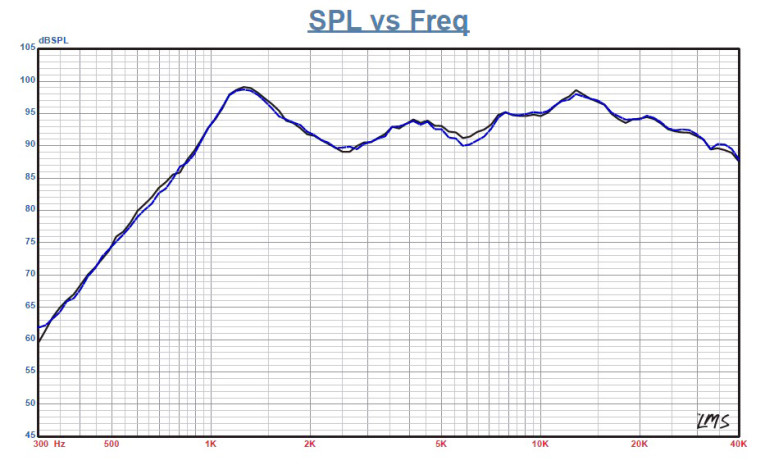
Next, I mounted the Fountek NeoX 3.0 in an enclosure with a 12”× 6” baffle area and measured the on- and off-axis sound pressure level (SPL) with sweeps at 0°, 15°, 30°, and 45° using gated 100-point 2.83 V/1 m sine wave sweeps from 300 Hz to 40 kHz. I took data in both the horizontal and vertical planes. Figure 2 shows the NeoX 3.0’s on-axis response. The NeoX 3.0’s frequency response ±4.8 dB from 2 kHz to 32.8 kHz, with effective output out to 40 kHz. There is peaking in the response centered on about 12.8 kHz, so some equalization would be useful.
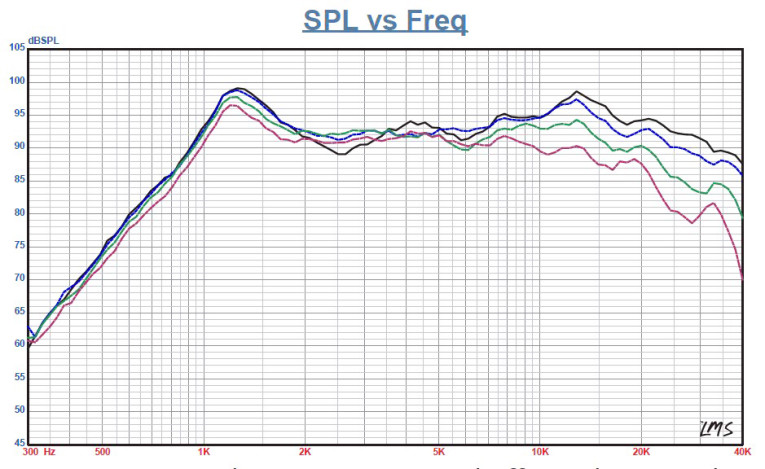
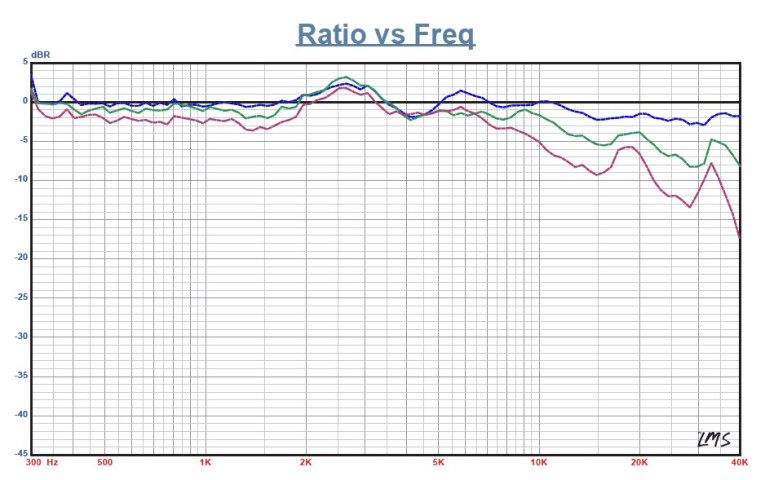
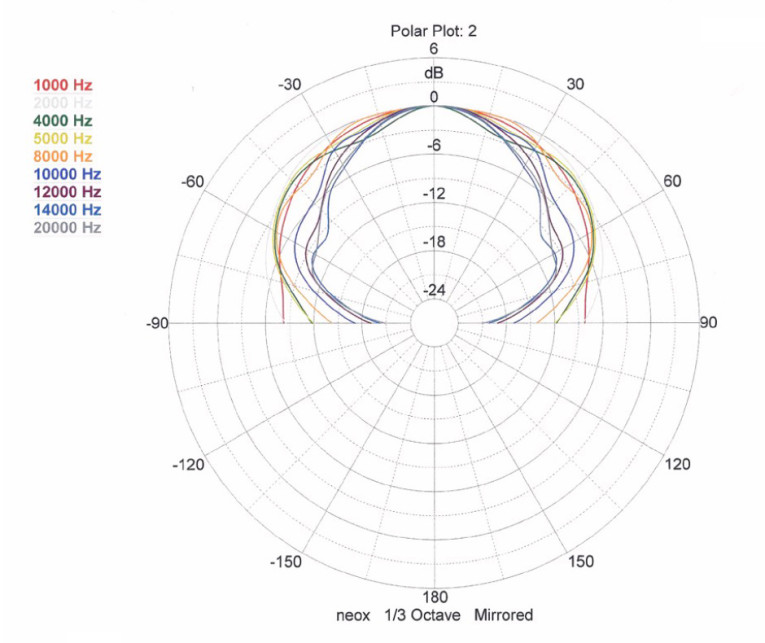
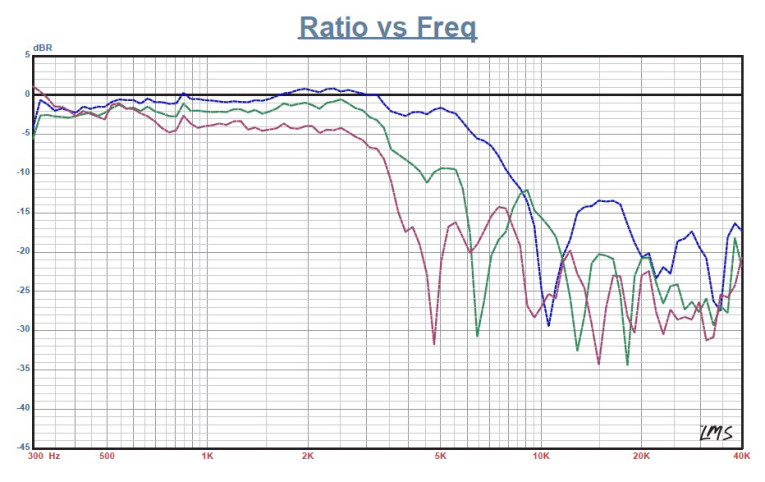
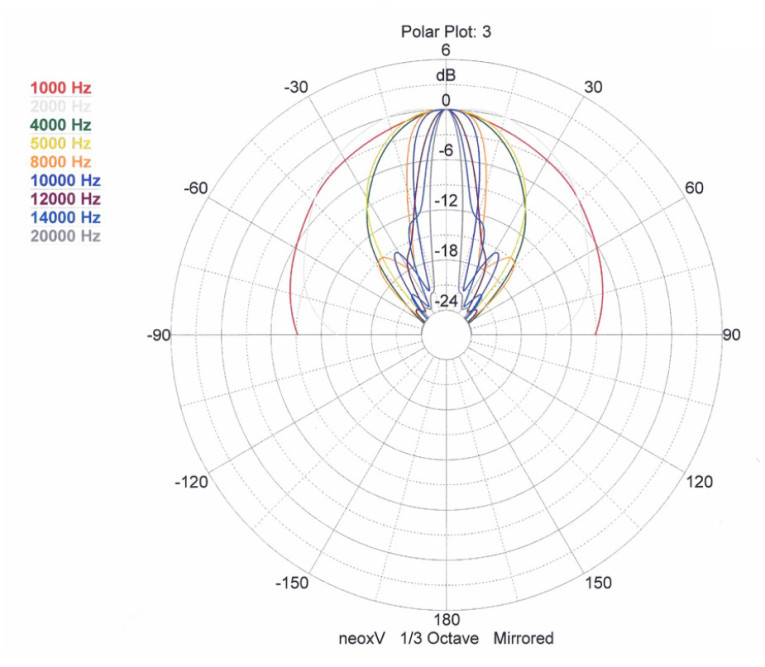
Figure 3 depicts the on- and off-axis frequency response in the horizontal plane, which is somewhat like the typical directivity of a 1” dome tweeter. Figure 4 shows the normalized 0° to 45° frequency response. Figure 5 shows the CLIO Pocket generated horizontal polar plot (1/3 octave smoothing applied). Because the aspect ratio of the NeoX 3.0’s aperture is like most ribbons, there is substantial directivity in the vertical plane, as seen in the on- and off-axis 0° to 45° curves depicted in Figure 6, normalized in Figure 7, and the vertical polar plot shown in Figure 8. The two-sample SPL comparison is given in Figure 9, indicating that both NeoX 3.0 samples were closely matched within the relevant operating range, with about a 0.25-to-1-dB variation in a narrow range between 5 to 7 kHz.
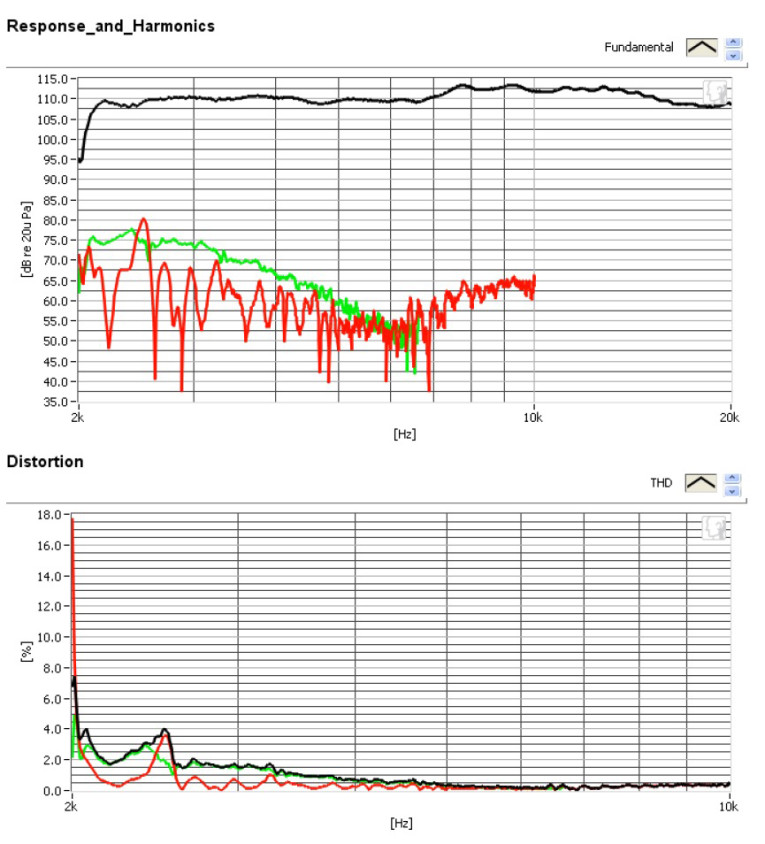
Next, I fired up the Listen, Inc. SoundCheck analyzer (SoundCheck 14.1 software) with the SCM microphone and the SoundConnect preamp/power supply (provided courtesy of Listen, Inc.). I used the built-in pink noise generator and SLM utilities with the SPL set to 94 dB/1 m (2.59 V). Then, I relocated the 0.25” SCM microphone to 10 cm from the NeoX 3.0’s faceplate and ran the distortion curves shown in Figure 10 (with a log scale X-axis). Note that the stimulus was limited to 2 kHz as its lowest frequency.
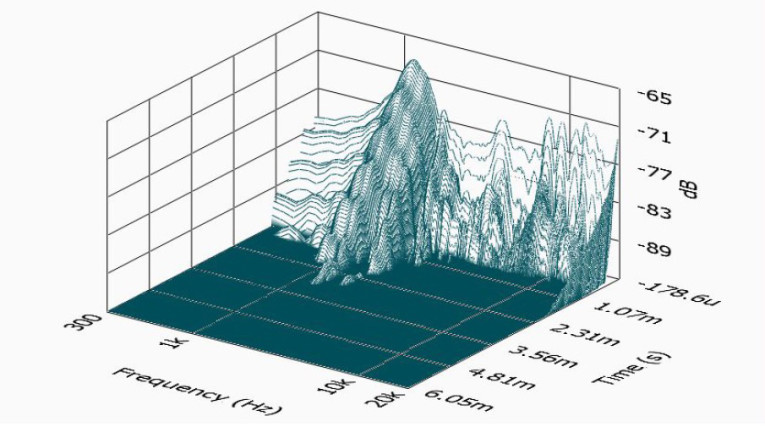
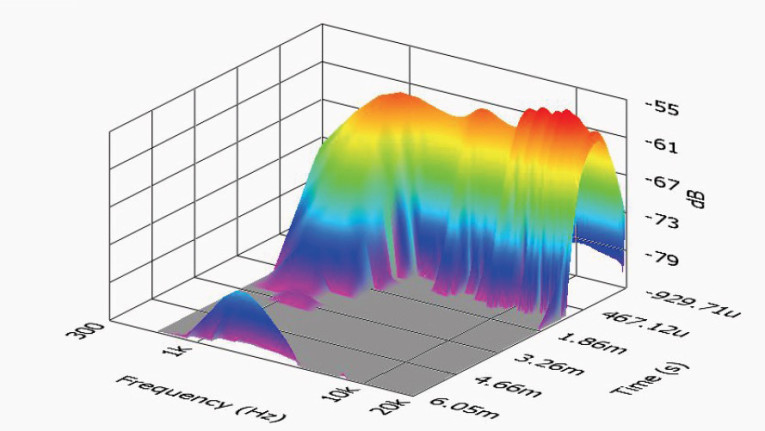
For the last two measurements, I performed an impulse measurement, imported the data into the Listen SoundMap software, windowed out the room reflections, and created the cumulative spectral decay plot (CSD) shown in Figure 11 and the short-term Fourier transform (STFT) shown in Figure 12. For
more information, visit www.fountek.net
This article was originally published in Voice Coil, July 2016.