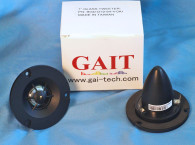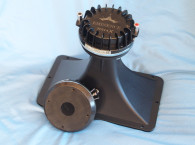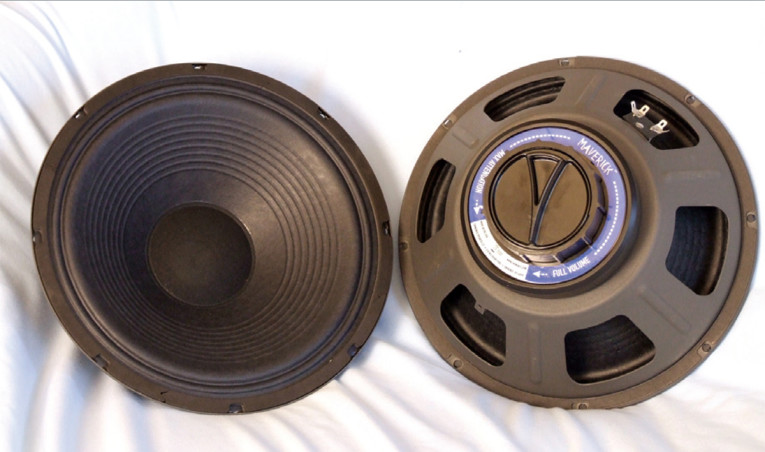
That said, the new Eminence FDM technology is essentially a tricked-out guitar speaker that accomplishes the same task, turning down the volume of the speaker when the amp is turned up loud. If you look at Photos 1 and 2, you see that the speaker has a knob located behind the back plate that is labeled FULL VOLUME turned full right, and MAX ATTENUATION turned full left.
As you can guess, this very clever invention somehow controls the Bl of the speaker, and even though I know exactly how it is doing this, and because this invention is still patent pending, I’m going to leave it to you readers to figure it out on your own.


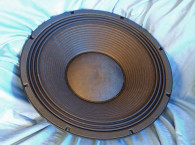
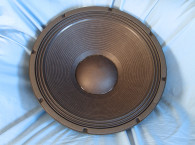
Disregarding the FDM control knob, the Eminence Maverick is a typical guitar speaker constructed on a stamped frame. The cone assembly consists of an uncoated and ribbed paper cone with an integrated M-shaped paper surround, and a 3.5″ diameter Zurette porous cloth dust cap. Remaining compliance is provided by an elevated cloth spider. The cone assembly is driven by a 1.75″ voice coil using round copper wire wound on a non-conducting polyimide former. Powering all this is a 38 oz. 130mm × 19mm ferrite magnet, sandwiched between the black coated plates.
Setting up for the initial test protocol, I clamped the driver to a rigid test fixture in free-air, and then generated both voltage and admittance (current) curves at 1V, 3V, 6V, 10V, and 15V. I processed all ten 10Hz-20kHz 550-point stepped sine wave curve pairs for each driver and divided the voltage curves by the current curves to produce the six impedance curves. The impedance curves each had the LMS phase calculation procedure applied and, along with the voltage curve for each sweep, imported to the LEAP 5 Enclosure Shop CAD program.
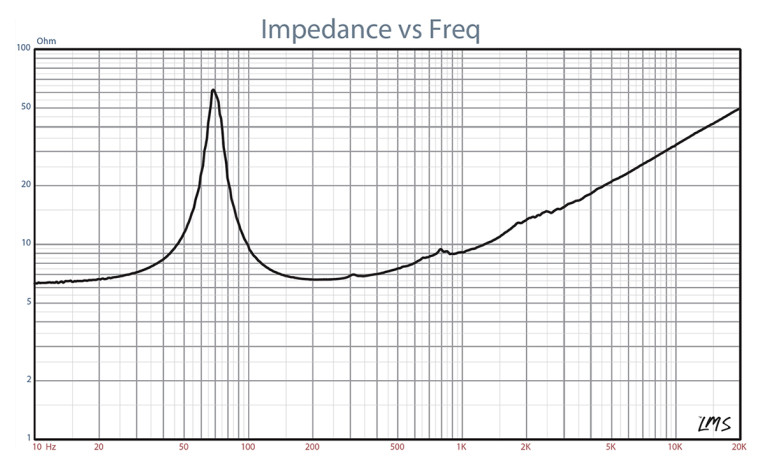
Because most T/S data produced by OEM manufacturers employs either a standard T/S model or the LEAP 4 TSL model, I additionally produced a LEAP 4 TSL model using the 1V free-air curves. I selected the complete curve set, the multiple voltage impedance curves for the LTD model (see Fig. 1 for the 1V free-air impedance curve) and the 1V impedance curves for the TSL model in the transducer derivation menu in LEAP 5, and produced the parameters (using the fixed Mmd method) for the computer box simulations. Table 1 compares the LEAP 5 LTD and TSL data and factory parameters for both Maverick samples set at full volume on the FDM control. I also performed TSL parameter measurements with the control set at 50% full volume and at maximum attenuation. All three TSL parameter sets — full volume, 50% volume, and maximum attenuation — are compared in Table 2.

Thiele/Small parameter results for the Eminence 12″ woofer were close to the factory data, with some variance in between my two samples, but the FS/Qt ratios are close. Please note that the SPL difference is due to two different calculation methods. The LEAP 5 SPL data is a calculated number that is intended to represent mid band sensitivity. Eminence sensitivities are expressed as the average output across the usable frequency range when applying 1W/1m into the nominal impedance, (2.83V 8Ω, 4V/16Ω, and so on), which is perhaps a more accurate presentation of overall sensitivity of a driver than the calculated sensitivity method. Either way, it is less of an issue with a guitar speaker than essentially a full-range speaker that does not use a crossover.
In Table 2, which compares the TSL parameter calculations with the FDM knob set at full volume, 50% volume, and maximum attenuation, both SPL and Bl decrease as the knob is advanced to maximum attenuation, while the Qts increases. The substantial amount of attenuation is the key to what makes this unconventional technique do exactly what a guitar player is looking for, a way to decrease volume of the woofer when a tube amplifier is turned up.
I next proceeded to program computer enclosure simulations using the LEAP LTD parameters for Sample 1 using a different technique that I normally apply in this circumstance. Because many guitar speakers are used in open back cabinets, I decided to use a typical cabinet size and simulate the speaker in full-space with a flat baffle equal to the area of the front baffle of the guitar amplifier baffle plus the distance to the open back part of the enclosure. For this example, I used the measurements from a Fender Deluxe reverb, a single 12″ speaker guitar amp. This yielded a total baffle area of 34″ × 27″, which is what I used for the first simulation (LEAP 5 will simulate almost any possible baffle and box configuration).
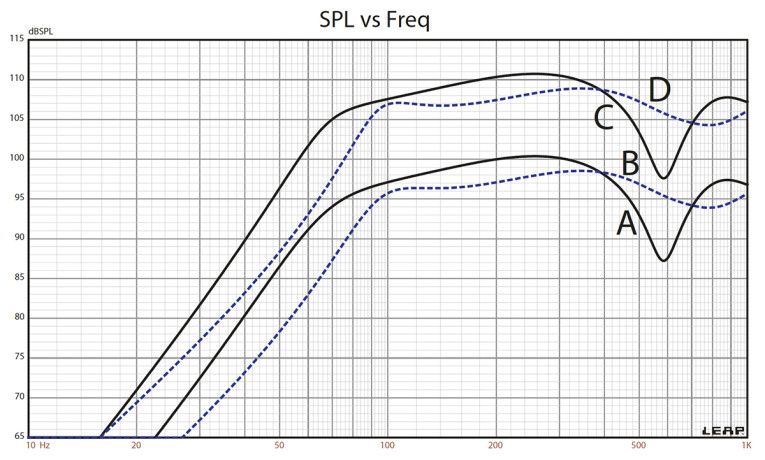
For the second simulation I assumed this same guitar amp to have a closed back. This volume was roughly equal to half of a dual 12″ closed back Fender BandMaster cabinet, or about a 2ft3 closed box with 25% fiberglass fill material. Figure 2 depicts the results for the Maverick in the 34″ × 27″ flat baffle and the 2ft3 sealed box at both 2.83V and an arbitrary 10V, mostly since this is an equal hung (coil length is the about the same as the gap) configuration. This calculation resulted in an F3 frequency of 68Hz for the open back simulation and a –3dB = 86Hz for the 2ft3 sealed closed back enclosure. Looking at excursion curves for a driver which is considered at its best when it is distorting substantially is probably not particularly relevant. For this reason, I arbitrarily set the voltage to 10V and show the resulting SPL, which was 107dB for the open back simulation and likewise 107dB for the closed back simulation (see Fig. 3 2.83V group delay curves).
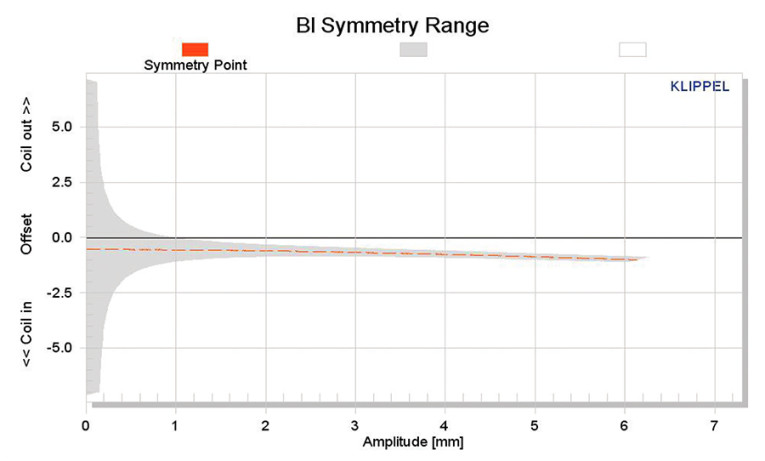
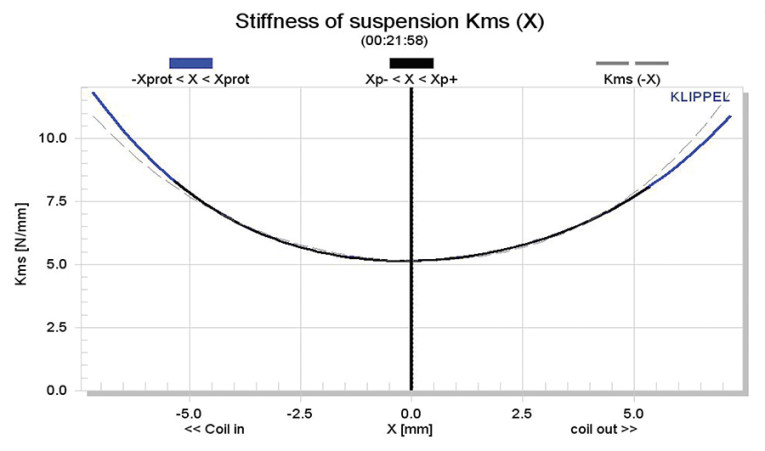
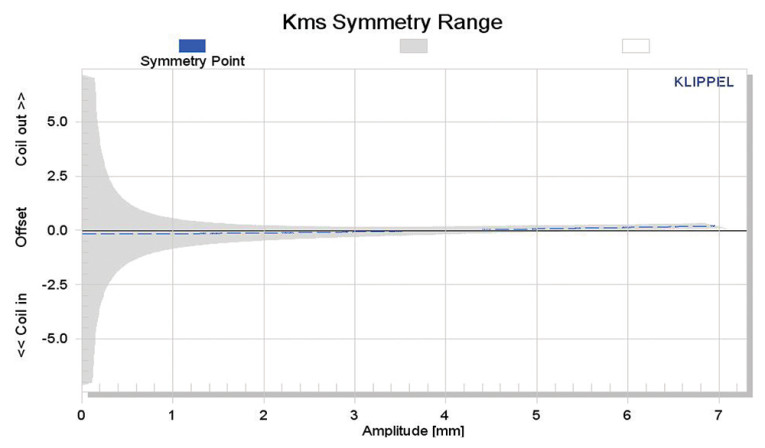
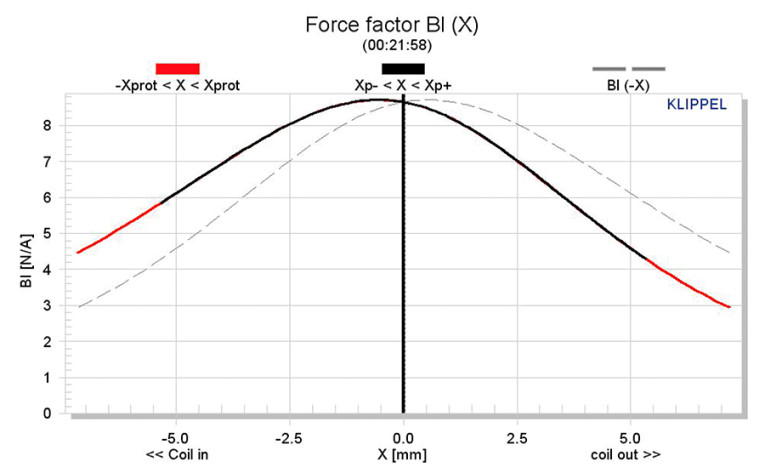
Klippel analysis for the Maverick produced the Bl(X), Kms(X), and Bl and Kms symmetry range plots given in Figs. 4-7. The Bl(X) curve (Fig. 4) is fairly narrow, as you would expect for a very short Xmax driver, but is also moderately symmetrical with a small amount of coil-in offset. Looking at the Bl symmetry plot (Fig. 5), the rearward coil-in offset is only 0.54mm. Figures 6 and 7 give the Kms(X) and Kms symmetry range curves.
The Kms(X) curve is very symmetrical with also an extremely very small amount of coil-out offset. Looking at the Kms symmetry range curve, there is only 0.15mm offset at rest out to 4mm. Displacement limiting numbers calculated by the Klippel analyzer for the Maverick guitar speaker showed XBl at 82% Bl = 2.4mm, and for XC at 75% Cms minimum was 4.1mm, which means that the Bl is the most limiting factor at the prescribed distortion level of 10%.
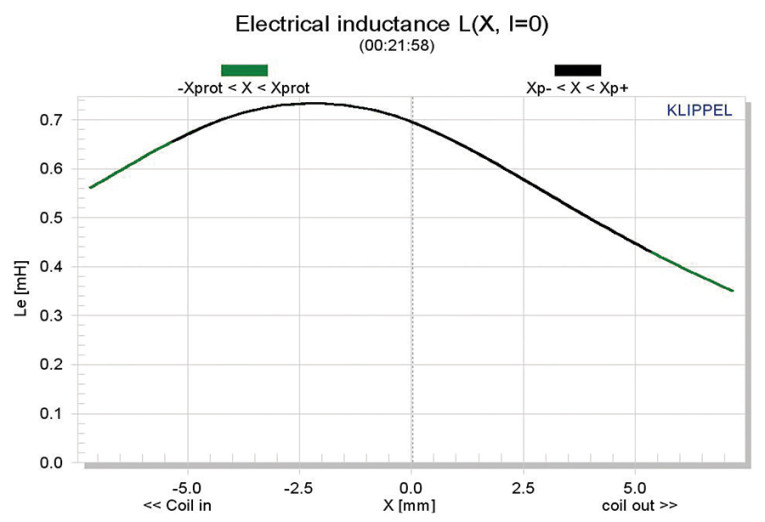

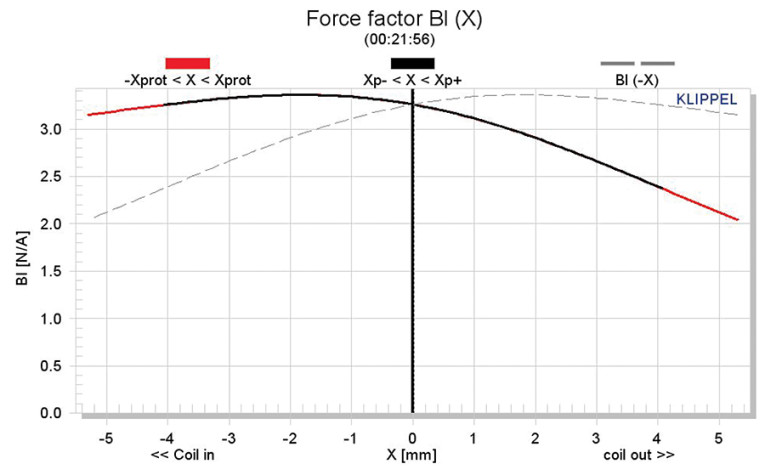
Figure 8 gives the inductance curves Le(X). Inductance will typically increase in the rear direction from the zero rest position as the voice coil covers more pole area, which is what you see with the Maverick. Patrick also performed Klippel measurements with the FDM knob set at 50% and at maximum attenuation. Figures 9 and 10 show the Bl(X) curves for 50% volume and maximum attenuation, respectively. You can see both the magnitude and shape of the Bl curve change as the “volume” is turned down.
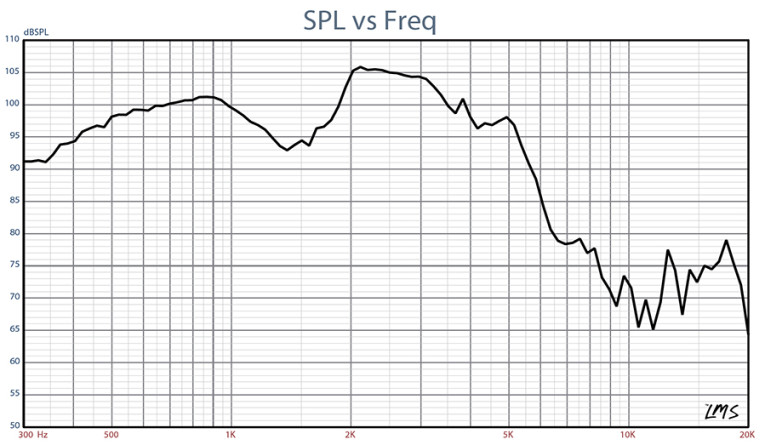
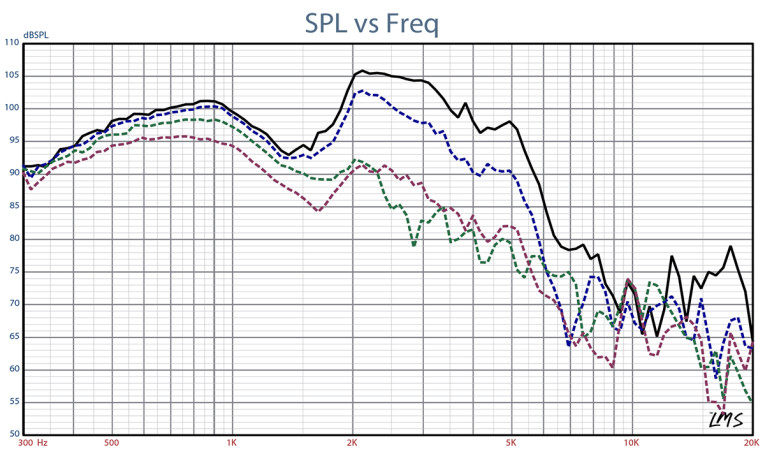
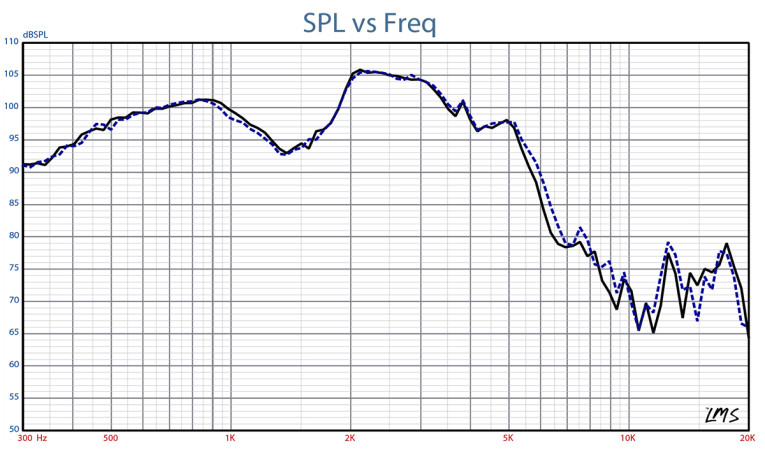
Next I mounted the Maverick in an enclosure which had a 14″ × 14″ baffle and was filled with damping material (foam) and then measured the transducer on- and off-axis from 300Hz to 40kHz frequency response at 2.83V/1m using the LinearX LMS analyzer set to a 100-point gated sine wave sweep. Figure 11 gives the on-axis response, but there is no point on commenting about the SPL of this type of speaker because often the anomalies are why it has a sound quality that guitarists really like! Figure 12 displays the on- and off-axis frequency response at 0, 15, 30, and 45°. Figure 13 gives the two-sample comparison, showing this sample pair to be well-matched.
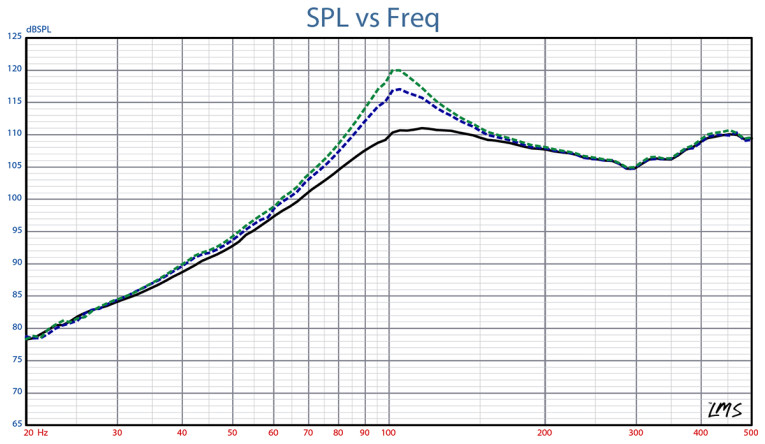
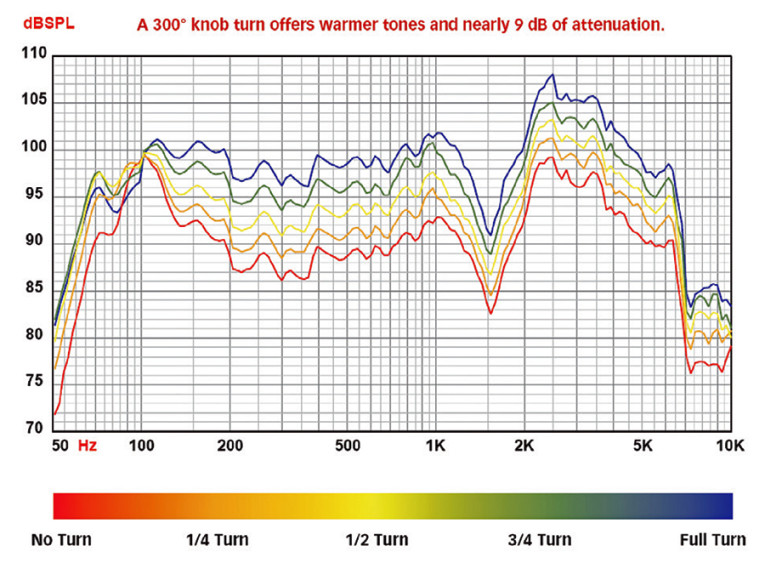
I also performed a series of near-field measurements to get a better look at the driver Q changes as the FDM knob is rotated. I normalized the curves to the full volume setting to produce the graph in Fig. 14. As you can see, as the volume is turned down, the Q of the driver goes up. You can get a better overall look at this with the full-range plot done by Eminence in Fig. 15. Here you can easily see the EQ effect as volume is turned down, making the driver less “bright,” which in guitar guy terms means “warmer.”
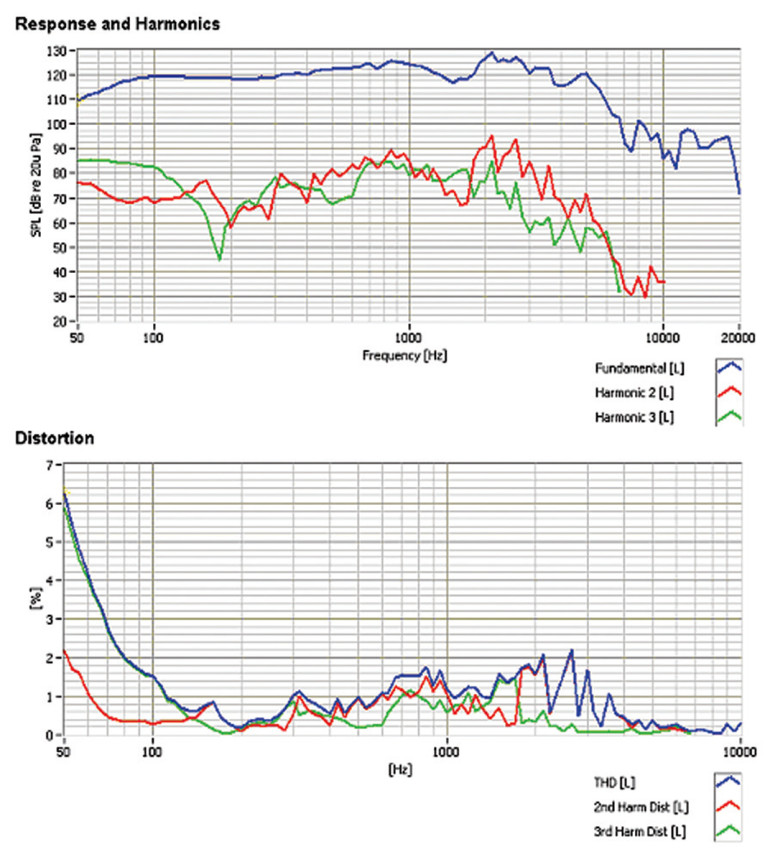
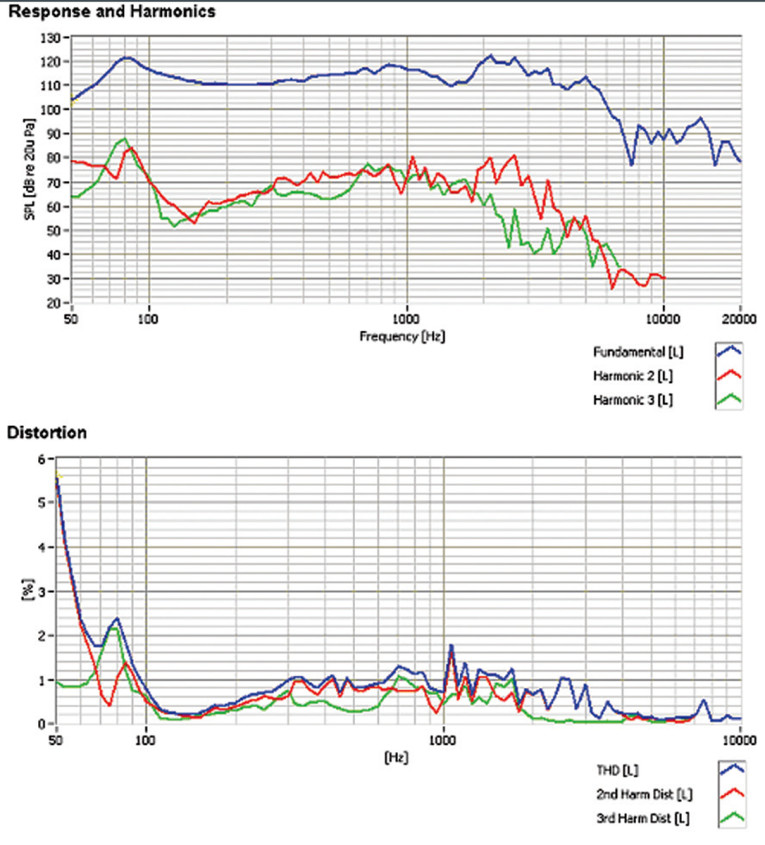
For the remaining series of tests, I employed the SoundCheck analyzer with the Listen Inc. ¼″ SCM microphone and power supply to measure distortion and generate time frequency plots. For the distortion measurement, I mounted the Eminence guitar speaker rigidly in free-air, and set the SPL to 104dB at 1m (5.8V) using a noise stimulus, and then measured the distortion with the microphone placed 10cm from the dust cap. This produced the distortion curves shown in Fig. 16 for the full-volume setting.
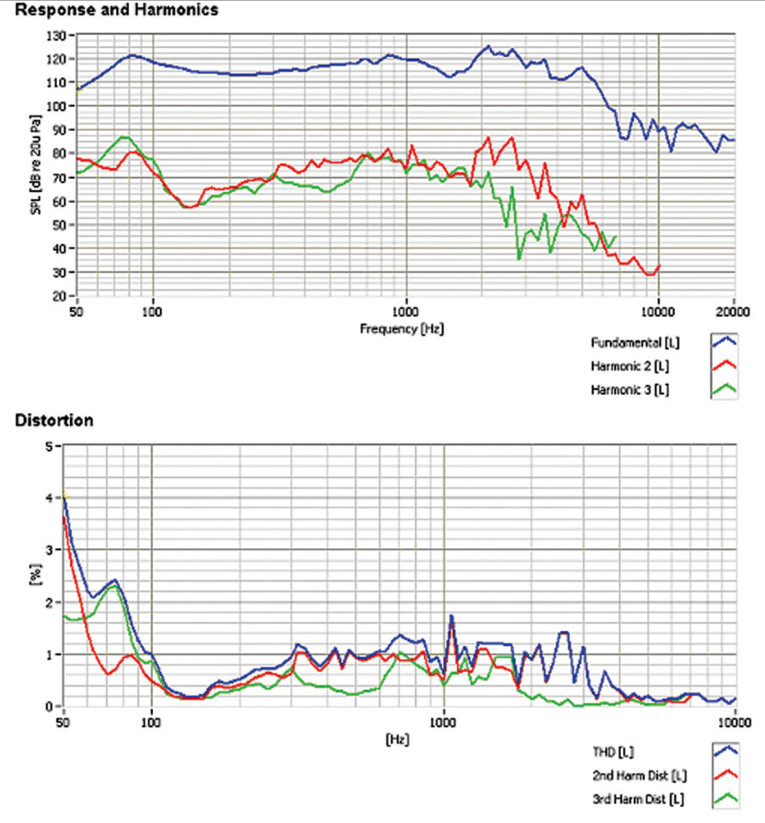
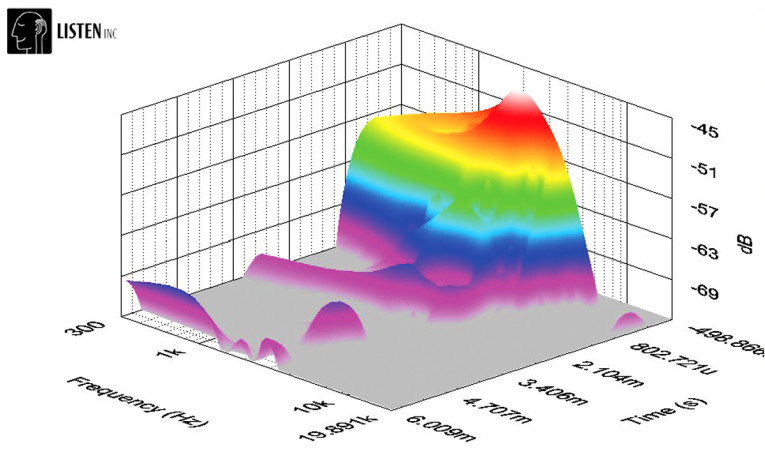
Figures 17 and 18 give the distortion plots for the 50% volume setting and the maximum attenuation setting, respectively. I then used SoundCheck to get a 2.83V/1m impulse response for this driver and imported the data into Listen Inc.’s SoundMap Time/Frequency software. The resulting CSD waterfall plot is given in Fig. 19 and the Wigner-Ville plot in Fig. 20. I hope you enjoyed looking at this very unique and clever driver from Eminence. For more information on this and other Eminence Pro drivers, visit www.eminence.com

This article was originally published in Voice Coil, January 2011.