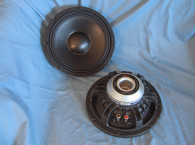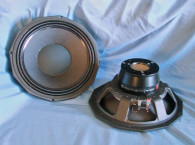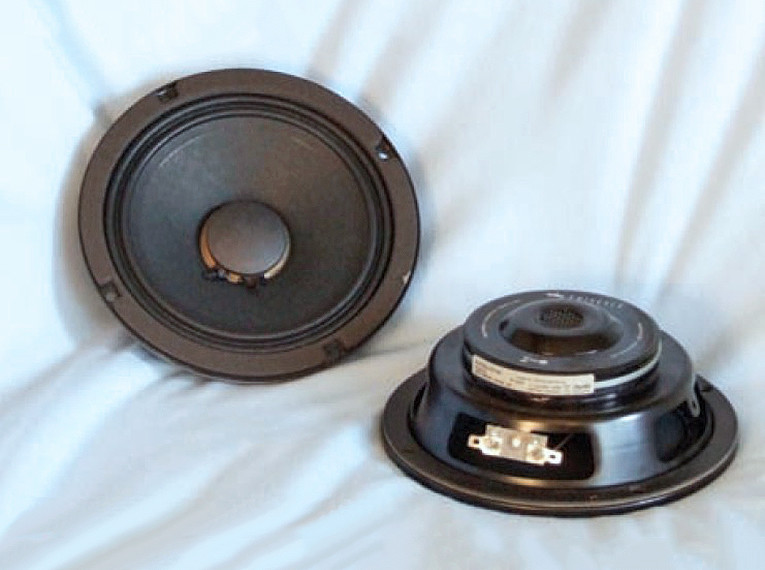
The motor assembly is powered by a neodymium ring magnet with conventional-looking steel front and back plates. Driving the cone assembly is a voice coil that consists of a 38.1mm (1.5″) diameter polyimide (Kapton) former wound with round copper wire. Voice coil tinsel lead wires terminate to a standard pair of solderable terminals.
I began testing with the driver clamped to a rigid test fixture in free-air, and, using a LinearX LMS analyzer and VIBox, produced both voltage and admittance (current) curves at 0.3V, 1V, 3V, 6V, and 10V. I post-processed all ten 10Hz-20kHz 550-point stepped sine wave curve pairs for each sample and divided the voltage curves by the current curves producing the five impedance curves.
The impedance curves each had the LMS phase calculation procedure applied and, along with the voltage curve for each sweep, were imported to the LEAP 5 Enclosure Shop CAD program. Because most T/S data provided by OEM manufacturers is produced employing either a standard T/S model or the LinearX LEAP 4 TSL model, I additionally produced a LEAP 4 TSL model using the 1V free-air curves.
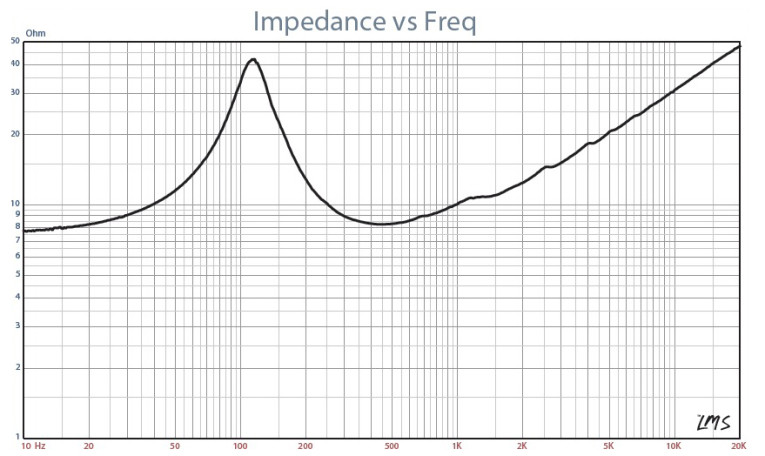

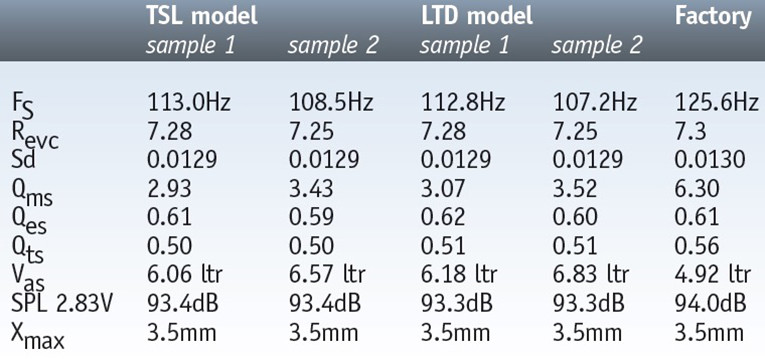
I selected the complete curve set, the multiple voltage impedance curves for the LTD model (see Fig. 1 for the 1V free-air impedance curve), and the 1V impedance curves for the TSL model in the transducer derivation menu in LEAP 5 and produced the parameters for the computer box simulations. Table 1 compares the LEAP 5 LTD and TSL data and factory parameters for both 6A samples.
Thiele/Small parameter results for the Eminence 6.5″ midrange/woofer were close to the factory data, with some variance in the Vas and SPL. Please note that the SPL difference, which was rather small with this woofer, is due to two different calculation methods. The LEAP 5 SPL data is a calculated number that is intended to represent mid band sensitivity. Eminence sensitivities are expressed as the average output across the usable frequency range when applying 1W/1m into the nominal impedance (2.83V/8Ω, 4V/16Ω, and so on), which is perhaps a more accurate presentation of overall sensitivity of a driver than the calculated sensitivity method.
The only caveat to this is that in the long run, no matter what the sensitivity number of any woofer is, the number you end up with for sensitivity depends on your application. If a woofer were used as a standalone design as a woofer, the resulting sensitivity would be no higher than that at the knee of the high-pass rolloff and you would end up throwing away all that sensitivity with the crossover design (this would also depend on the measurement domain required by the application, anechoic or half-space).
Conversely, if the same woofer were used as a midrange in a larger system, the available sensitivity would be closer to the Eminence published number. The only other variance that puzzled me was the Qms number. Mine looked like an aluminum former, while the factory Qms was more in line with the specified Kapton former. That said, I proceeded to program computer enclosure simulations using the LEAP LTD parameters for sample 1 using the sealed and vented enclosure sizes and tuning listed for this driver on the Eminence website. This included a 0.18ft3 closed box with 50% fiberglass fill material (suggested for midrange applications), and a 0.55ft3 vented box alignment with 15% fiberglass fill material and tuned to 82.5Hz.
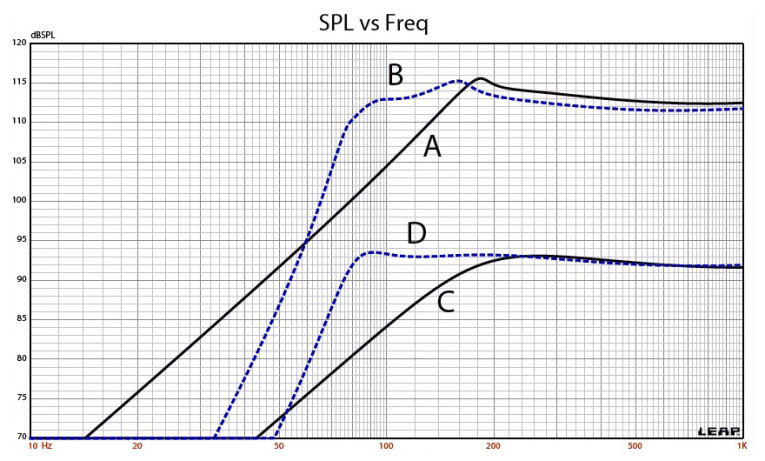
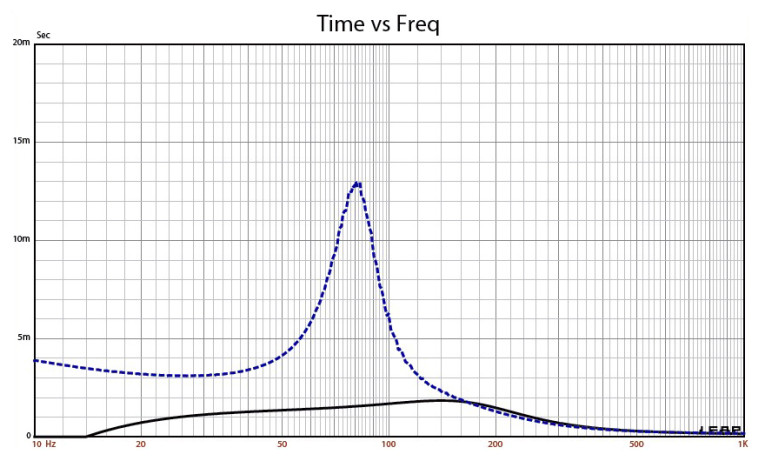
Figure 2 depicts the results for the Alphalite 6A in the sealed and vented boxes at 2.83V and at a voltage level high enough to increase cone excursion to Xmax + 15% (4mm). This calculation resulted in a F3 frequency of 149Hz with a Qtc = 0.71 for the 0.18ft3 sealed enclosure and –3dB = 77Hz for the 0.55ft3 vented box simulation. Increasing the voltage input to both simulations until the maximum linear cone excursion was reached resulted in 116dB at 45V for the smaller sealed enclosure and 115dB with a 36V input level for the larger vented box (see Fig. 3 and Fig. 4 for the 2.83V group delay curves and the 45/36V excursion curves).
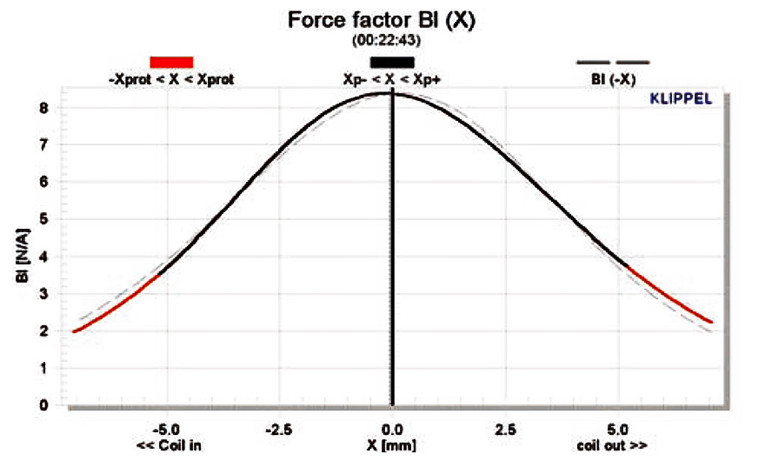


Klippel analysis for the Alphalite 6A produced the Bl(X), Kms(X) and Bl and Kms symmetry range plots given in Figs. 5-8. The Bl(X) curve (Fig. 5) is fairly narrow, but as you would expect for a short to moderate Xmax (3.5mm) pro driver, is very symmetrical with a very small amount of coil-in offset. Looking at the Bl symmetry plot (Fig. 6), this curve is offset a trivial 0.16mm coil-in at the rest position gradually rising to zero offset at physical Xmax of the driver. Figures 7 and 8 give the Kms(X) and Kms symmetry range curves for the 6.5″ woofer/midrange. The Kms(X) curve is very symmetrical with a very small amount of coil-out offset. Looking at the Kms symmetry range curve, there is 0.5mm coil-out offset at rest decreasing to nearly zero offset at the physical Xmax of the driver.
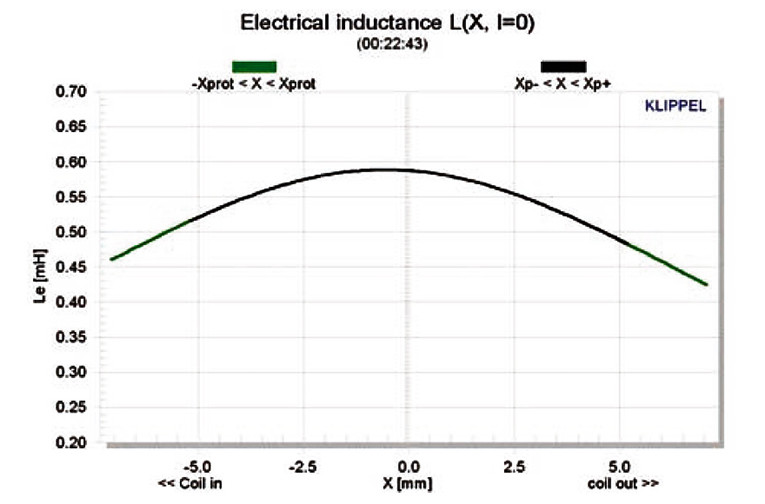
Displacement limiting numbers calculated by the Klippel analyzer for the Alphalite 6A were XBl at 82% Bl = 2.3mm and for XC at 75%, Cms minimum was 4.8mm, which means that for the 6A, the Bl is the most limiting factor at the prescribed distortion level of 10%. Figure 9 gives the inductance curves L(X) for the Eminence 6.5″ woofer/midrange.
Inductance will typically increase in the rear direction from the zero rest position as the voice coil covers more pole area, which is not what you see with this style of motor. From Xmax out to Xmax in, the inductance range is only 0.54mH to 0.60mH, which is obviously only a 0.06mH delta.
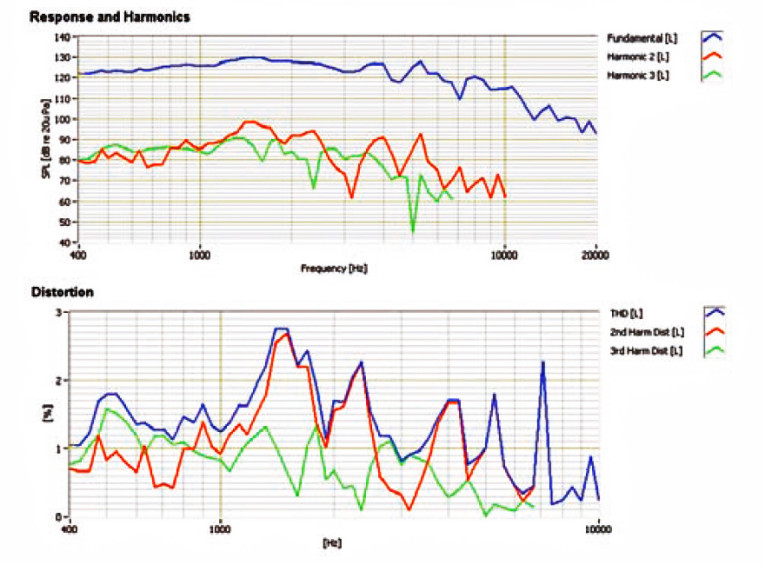
Next I fired up the Listen Inc. SoundCheck analyzer and set it up for distortion measurements. I set the SPL at 1m with the 6.5″ Eminence woofer mounted in free-air using a noise stimulus to 104dB (13.5V) at 1m, my standard for pro sound products. The Alphalite 6A produced the distortion curves shown in Fig. 10.
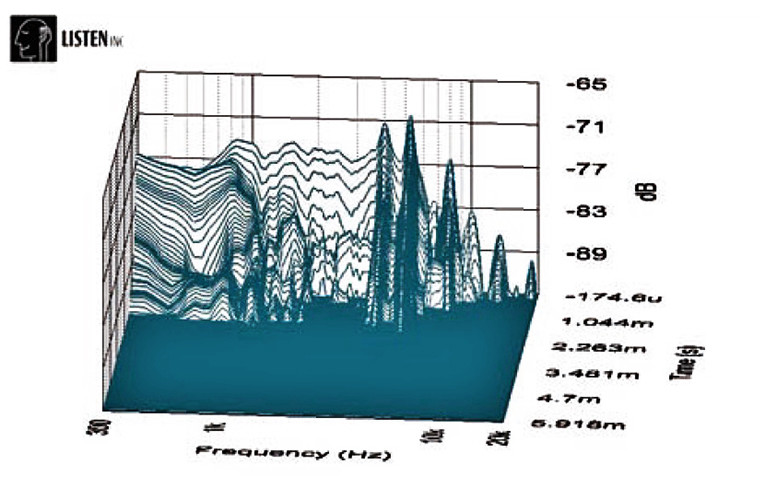
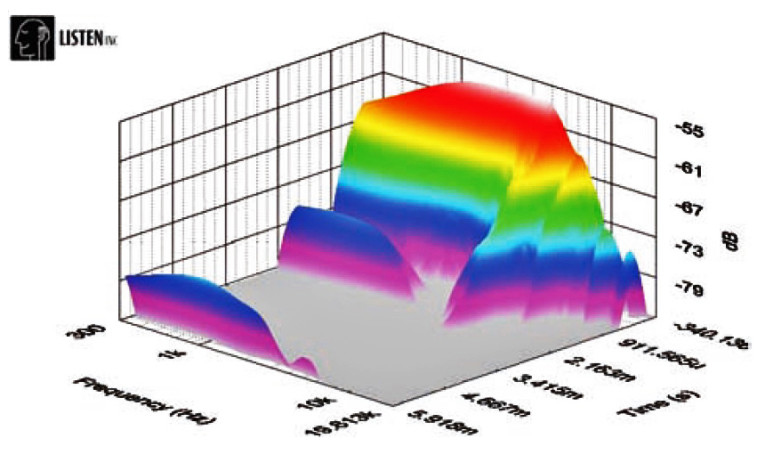
Following the distortion measurements, I mounted the 6.5″ Eminence midrange/ woofer in an enclosure with a 12″ × 8″ baffle to make the impulse measurement. I imported this into Listen Inc.’s SoundMap software, windowed to remove the room reflections, and produced the CSD waterfall plot in Fig. 11 and the Wigner-Ville plot in Fig. 12.
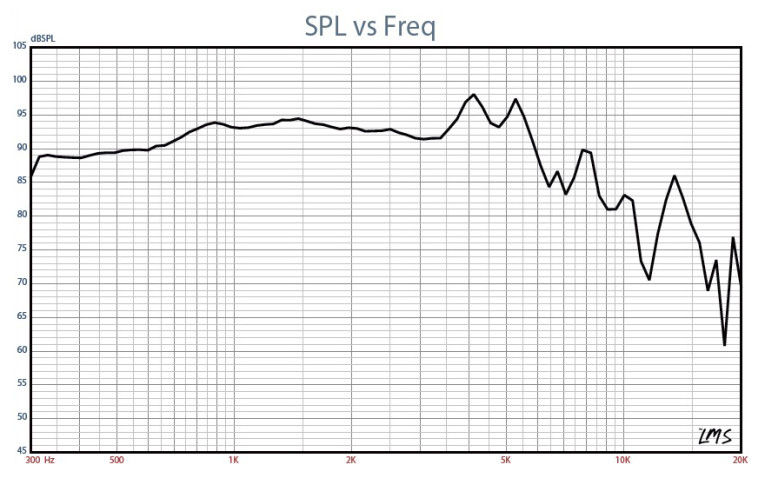
For the remaining series of SPL measurements, using the same enclosure as with the impulse response, I then measured the driver frequency response both on- and off-axis from 300Hz to 20kHz with a 100 point resolution at 2.83V/1m using a gated sine wave method. Figure 13 depicts the Alphalite 6A on-axis response, yielding a very smooth rising response out to 3.4kHz followed by a twin peak breakup often caused by the surround termination to the cone.
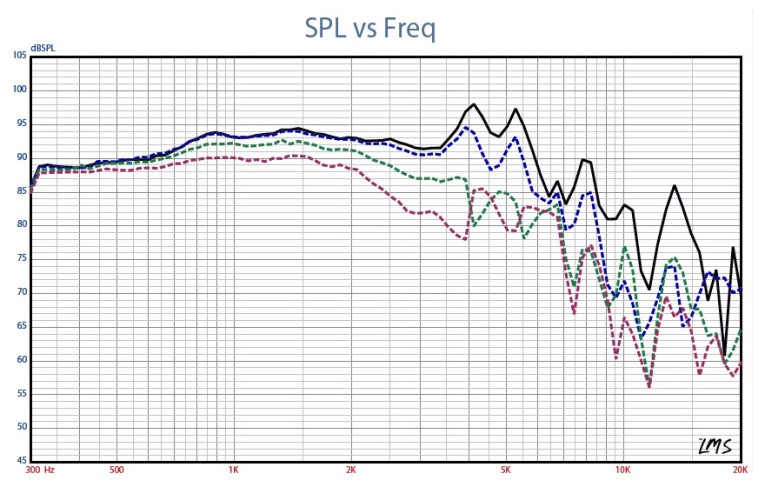
Figure 14 illustrates the off-axis frequency response at 0, 15, 30, and 45°. -3dB at 30° with respect to the on-axis curve occurs at 2.4kHz, which is in the vicinity of the typical 2.5-
3kHz frequently used for 6.5° drivers with 1″ domes, but with a horn—anywhere lower than that is appropriate.
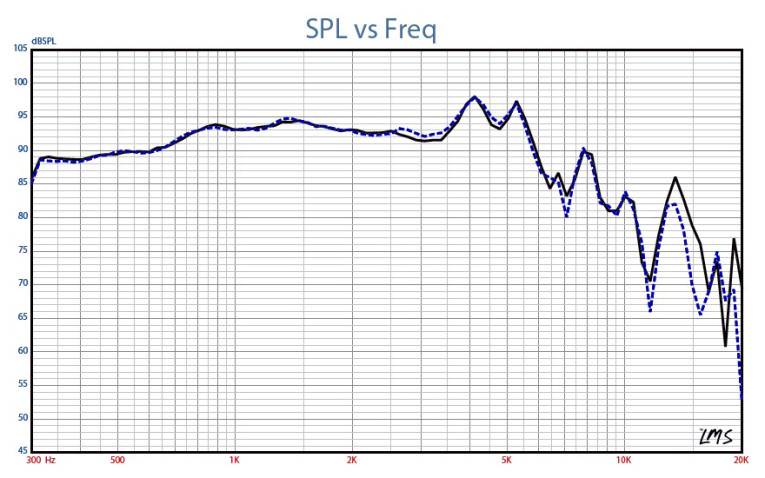
And last, Fig. 15 gives the two-sample SPL comparisons, showing both samples very closely matched. As is always the case, the 6A represents another well-crafted product from Eminence.
www.eminence.com
This article was originally published in Voice Coil, June 2010.