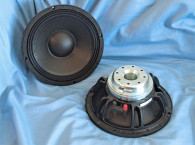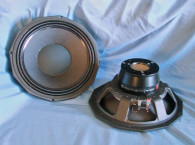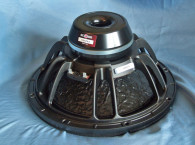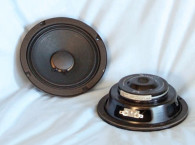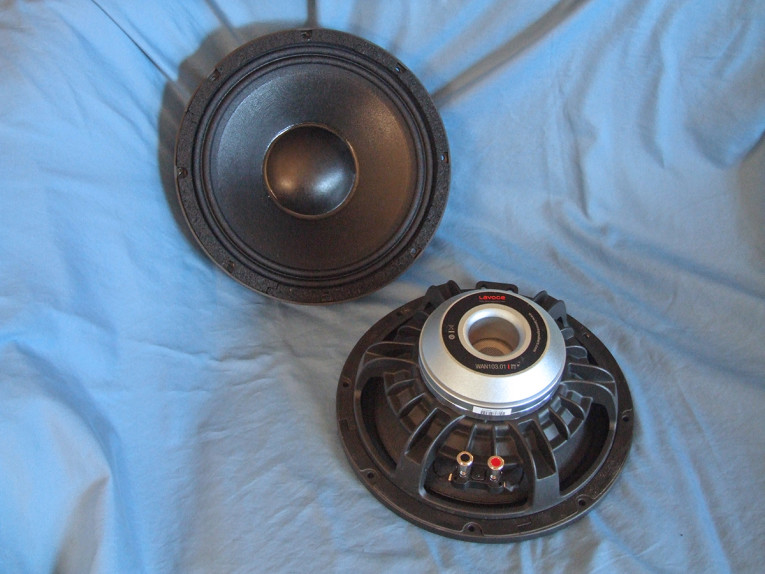

The WAN103.01’s applications are primarily for use as a midbass driver in multiway systems. The feature set for the WAN103.01 is like most high-performance pro sound drivers, fairly substantial. Starting with the frame, the WAN103.01 uses a proprietary six-spoke cast-aluminum frame incorporating 12 17 mm × 2 mm rectangular vent holes in the area below the spider mounting shelf for enhanced voice coil cooling. This series of cooling vents allows air to move past the voice coil and across the front side of the neodymium motor assembly.
The cone assembly consists of a curvilinear waterproof-coated paper cone along with a 3.5” diameter waterproof-coated paper dust cap. Compliance is supplied by a pleated coated polycotton cloth M-type surround and from a cloth type 5” diameter elevated spider (damper). The LaVoce WAN103.01 motor design utilizes a neodymium ring magnet structure sandwiched between a 9.5” polished front plate and the shaped cast return cup.
The neodymium magnet motor was FEA-designed using a 75 mm (3”) diameter voice coil wound with round copper-clad aluminum wire (CCAW) on a nonconducting Kapton former. The cast return cup includes a 0.9” diameter vent loading into a 1.5” diameter exhaust “tunnel.” Last, the connection to the WAN103.01 is made by a pair of chrome color-coded push terminals.
I commenced testing the WAN103.01 using the LinearX LMS analyzer and VIBox to create both voltage and admittance (current) curves with the driver clamped to a rigid test fixture in free-air at 0.3V, 1V, 3V, 6V, 10V, 15V, 20V, and 30V, allowing the voice coil to progressively heat up between sweeps with a 200 Hz sine wave. The LaVoce driver remained sufficiently linear enough for LEAP 5 to curve fit at the 20 V level, but the 30 V curves could not be curve fit by the software and were discarded.
Following my established protocol for Test Bench testing, I no longer use a single added mass measurement and instead use the measured Mmd data (38.3 grams for the WAN103.01). I post-processed the 14 550-point stepped sine wave sweeps for each WAN103.01 sample and divided the voltage curves by the current curves to generate impedance curves. I imported them along with the phase, derived using the LMS calculation method, and the accompanying voltage curves, to the LEAP 5 Enclosure Shop software.
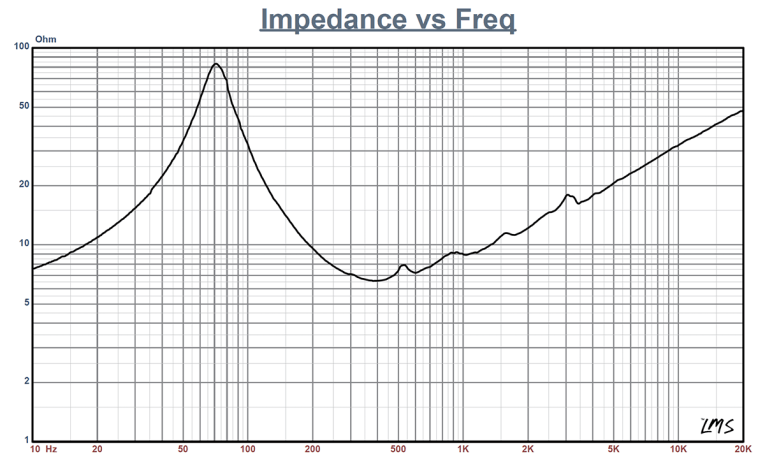
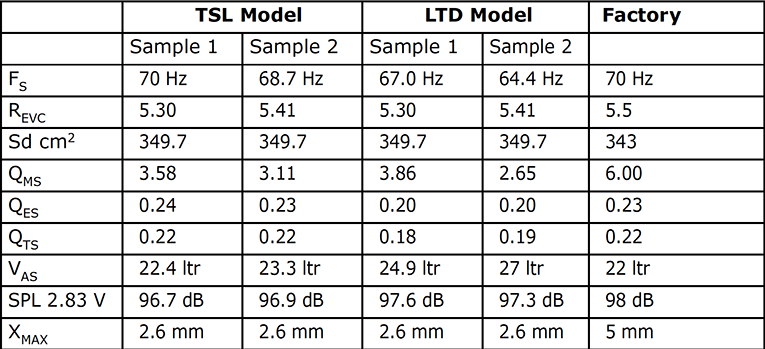
Because the Thiele-Small (T-S) parameters provided by the majority of OEM manufacturers is generated using either the standard model or the LEAP 4 TSL model, I additionally created a LEAP 4 TSL parameter set using the 1 V free air curves. I selected the complete data set, the multiple voltage impedance curves for the LTD model and the single 1 V impedance curve for the TSL model in the Transducer Model Derivation menu in LEAP 5. Then, I created the parameters for the computer box simulations. Figure 1 shows the 1 V free-air impedance curve. Table 1 compares the LEAP 5 LTD and TSL data and factory parameters for both of the WAN103.01 samples.
LEAP 5 parameter calculation results for the WAN103.01 were very close to LaVoce’s published data for this driver. The only real differences were that LaVoce uses a slightly more conservative Sd calculation (I use the cone diameter plus 50% of the surround), plus a different Xmax methodology. The published coil length and gap height dictate a 2.6 mm Xmax, while LaVoce lists Xmax as 5.0 mm. It is, like a lot of other pro sound manufacturers (e.g., B&C Speakers and Precision Devices), specifically accounting for the gap area fringe field, with which I certainly understand and have no problem with.
Following my established measurement protocol, I configured computer enclosure simulations using the LEAP LTD parameters for Sample 1. Two computer box simulations were programmed into LEAP 5, a modified Extended Bass Shelf (EBS) alignment 600 in3 volume (15% fill material) tuned to 110 Hz and a higher group delay vented alignment with a 1000 in3 volume tuned to 79 Hz, also simulated with 15% fiberglass damping material.
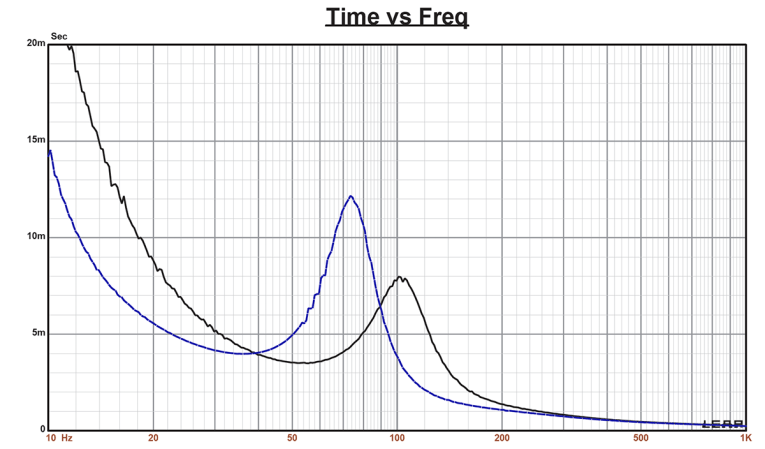
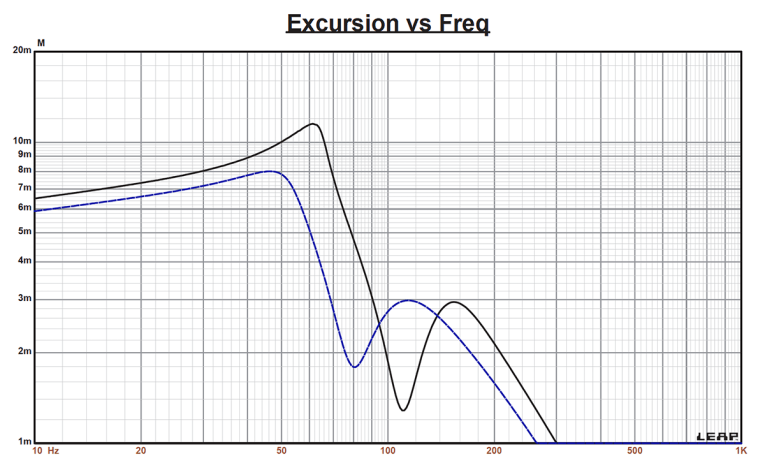
Figure 2 displays the results for the WAN103.01 in the two vented enclosures at 2.83 V and at a voltage level sufficiently high enough to increase cone excursion to Xmax + 15% (2.99 mm for the WAN103.01). This produced a F3 frequency of 98 Hz (F6 = 90 Hz) for the modified EBS enclosure and -3 dB = 70 Hz (F6 = 64 Hz) for the higher group delay vented simulation. Increasing the voltage input to the simulations until the maximum linear cone excursion was reached resulted in 124 dB at 71 V for the factory recommended box and 119 dB for the same 48 V input level for the larger vented box. Figure 3 shows the 2.83 V group delay curves. Figure 4 shows the 71 V/48 V excursion curves. Please note that the drivers start over excursing below about 80 Hz, so an appropriate high-pass filter will increase the undistorted output considerably, but all the vented enclosures really should have a high-pass filter.

Klippel analysis for the WAN103.01 produced the Bl(X), Kms(X) and Bl and Kms symmetry range plots given in Figures 5-8. (Our analyzer is provided courtesy of Klippel GmbH. The tests are performed by Pat Turnmire, of Redrock Acoustics and author of the SpeaD and RevSpeaD transducer development software.)
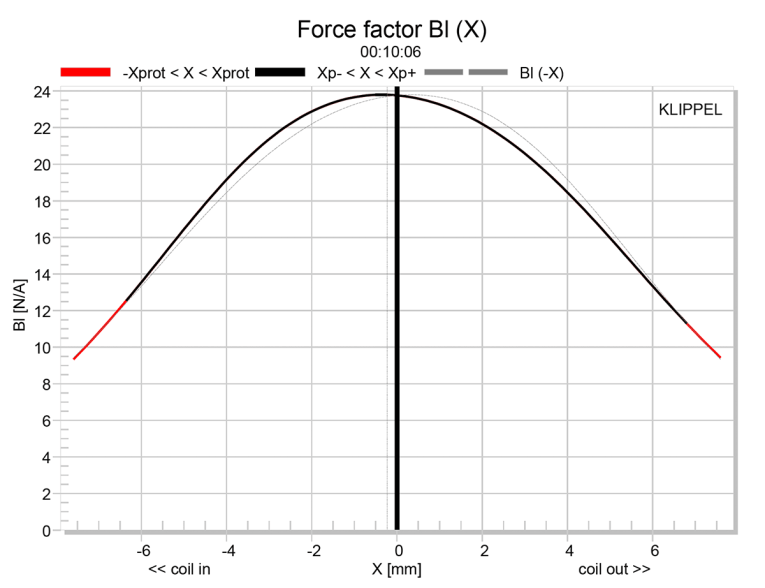
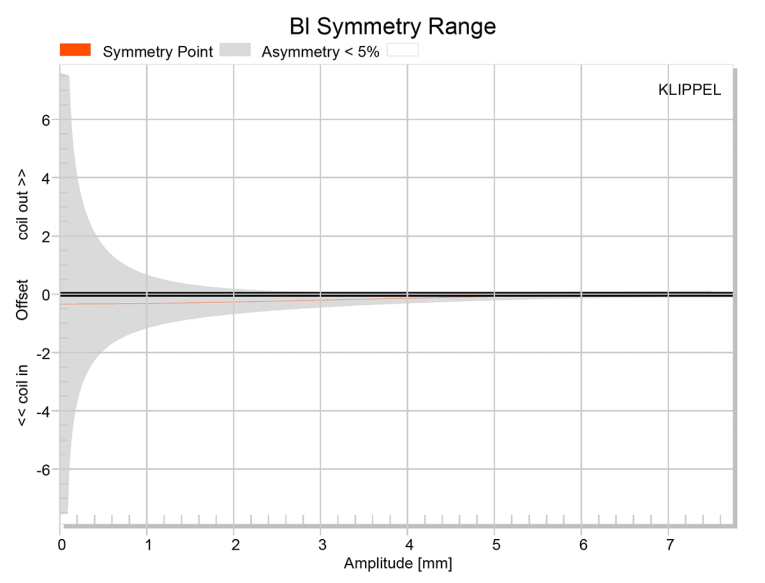
The Bl(X) curve for the WAN103.01 (see Figure 5) is moderately broad and symmetrical, typical of a short Xmax driver, but with practically no amount of offset. Looking at the Bl symmetry plot (see Figure 6), this curve shows a trivial 0.22 mm coil-in offset at the 2.6 mm physical Xmax position. This minor offset remains relatively constant throughout the operating range of this driver.
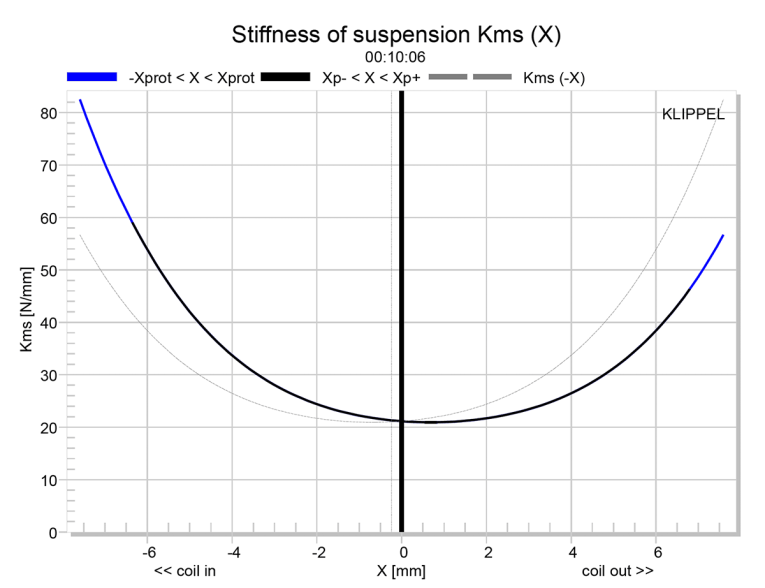
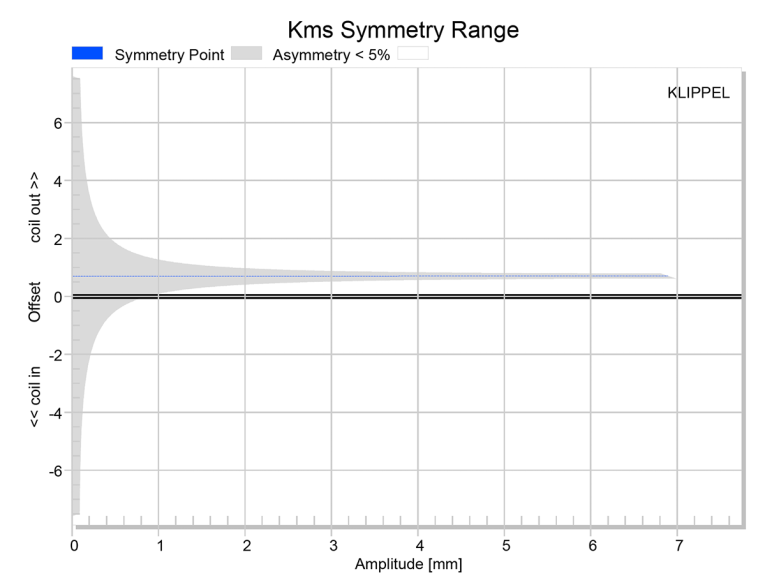
Figure 7 and Figure 8 show the Kms(X) and Kms symmetry range curves for the WAN103.01. The Kms(X) curve is also rather symmetrical in both directions accompanied by a small amount of coil-out offset. Looking at the Kms symmetry range plot, the coil-out offset at the 5.5 mm physical Xmax of the driver is only 0.7 mm, and remains constant. Displacement limiting numbers calculated by the Klippel analyzer for the WAN103.01 were XBl at 82% Bl = 3.5 mm and for XC at 75% Cms was 3.0 mm, which means that for this LaVoce driver, the compliance is the most limiting factor for prescribed distortion level of 10%, so in a two-way application, quite good. Both numbers are greater than the driver’s physical Xmax.
Figure 9 gives the inductance curves Le(X) for the WAN103.01. Inductance will typically increase in the rear direction from the zero rest position as the voice coil covers more pole area, which is not what is happening here, but it is typical of this type of neodymium motor. The inductance swing for this driver is a really low 0.027 to 0.063mH, which is excellent performance.


With the Klippel testing completed, I mounted the WAN103.01 in a foam-filled enclosure that had a 15” × 14” baffle and then measured the device under test (DUT) using the LoudSoft FINE R+D analyzer and the GRAS 46BE microphone (courtesy of LoudSoft and GRAS Sound & Vibration) both on and off axis from 200 Hz to 20 kHz at 2 V/0.5 m normalized to 2.83 V/1 m (one of the really outstanding features of FINE R+D) using the cosine windowed Fast Fourier Transform (FFT) method.
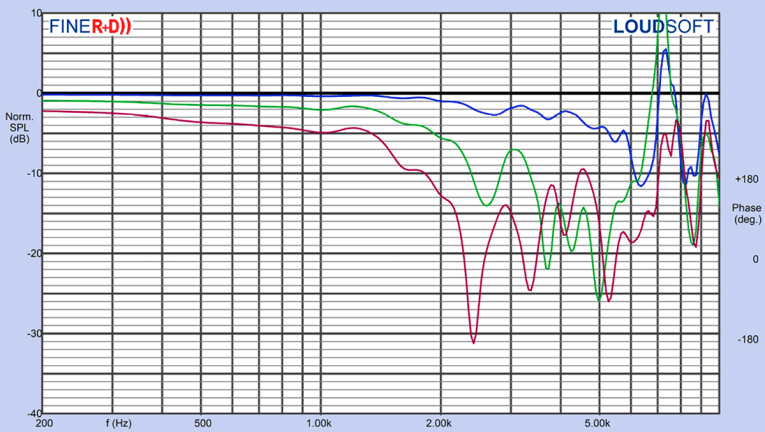
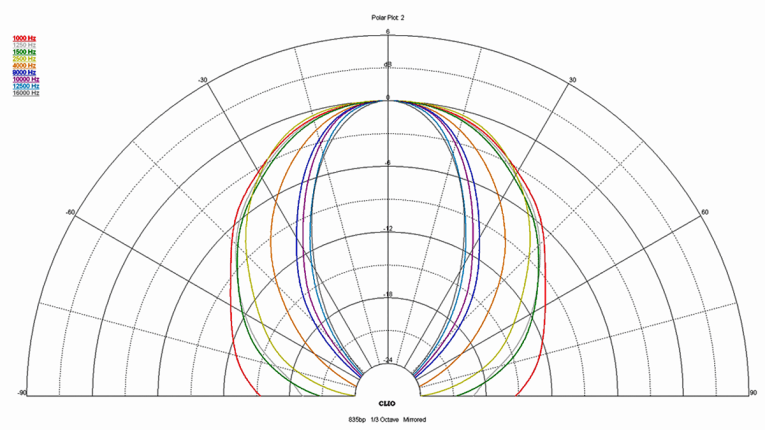
Figure 10 gives the WAN103.01’s on-axis response indicating a ±2 dB response from 400 Hz to 2.5 kHz followed by some fairly minor break breakup mode peaks at 2.7 kHz and 3.4 kHz just before the low-pass roll-off. Figure 11 displays the on- and off-axis frequency response at 0°, 15°, 30°, and 45°, showing the typical directivity for a 10” woofer. Figure 12 shows the normalized version of Figure 11. Figure 13 shows the CLIO polar plot (in 10° increments and 1/3 octave smoothing). And finally, Figure 14 displays the two-sample SPL comparisons for the WAN103.01, showing a close match within 1 dB throughout the operating range up to 2 kHz.
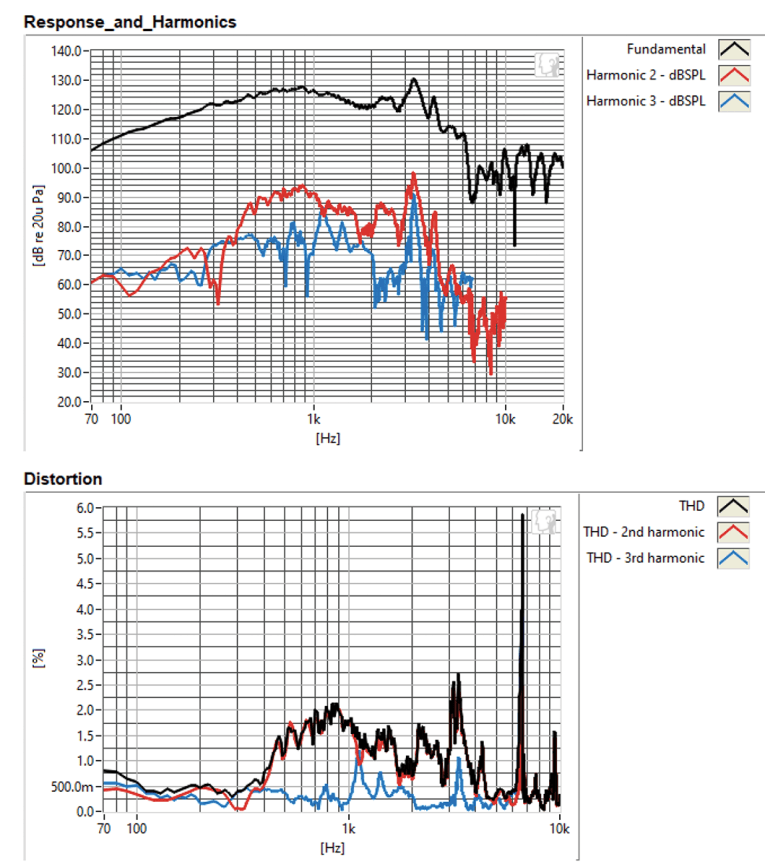

Next, I employed the Listen, Inc. SoundCheck AudioConnect analyzer and SCM 1/4" microphone to measure distortion and generate time-frequency plots (courtesy of my friends at Listen, Inc.). For the distortion measurement, I mounted the WAN103.01 rigidly in free-air, and set the SPL to 104 dB at 1 m (7.7 V), using a pink noise stimulus. Then, I measured the distortion with the Listen microphone placed 10 cm from the driver. This produced the distortion curves shown in Figure 15.
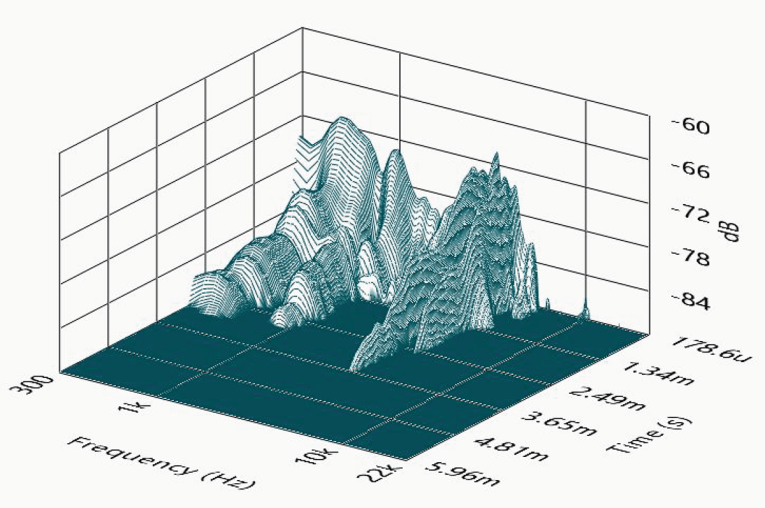
I then used SoundCheck to get a 2.83 V/1 m impulse response for this driver and imported the data into Listen’s SoundMap Time/Frequency software. Figure 16 shows the resulting cumulative spectral decay (CSD) waterfall plot. Figure 17 shows and the Wigner-Ville plot (chosen for its better low-frequency performance).
Although this is the first LaVoce piston range driver that I have had the chance to characterize, the WAN103.01 has excellent build quality and it would appear that the company is going to be a formidable player in the OEM pro market. For more information about this driver and other LaVoce transducers, visit www.lavocespeakers.com. VC
This article was originally published in Voice Coil, February 2020.