The Status Quo
Currently, a lab report summary will generally provide some very useful information for calculating and determining a material’s impact on the acoustics of a space or its contribution to an assembly. These frequently come in the form of coefficients or some simplified numeric value, distilling all the measured results into a digestible, and hopefully useful, output. This could include whole octave or one-third octave frequency bands for absorption, in sabins or coefficients or both — maybe with a nice noise reduction coefficient (NRC) value to sum it all up.
There are similar outputs for sound transmission, impact insulation, and other acoustic characteristics of materials and assemblies. We can plug these values into some equations, and voilà... we then know exactly how a space will sound with the inclusion of these materials.
Well, not exactly. For the professionals who cringed while reading that last sentence — you know the perils of absolutes. How many of you are running the calculations and absolutely guarantee the 20 Hz to 20 kHz performance of an “as built” environment? There are many things that can go wrong during the build, but there is a more fundamental problem: Do we even have enough information to calculate exactly how it will perform?
Not exactly. Why? Tests are performed in controlled environments, and therefore, the results are a best-case scenario. Test results are measurements of performance in a very specific scenario, which are distilled into values that are used to calculate performance. So, we are using information obtained in a known, controlled environment and applying it to different environments — where variables such as room volume, room geometry, source location, and more, interact to create a vastly different acoustic space requiring vastly more complicated calculations.
More importantly, you don’t get all of the available data from a test. Remember that tests report very specific, processed data. Maybe you get one-third octave sabins, or one-octave Sound Absorption Coefficients, or a Transmission Loss graph… but, while all of this information is useful in its own way, we should take a step back and look at the big picture. Is having an NRC enough information to provide an exact prediction of how a material will perform at all frequencies, in all environments? Of course not. Are one-third octave sabins or Sound Absorption Coefficients enough to do the same? Unfortunately, also “no” — but that’s only part of the problem.
The Unspoken Truth — Repeatability & Reproducibility
Theoretically, if you take a single sample of material to different labs — tested with the same test — you should receive exactly the same result. This misconception is called reproducibility, and is the first unspoken truth... or perhaps... the elephant in the lab. Deviation from lab to lab is the rule.
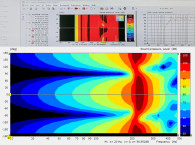
Labs that are accredited, voluntarily participate in round-robin evaluations, where they all run the same test on the same material. Those results are then graphed, and the range of values is defined and analyzed. Notice, I said range... variability and deviation are the rule. Why?
The answer is related to Repeatability. It’s assumed that if you run the same test, in the same lab, you’ll always get the same result. This isn’t true. It’s just the way it is, and is another reason why there are issues with the absolute accuracy of measurements and material performance databases.
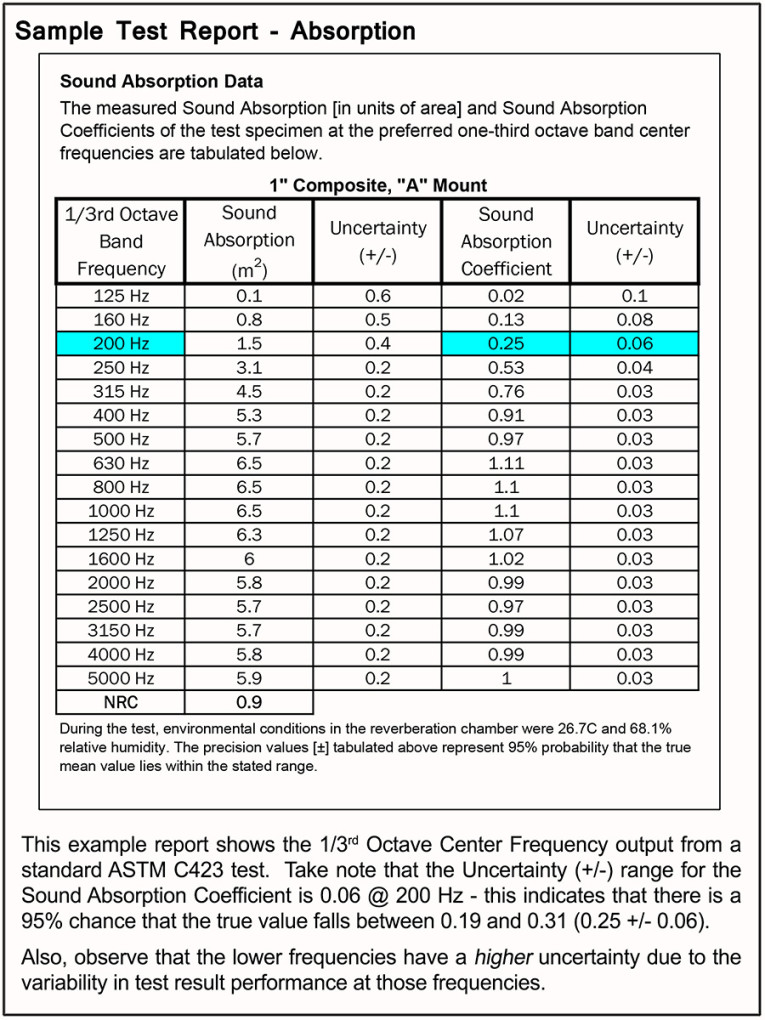
If you completely read a lab report, it will sometimes state the accuracy or Certainty of the measurement. It will many times provide an Uncertainty (±) value, which indicates a range where you presume the value falls. Now, why do I say presume? This certainty will have a Confidence Percentage based on the variability of different measurements, like the round-robin. This confidence is usually 95% or 95.45% (2-Sigma when graphing the results). This means if an accredited lab runs this test, it will, with about 95% confidence, get a value that falls within a certain range, around the stated value.
So, take this example: Let’s say you get a Sound Absorption Coefficient of 0.25 at 200 Hz, but your Uncertainly (±) Value is 0.06. You can be 95% confident that the true value falls somewhere between 0.19 and 0.31 — with a 5% possibility that it won’t. If the controlled, best-case-scenario, laboratory environments are only this accurate, perhaps we shouldn’t assume absolute accuracy in our real-world predictions.
What is the Future?
With all of these inherent problems in measuring and reporting data, how can we improve things? There will always be Uncertainty issues, Reproducibility & Repeatability issues, and issues with accuracy. Accepting this fact and trying to minimize it is a good start.
The International Organization for Standardization (ISO), ASTM International (formerly known as American Society for Testing and Materials), the Audio Engineering Society (AES), and other organizations are constantly evaluating and refining their current methods to increase accuracy by improving repeatability and reproducibility, which narrows the Uncertainty value. There is also research by other institutions to develop new methods that may prove to be more accurate or provide more information.
More Data!
Remember the one-third octave data report? What happens if your problem frequency isn’t exactly one of those values? Or even worse, what if you are looking at low or high frequencies that aren’t even reported?
Depending on the test, it may say something like “measurements are made in the ISO-Preferred one-third octave bands from 100 Hz to 5000 Hz...,” which means that frequencies outside of that range aren’t measured or represented.
There are many reasons for this — you need large labs for accurately testing low frequencies, and simple things (e.g., humidity) have a huge effect on high-frequency propagation. However, there are people demanding more accuracy, and for good reason.
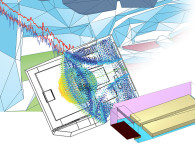
Simulation and Modeling
Simple hand calculations and spreadsheets are giving way to higher performance acoustic models and simulations. The input into these models is material data derived from these standard test methods.
With various materials in an environment and incomplete or inaccurate test data for those materials, there are many variables that are limiting these simulations. The future of acoustic material testing will address the colossal task of creating more accurate and granular data at a wider frequency range. This data will inform the models and simulations, allowing them to more accurately represent the performance of acoustic spaces.
Perhaps with the advent of inexpensive storage and bandwidth, all of the raw measurements will be made available to the end-users for analysis. There is great value in that wealth of data, and it may contain the key to closing the accuracy gap.
Eating the Elephant
A great metaphor (which I’ll paraphrase poorly and credit to Michael Vorländer) is: “Tackling all of the obstacles in creating accurate acoustic simulations is like trying to eat an elephant, which can only be approached one way — one bite at a time...” “...and having accurate material performance data is only one bite.”
Bon Appétit. aX
This article was originally published in audioXpress, August 2020.
 About the Author
Jim DeGrandis is a Research & Development Engineer at Acoustics First Corp., a member of the Acoustical Society of America (ASA), and he works with ASTM International on researching new acoustic testing methods. DeGrandis frequently lectures about acoustic phenomena, simulation, and architectural acoustic design.