
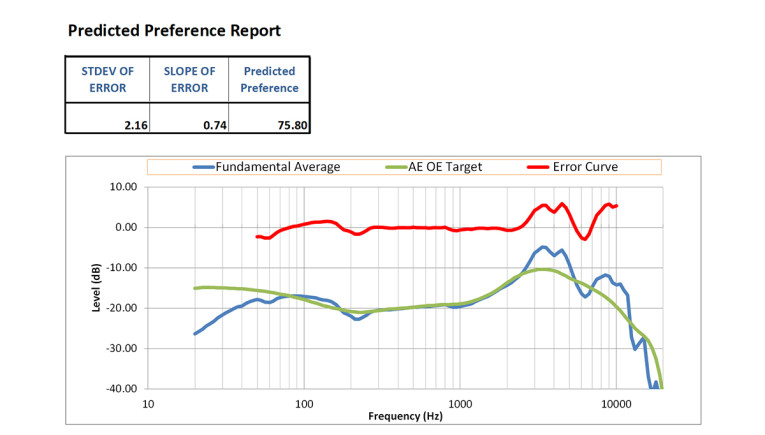
The sequence measures the headphone in SoundCheck, and saves the results to an Excel template. Within Excel, a Predicted Preference Score on a scale of 0 to 100 is calculated based on the Harman Target Response Curve. The calculation involves subtracting the target curve from an average of the headphone left/right response to obtain an error curve, and analyzing this curve (standard deviation, slope and average) to calculate the score.
The standard deviation, slope and average of the Error curve are calculated and used to calculate the predicted preference score. The sequence also provides the option to recall data rather than making a measurement, which saves time for engineers who already have large quantities of saved data, and enables historical comparison with obsolete products.
The model includes in-ear, on-ear and over-ear headphones, with the user prompted to select the appropriate type when running the sequence. The sequence also provides the option to recall data rather than making a measurement, which saves time for engineers who already have large quantities of saved data, and enables historical comparison with obsolete products.
The sequence is very flexible and easy to customize for specific requirements. It can be downloaded free of charge from Listen’s website: http://content.listeninc.com/prediction
More Test Sequences
Among the most recent Soundcheck test sequences introduced by Listen, users can find a useful Microphone SNR Measurement (or Background Noise Method), which characterizes a microphone’s ability to passively and/or actively reject noise in the user’s environment. Unlike traditional microphone SNR measurements which calculate a ratio based upon a reference signal and the microphone’s noise floor, this method utilizes a signal (speech played from a mouth simulator) and noise (background noise played from two or more equalized source speakers) captured by both a reference microphone and the DUT microphone.

Another recent test sequence measures the Max SPL of a transducer versus frequency that a device can play back with acceptable distortion. This is particularly valuable for designers using DSP algorithms to optimize the performance of their speakers. It characterizes the Max SPL of a transducer by setting limits on specific metrics (THD, Rub & Buzz, Perceptual Rub & Buzz, Input Voltage and Compression) and then driving the transducer at a series of standard ISO frequencies, increasing the stimulus level until the one of the limits is surpassed.
www.listeninc.com