That drove my desire to get a tape recorder, and eventually it also drove my lifetime goal of learning all about audio and recording, developing a keen interest in analog circuit design along the way. Knowing how to use audio gear effectively is great fun, but for me understanding how audio devices actually work is even more fun. I never got a degree or even went to school for electronics, but I worked as a technician with many excellent “real” engineers. I asked them endless questions, and learned a lot. By the 1970s, I had designed and built equalizers, compressors, analog synthesizers, and even an entire 16-channel recording and mixing console.
At one of my technician jobs, I had the good fortune to befriend Leo Taylor, who later was a senior tech at a nearby Hewlett-Packard (HP) repair facility. Leo had all the latest HP test gear, which we used to design several analog synths. Leo’s test bench included state-of-the art oscilloscopes, signal generators, real-time audio analyzers, and even a distortion analyzer. But I never bought any professional test gear myself. Between Leo and whatever electronics company for which I currently worked, I always had access to everything I needed.
Eventually I developed other interests — by 1980, I built and was running a large commercial recording studio, then a software company, then I started playing the cello and composing classical music, plus other non-electronic projects.
Now, fast forward to the present when I started developing a new and unique type of audio testing device. Hopefully, that will be the subject of a future audioXpress article! I still have engineer friends with workshops and real test gear, but eventually I got tired of driving half an hour every time I wanted to troubleshoot the latest developments of my device.
I have a good digital multimeter, but it was time to buy an oscilloscope. I’ve done a lot of signal analysis just recording into Sound Forge — the audio editor program I use. You can zoom in to see the waveforms at any level of detail, and even show the spectrum as an FFT graph. You can also buy or build accessories that turn a USB sound card into an oscilloscope suitable for audio testing. But even with a sound card set to sample at 192 kHz, there’s no way to see if radio interference is getting into your circuit, or to tell if an op-amp is oscillating at megahertz frequencies.
Choosing an Oscilloscope
I’ve seen ads for USB oscilloscopes with megahertz bandwidths, so on my Facebook page, I asked for recommendations of two-channel USB oscilloscopes costing no more than a few hundred dollars. Many people posted links to their favorite models, and several others insisted that all USB oscilloscopes are awful and I’d never be happy unless I bought a real hardware oscilloscope. But the available space on my desk is barely more than one foot square, and I also wanted a signal generator.
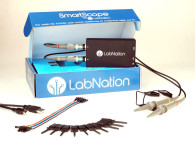
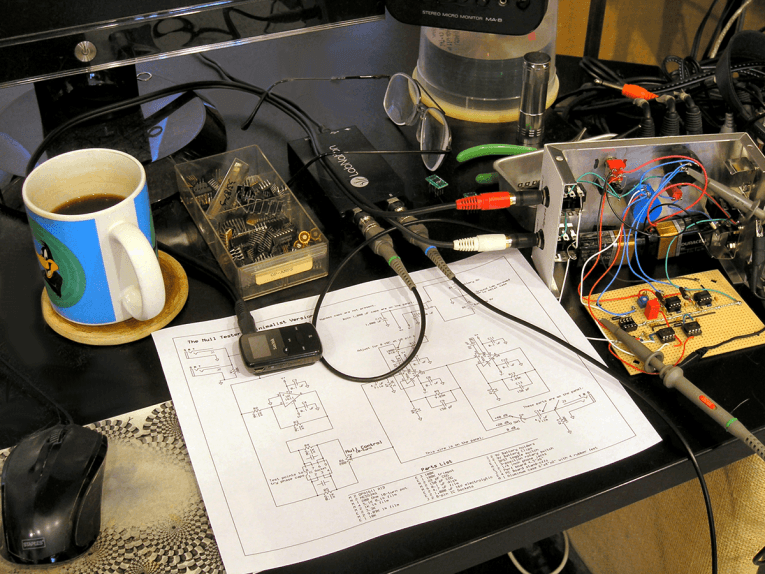
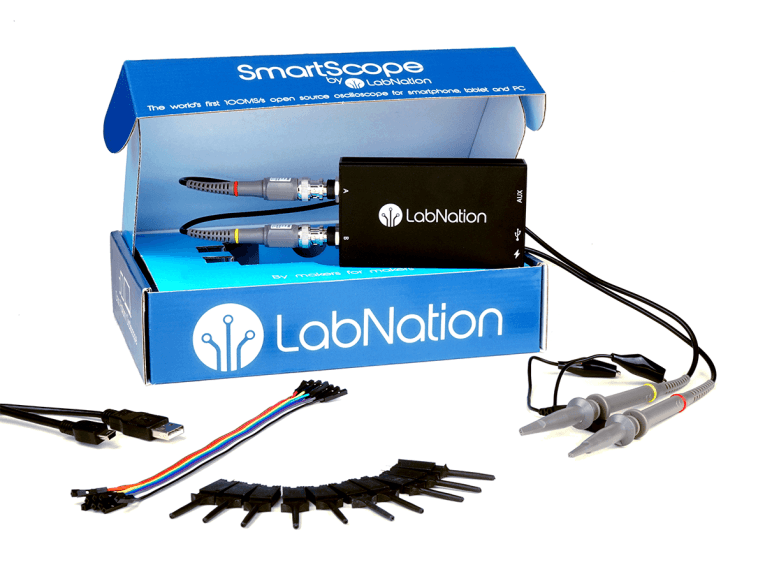
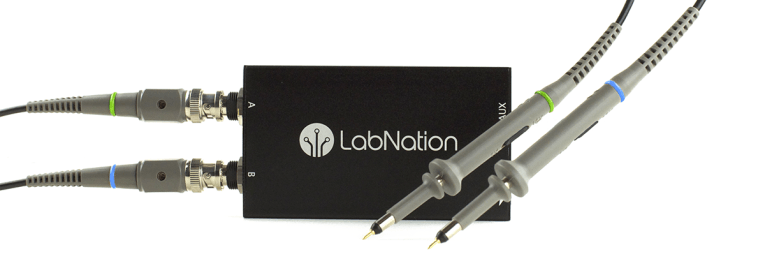
One of my local Facebook friends offered to lend me her LabNation SmartScope, and that turned out to be perfect for my needs. Besides doing everything I need and then some, it’s only slightly larger than a deck of cards (see Photo 1). So I bought my own and have used it with great success for several months.
LabNation SmartScope
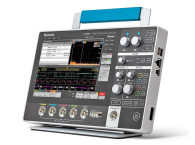
So what exactly do you give up with a USB oscilloscope compared to a standalone hardware model? As it turns out, not much! One limitation is the input A/D converter is only 8 bits, so at the highest sensitivity of 20 mV per major division you can see little steps when viewing small signals. (However, affordable digital oscilloscopes, even from “big name” companies such as Tektronix, are also only 8 bits.) Another limitation for me is that the documentation is online only, and not quite as complete or as detailed as I’d like. Though it’s certainly adequate, and the company provides an online support forum where its tech staff answers questions promptly.
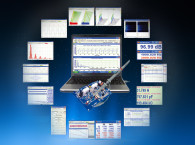
As far as I’m concerned the SmartScope’s features totally outweigh its limitations, especially for only $230. You get a real two-channel 30 MHz storage oscilloscope with capable and intuitive software. One big feature for me is that you see the waves on your computer screen, which in my case is a 24” LCD. Even at the $1,000 price point, hardware oscilloscope screens are much smaller. The SmartScope also includes two signal generators—analog and digital — and an eight-channel logic analyzer (see Photo 2).
However, the analog output is also only 8 bits, so it’s not suitable for testing distortion in audio devices. All of the connecting wires needed are provided including a USB cable, two standard oscilloscope probes (1x or 10x switchable), plus connecting wires and “grabber” clips for the analog and digital signal generators and the logic analyzer.
The SmartScope Software
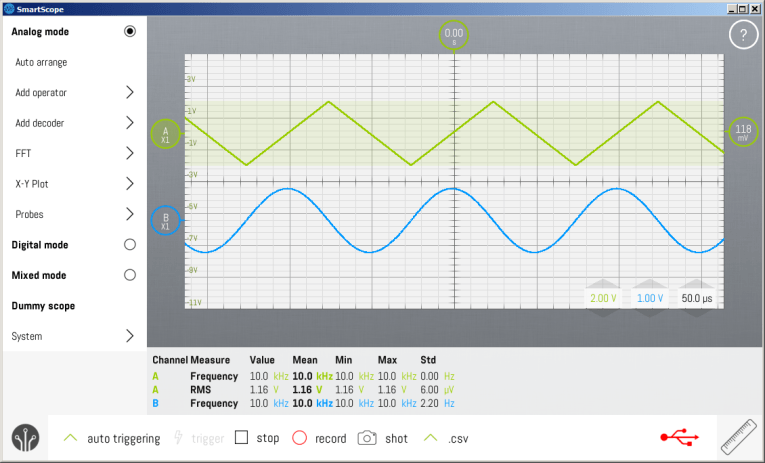
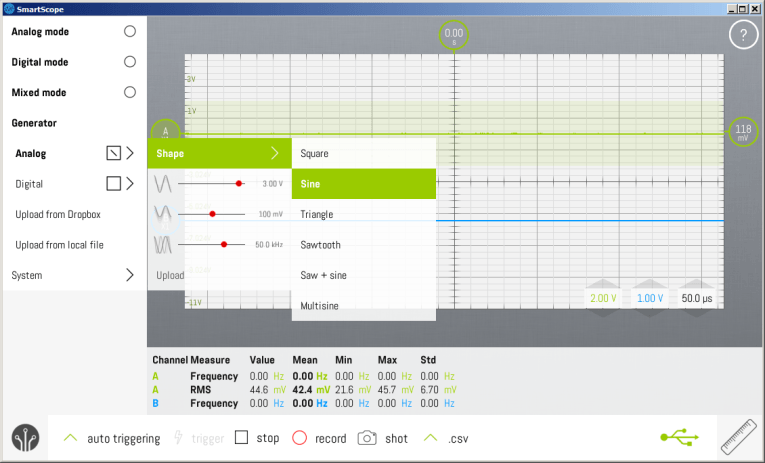
As for software, SmartScope is available in versions for Windows, OSX, Linux, Android, and iOS. The main screen is shown in Figure 1, and includes extra features such as record to disk, Fast Fourier Transform (FFT) analysis, a frequency counter, and an RMS voltmeter. You can also place a pair of vertical cursors (not shown) some distance apart on the screen, and the software displays either the time span between them or the equivalent frequency for that period. Pressing Stop freezes the display and lets you zoom in on the displayed waves.
The software enables internal or external triggering in either direction (or both), and can store up to 4 million samples per channel in memory. Other options include setting the UI size, color scheme, and waveform trace thickness, to accommodate hardware platforms having large or small screens. The software also works in Demo mode so you can download it to see how it works before you buy the SmartScope. Though if you buy it and aren’t satisfied, the company offers a full refund within 30 days.
The SmartScope software is organized into sections along the left, and each section opens up when selected to show its available features and options. The Measurements Box at bottom can float on top of the main display, which is useful when using a tablet or smart phone having a small screen. But it can also be docked at the bottom as shown, or on the right edge. Another pane at the right opens to let you choose which measurements to display in the box.
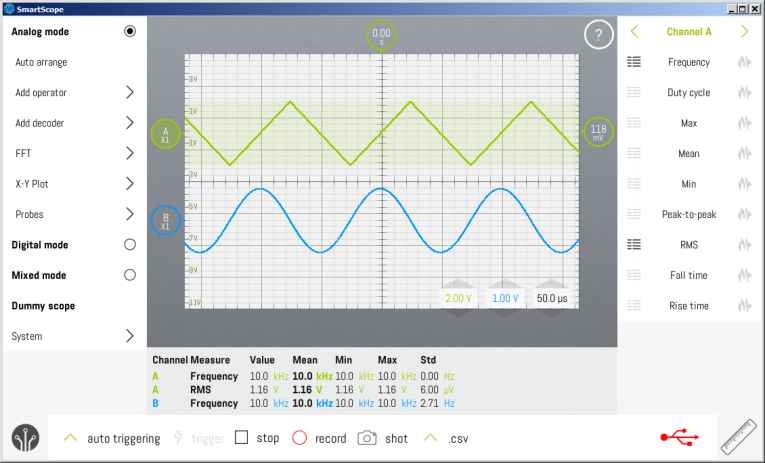
Wave traces for the two channels are shown in different colors, and you can slide them up or down, or hide a channel when it’s not needed. The voltage legends at left reflect whichever channel is currently highlighted, in this case green for Channel A. Clicking anywhere in the blue area changes the voltage values at left to those for Channel B (see Figure 2). The software also supports touchscreens and recognizes gestures, in addition to a mouse, on platforms that support touching.
One of the warnings I heard from USB nay-sayers on Facebook is that I’d be unhappy with the latency. That means when an input signal changes, or you modify an oscilloscope setting, the change won’t show on the screen for half a second or so. But with the default buffer setting of 512K samples, the SmartScope responds as quickly as any hardware model I’ve used. SmartScope calls this the Acquisition Depth, which is set in the System section at the bottom of the left pane. However, there’s enough sample memory to store up to 64 million samples for each channel. So when set to the maximum 64M size, there is some latency. But at that size you can freeze the display and zoom in afterward by a factor of 1,000 to see what happened leading up to an event in your analog or digital logic circuit that went by too quickly to view in real time.
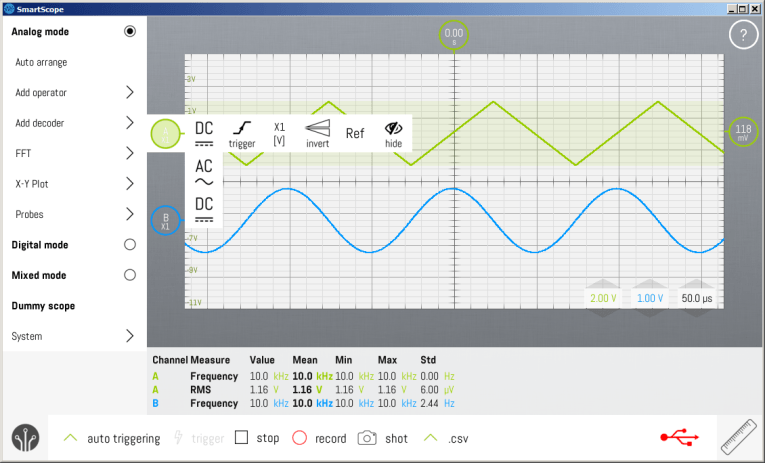
I don’t have a touchscreen, but the software works beautifully with a mouse. With the mouse cursor over the main part of the screen, or over the time per division value at the bottom right (50 μs as shown in Figure 3), the scroll wheel zooms the horizontal time scale between 200 ms and 10 ns. If you set the Acquisition Depth to the maximum 4M samples, the time can be set as slow as 2 seconds per division. And when you hover over either channel’s voltage scaling, the vertical sensitivity for that channel changes over a range from 5 V down to 20 mV per major division. I found setting these parameters with a mouse to be faster and easier than handling the physical knobs on a “real” oscilloscope.
The Features
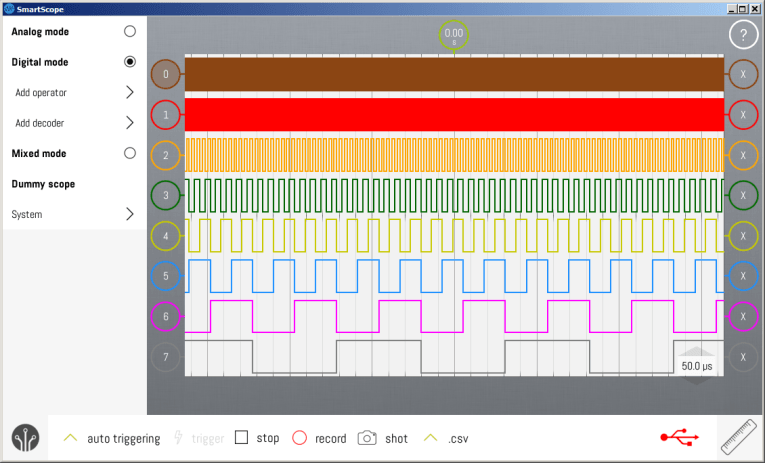
I have to admit I haven’t yet tried the logic analyzer shown in Figure 4 because my current project is purely analog. I didn’t try the digital generator either because I don’t have a suitable application, but I assume it works as the vendor claims. The analog signal generator shown in Figure 5 certainly works as advertised, with one small and possibly expected limitation: Unlike a typical analog hardware generator, you can’t vary the parameters in real time. Rather, you pick an output voltage, wave shape, and frequency, then click Upload, which sends the current settings to the output. If you change any of the parameters, the output doesn’t automatically follow; you need to click Upload again before the new values take effect.
The analog Signal Generator offers all of the common analog waveforms, plus some combinations, and lets you set the output voltage, a DC offset, and frequency. The digital generator allows various signals such as Counter and Pulse, plus user-defined signals at either the 3 VDC or 5 VDC standard digital output levels.
Conclusion
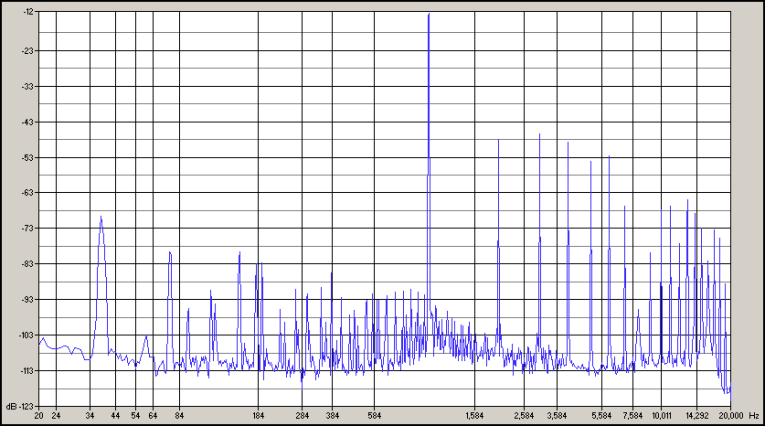
One limitation of the signal generator is its waveform accuracy, most noticeable with sine waves. As you can see in Figure 6, when set for 1 kHz at 1 V output, most of the lower-order distortion artifacts are only 35 dB below the fundamental frequency. Though at around 3% THD, it’s similar to inexpensive function generators. And it works perfectly well for basic testing such as frequency response.
There are a number of other useful SmartScope features including “operator math” that adds Channels 1 and 2 to show their combined voltage, or you can subtract one channel from the other to view their difference. You can also define your own probe values, and there’s a Mixed Mode that displays one analog channel along with the logic analyzer on the same screen. But most of these features are “icing on the cake” so to speak, and go beyond what anyone could reasonably expect in an oscilloscope that costs only a few hundred dollars! So I’m totally satisfied, and this petite device now has a permanent place on my desk. aX
Resources
LabNation: www.lab-nation.com
User Manual: http://wiki.lab-nation.com/index.php/Main_Page
About the Author
Ethan Winer has been an audio engineer and professional musician for more than 45 years. His “Cello Rondo” music video has received nearly 2 million views on YouTube and other websites, and his book The Audio Expert published by Focal Press, now in its second edition, is available at amazon.com and Ethan’s own website ethanwiner.com