As many of you will know I have been and remain active in Loudspeaker design, test and measurement so making and clearly communicating information about these is very important to myself and to many other people.
Loudspeaker performance can be complex and there is a requirement to ensure clear transfer of information about such characteristics.
One simple way of doing so is by using visual methods, one of the first permanent methods of recording such information was by recording pen traces on chart recorders.
From these we then have the first instances of graphing SPL responses.
With these early methods there was little room for alteration of the visual display as the recording speed was tied to the Frequency range, whilst the Amplitude or Range(s) were fixed by the instruments potentiometers settings.
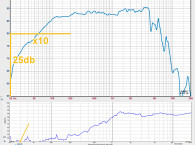
Originally the Standard that described best practice was known as IEC 263, the last major revision being IEC 60263:1980, this was based upon the chart recorders where 1dB corresponded to 1dB.
Everything changed with the proliferation of equipment and methods and especially with computer-based equipment as those links were broken, often for good reasons.
IEC 60263:2020 is the latest edition of this Standard which to this day continues to bring some much-needed order to a very confused situation.
This article is not the place to paraphrase the whole standard, however we will attempt to bring some much-needed clarity to a still very relevant problem.
The core idea was and still is that of defining the relationship between a decade of the frequencies being graphed and a decibel (dB) range. Thus, allowing rapid and accurate comparison of data between different measurements of loudspeakers.
With the proliferation of different electronic formats from PDF through screen grabs this has become an even greater problem today than in the past!
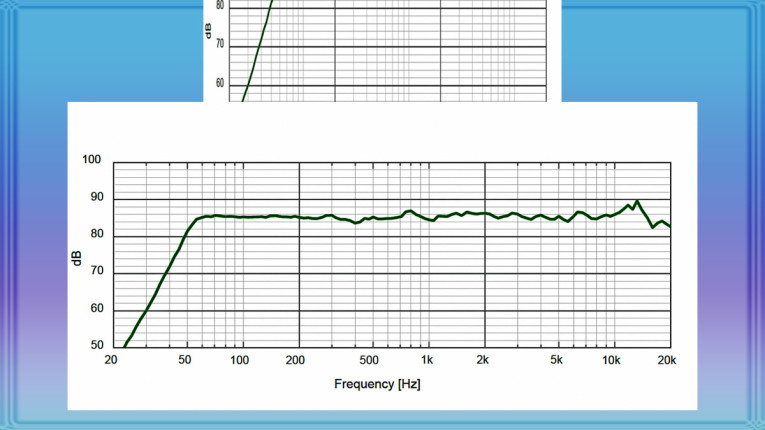
As can be seen in the following examples:
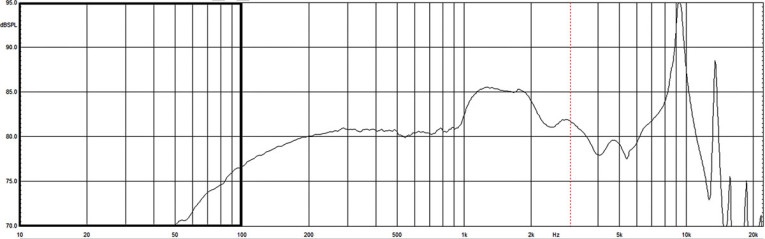
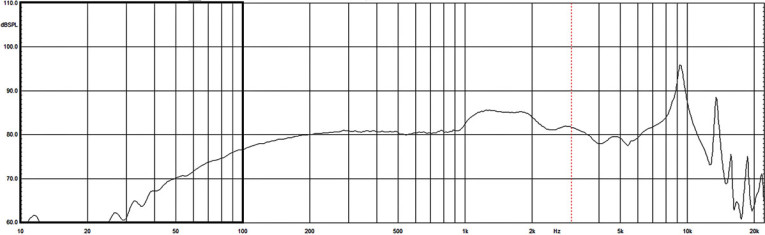
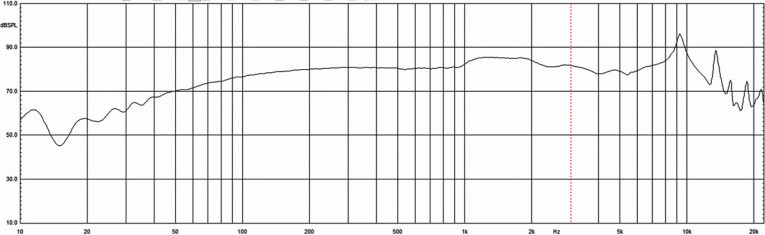
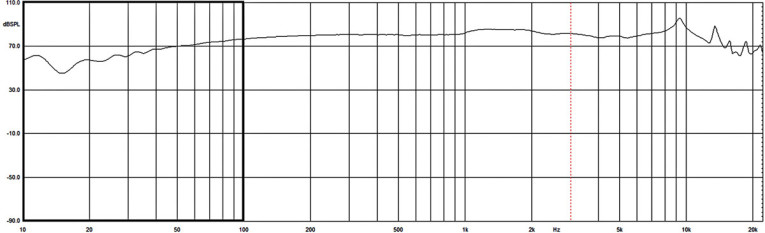
As you can clearly see these are visually very different although they have the exact same data. The difference is purely in the presentation so the figures basically show how you can you convert or transform into the IEC 60263 format.
The first thing is to decide the total Y axis or vertical range height you wish to display in dB or Logarithmic units. Take that vertical height and stretch or shrink as appropriate the X axis or Frequency range so that one decade of the frequencies say from 20Hz to 200Hz uses the same physical distance as the Y axis range!
And basically, that’s it! The full Standard goes into more detail of displaying linear units and polar plots so please get a copy and use it.
Also, may I make a plea to the manufacturers of test equipment - it’s obviously difficult to ensure that all screen displays meet this standard as often the user can dynamically adjust the aspect ratios.
Please at least have default settings available and accessible, as most do! But most importantly ensure that physical printouts can and do comply with IEC 60263:2020. aX
Reference
IEC 60263:2020 - Scales and sizes for plotting frequency characteristics and polar diagrams - English/French
IEC 60263:2020 specifies standard aspect ratios for logarithmic or level characteristics expressed in decibels versus a logarithmic frequency axis and ranges for the radius of polar diagrams of level. Applications include hard copy printouts, electronic files (e.g., PDF files), scientific publications, screen displays in computer programs and apps, as well as graphs in standards. IEC 60263:2020 cancels and replaces the third edition published in 1982. This edition constitutes a technical revision. This edition includes the following significant technical changes with respect to the previous edition:
a) the scope is expanded to include electronic files (e.g., PDF), scientific publications, graphs in other standards, and screen displays in programs and apps;
b) a Terms and Definitions clause has been added;
c) aspect ratios of 20dB/decade, and 0,5, 1, 1,25, and 2,5 decades/decade have been added;
d) ranges of 60dB or 30dB are specified for polar plots of absolute level; a 30dB range is specified for polar plots of relative level;
e) as most graphs are now computer generated, tolerances and sizes have been removed;
f) all informative figures have been updated with contemporary examples;
g) an informative annex with information about linear y-axis vs. logarithmic frequency has been added.
This article was originally published in The Audio Voice newsletter, (#455), February 1, 2024.