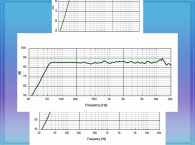
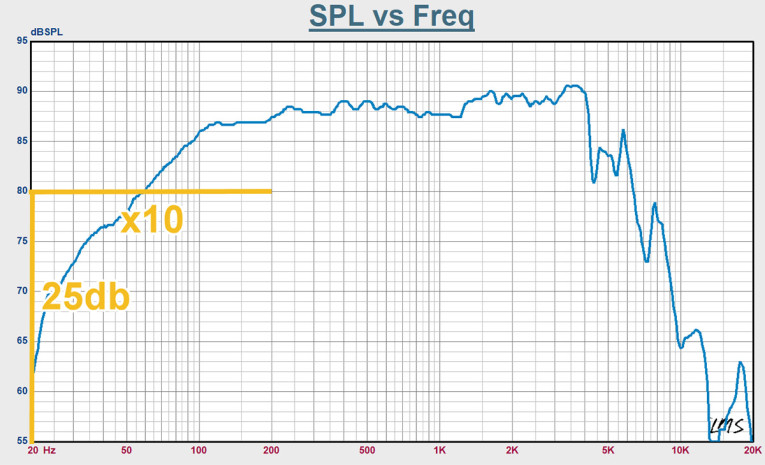
In 1982, the International Electrotechnical Commission (IEC) published “Scales and Sizes for Plotting Frequency Characteristics and Polar Diagrams (IEC-60263-1982).” The recommended scale for loudspeaker data presentation was 40dB with an aspect ratio of 25dB/decade of frequency.
Thus, the 25dB in the Y axis, should equal an X axis stretch of one decade... a square, as shown in Figure 1. This became the industry standard for presenting transducer SPL versus frequency data. Wherever this standard was applied, it was very easy to compare data from different manufacturers without having to count minor divisions on the vertical scale.
The late Chris Strahm, creator of the ubiquitous LMS hardware/software, was aware of this and made scaling the graph an easy task. At my request (and possibly others in the industry), he added graph presets to the software for easy recall of a saved 40dB IEC aspect graph set-up. He went a step further by adding the ability to digitize data from outside LMS for easy comparison on this level playing field, a utility that I still use today.
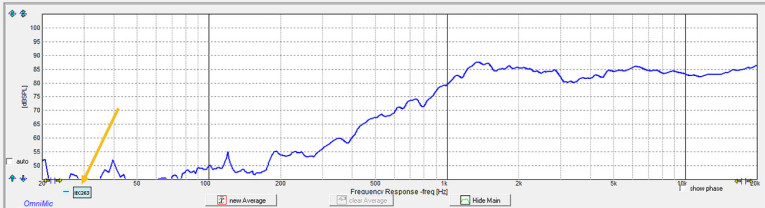
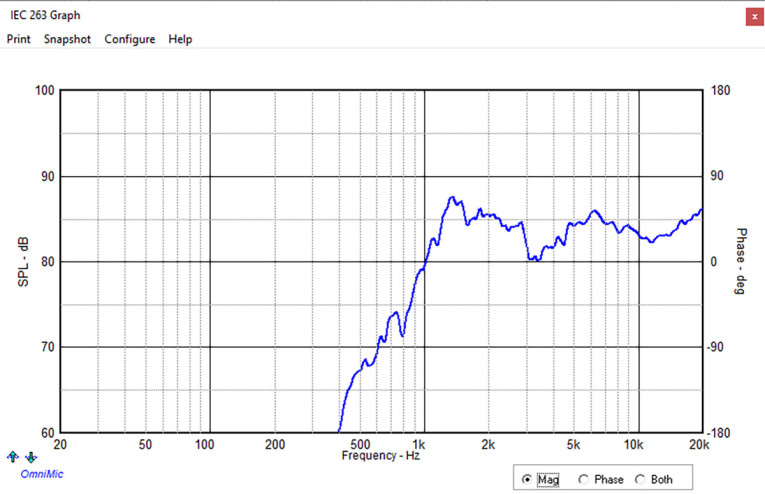
Other manufacturers of measurement systems have also provided the means to use this time-honored standard. Listen’s SoundCheck software offers easy definition of the aspect ratio in preferences, which can be saved as the default. Dayton Audio’s OmniMic will convert the active screen-based aspect ratio to IEC with a single mouse click (Figure 2 and Figure 3). This example shows just how dramatic the difference in presentation can be: We see two presentations of the exact same tweeter response that do not look like the same product.
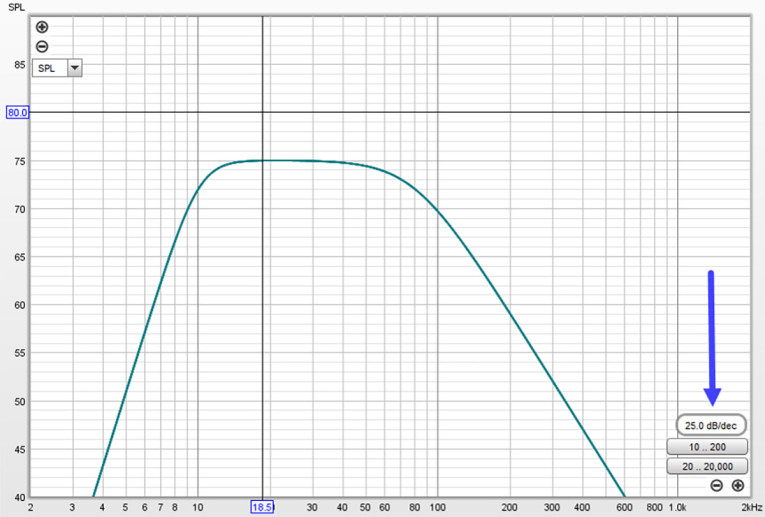
Fast forward to the present, REW, a much-used free sound card-based analyzer, has added the ability to adjust to the standard if desired. The optional aspect ratio window displays on the graph for easy adjustment (Figure 4).
The IEC updated the standard in 2020 (IEC-60263-2020) with added presentation guidelines for measurement of other devices:
• Microphone calibration, and noise from mobile device = 10dB/decade
• Cross-over filter network, and amplifier noise = 20dB/decade
• Hearing aid response, Speaker THD = 50dB/decade
• Ranges are specified for absolute and relative polar plot data are included as well.
I suspect that over the 40+ years since the IEC publication, many engineers and test system developers may have forgotten or were never exposed to this proposed standard. It may not be as practical (nor as important) to apply to end-of-line test systems. But for publishing of marketing data and design of transducers and systems, it would be ideal if all eyes were looking at the same presentation for easy data comparison. VC
This article was originally published in Voice Coil, April 2024