
Beyma has been on the forefront of pro sound AMTs and produces a seven-model lineup of high power handling, high efficiency AMTs for pro sound applications. Part of the success of Beyma’s AMTs for pro sound comes from its proprietary X-Bow technology. The concept behind X-Bow Technology is to open as much as possible the mechanical constraint in the diaphragm, allowing it to manage higher temperatures, increasing the limit of the power the diaphragm can handle.
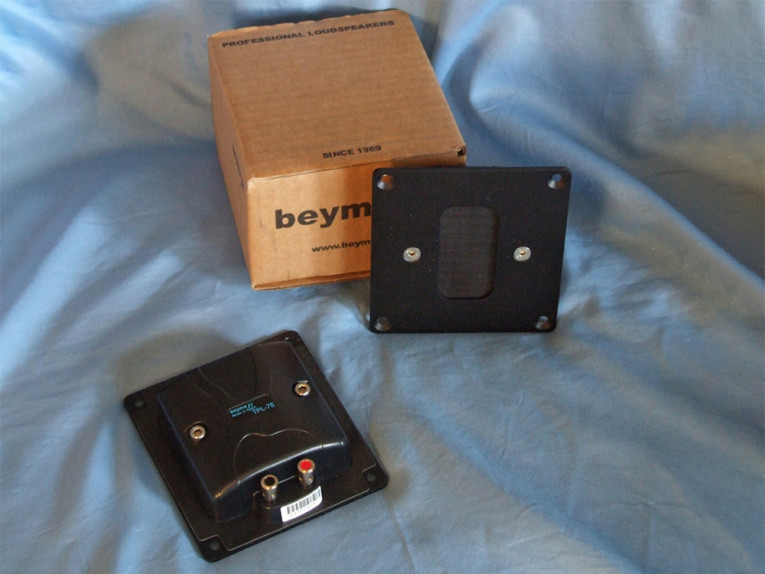
In terms of features, the Beyma TPL75 has an AMT Kapton diaphragm radiating area of 71 mm × 34 mm (see Photo 1); an aluminum faceplate, 92 dB 1 W/1 m sensitivity, and 40 W AES-rated power handling with a second-order crossover at 1.2 kHz.
Other features include a neodymium magnet motor, 8 Ω nominal impedance (4.9 Ω DCR, and chrome-plated color-coded push terminals. Intended applications are high-end home audio speakers as well has high-end studio monitors.
I used the LinearX LMS analyzer to produce the 300-point stepped sine wave impedance plot shown in Figure 1. As with most AMTs, the TPL75 really has no definable resonance and is nearly a constant load across the bandwidth. With a measured 5.64 Ω DCR (Re), the minimum impedance of the TPL75 above 1 kHz was the about same as the DCR, 5.42 Ω. For the next set of SPL measurements, I mounted the TPL75 in an enclosure with a 15” × 7” area. Since the AMT diaphragm is asymmetrical, and will have increased directivity in the vertical plane, I used the LMS gated sine wave analyzer to measure both the horizontal and the vertical SPL at 2.83 V/1 m from 0° to 45°.
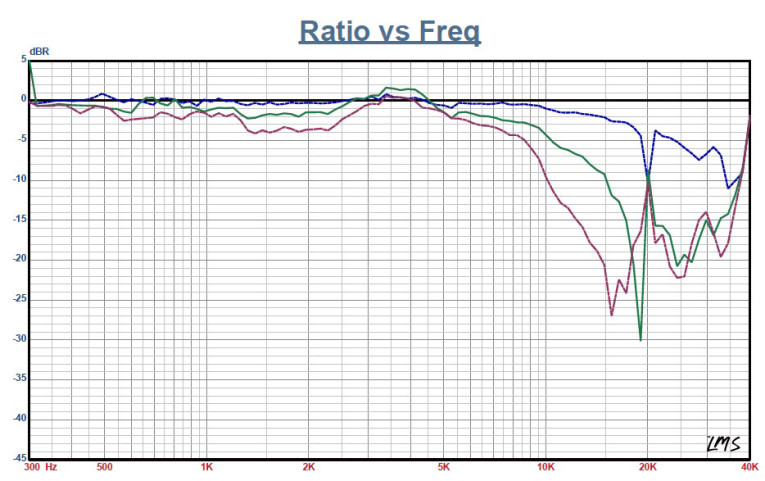


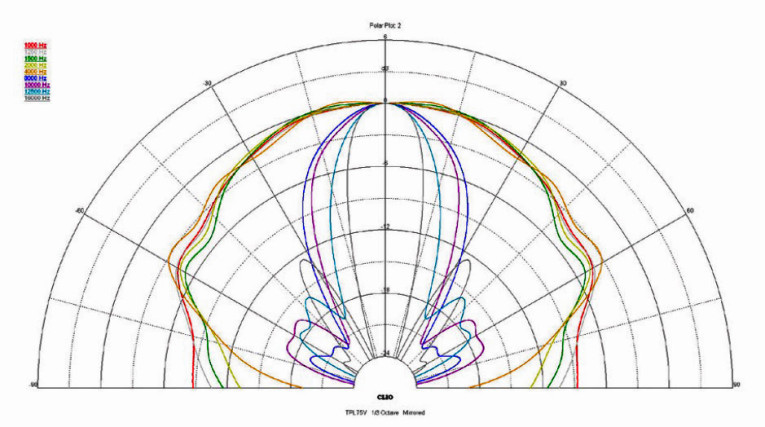
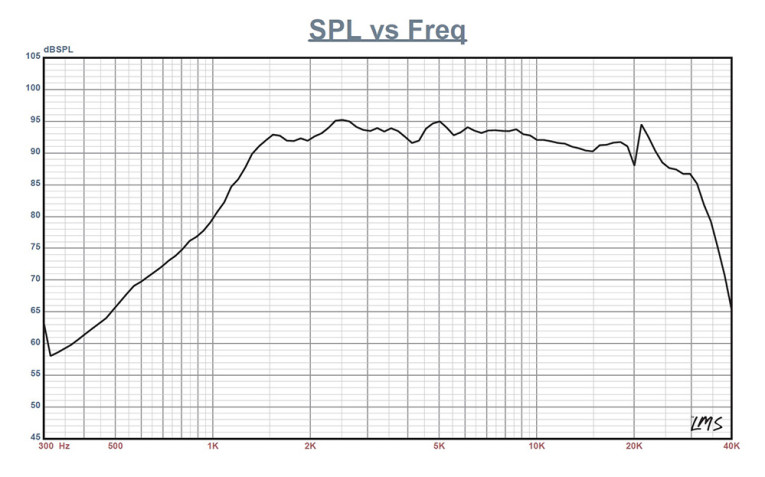
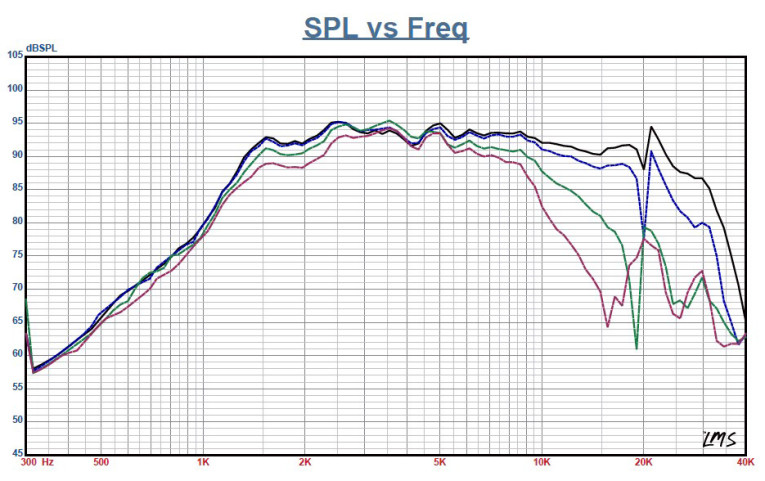
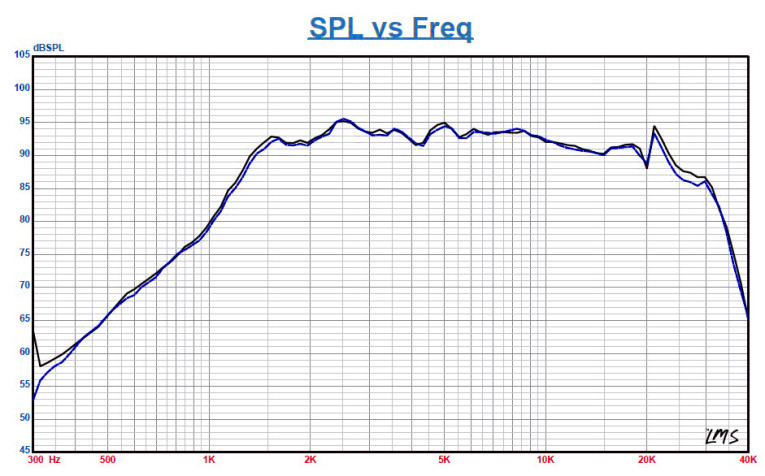
Figure 2 illustrates the TPL75’s on-axis frequency response, which is smooth with no major anomalies. The device measures ±1.8 dB from 1.5 kHz to 11.6 kHz, which is good enough to clearly put this AMT into high-end two-channel or high-end studio monitor territory! Figure 3 depicts the on- and off-axis response in the horizontal plane. Figure 4 displays the normalized horizontal plane response. Figure 5 shows the CLIO Pocket analyzer-generated 180° horizontal polar plot (in 10° increments with 1/3 octave smoothing applied). Figure 6 gives the on- and off-axis to 60° response in the vertical plane, while Figure 7 depicts the normalized vertical plane response. Figure 8 shows the CLIO Pocket-generated vertical plane polar plot (in 10° increments with 1/3 octave smoothing applied). Last, Figure 9 illustrates the two-sample SPL comparison showing the two TPL75 AMT driver samples to be very closely matched within less than 0.5 dB throughout the TPL75’s operating range.
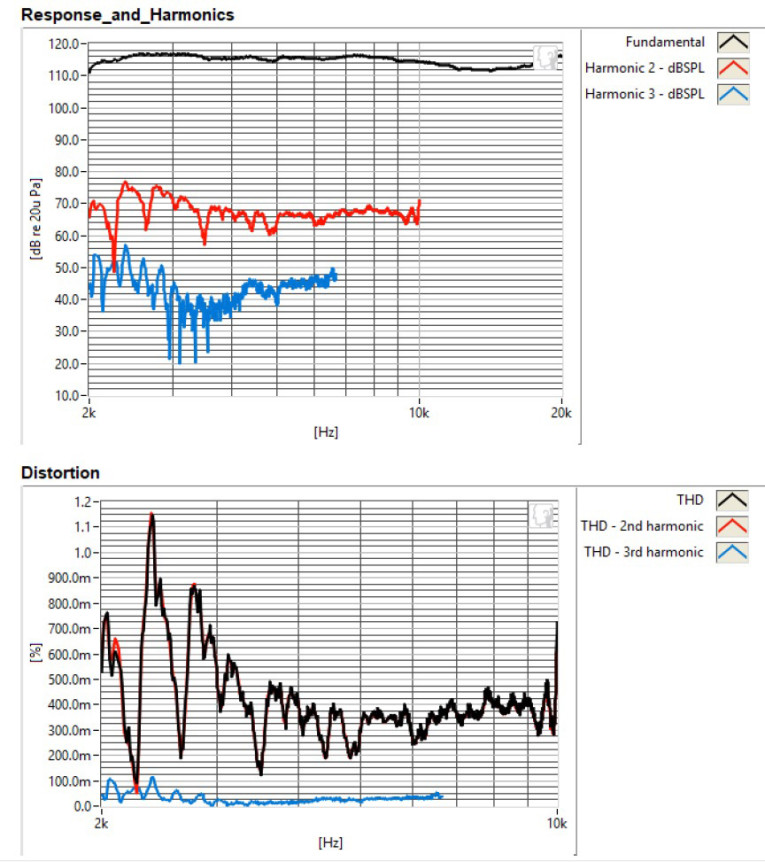
For the remaining tests, I again set up the Listen AudioConnect analyzer, the SoundCheck 16 software, and the Listen ¼” SCM microphone to measure distortion and generate time-frequency plots (all courtesy of Listen, Inc.). For the distortion measurement, I mounted the TPL75 in the same enclosure that was used for the frequency response measurements, and set the SPL to 94 dB at 1 m (4.17 V determined by using a pink noise stimulus generator and the internal SLM in the SoundCheck 16 software). I measured the distortion with the Listen ¼” measurement microphone located 10 cm from the center of the AMT diaphragm. This produced the distortion curves shown in Figure 10 (red curve = second harmonic, blue curve = third harmonic).
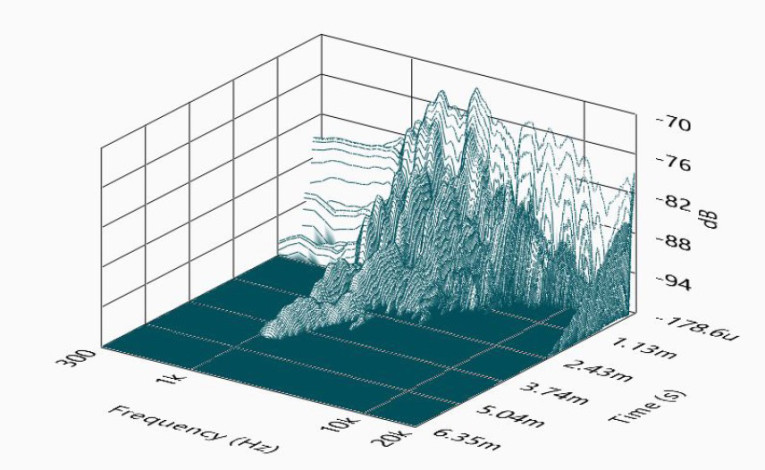
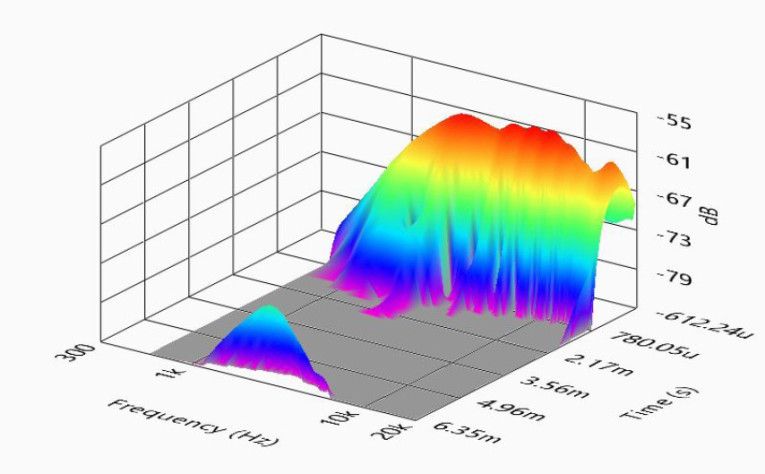
Following this test sequence, I set up SoundCheck 16 to generate a 2.83 V/1 m impulse response and imported the data into Listen’s SoundMap Time/Frequency software. Figure 11 shows the resulting CSD waterfall plot. Figure 12 shows the Short Time Fourier Transform (STFT) plot.
Looking at all the collected objective data on the Beyma TPL75, this AMT driver incorporates an excellent SPL profile along with the power handing required of high SPL applications in either home audio or studio monitor applications, plus the unique sound of Oskar Heil’s original invention, which is well known for its excellent midrange detail.
For more information, contact Acustica Beyma, S.L., www.beyma.com. VC
This article was originally published in Voice Coil, August 2018.