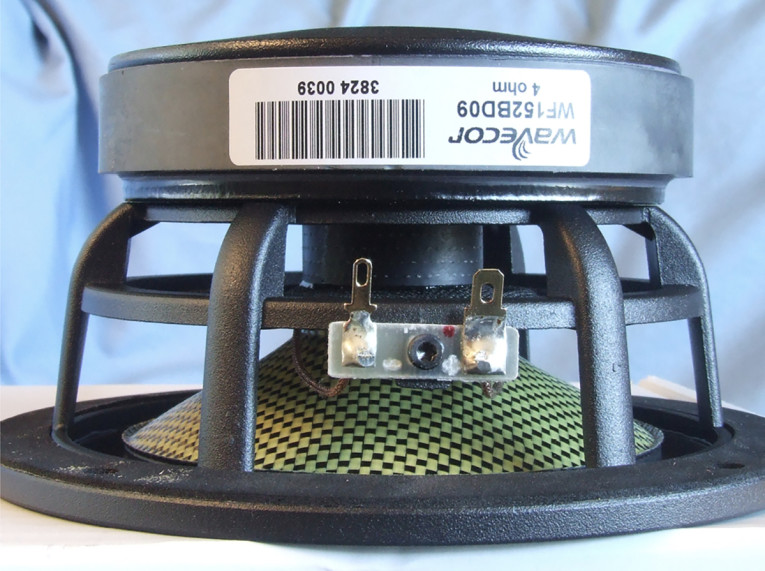
The April 2023 issue of Voice Coil featured the new TW045WA01 ceramic aluminum/cloth dome tweeter as part of its release of a new line of high-end OEM transducers. The other part was a new line of midbass drivers that utilized a unique proprietary interwoven Kevlar/Carbon fibers cone material (Photo 2). Wavecor developed this cone material as a new reference with a combination of low mass, rigidness, and damping — highly beneficial properties for midrange reproduction. The 7” version, the WF182BD13, was featured in Voice Coil August 2023.
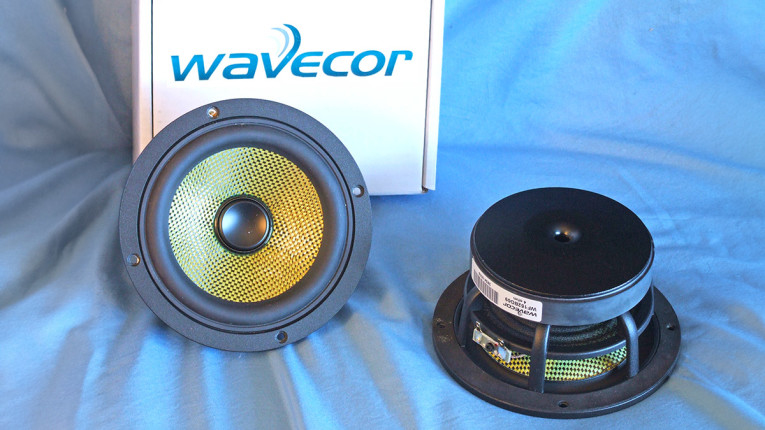
Other features, besides the new carbon fiber/Kevlar cone material, include a vented inverted dome-type phase plug (no dust cap), which I admit, I have not previously encountered. For compliance, the WF152BD09 has a shallow profile low loss high Qm NBR surround, accompanied by a flat 4” diameter black cloth spider.
All this is driven by a 32mm (1.25”) diameter two-layer voice coil wound with round copper wire on a black fiber glass non-conducting former. The Wavecor Balanced Driver T-pole motor system powering the cone assembly utilizes a 17mm thick 109mm diameter ferrite magnet sandwiched between a black emissive coated 5mm thick front plate and a black emissive coated and shaped T-yoke that incorporates a flared 8mm diameter pole vent for additional cooling. The WF152BD09 further incorporates a set of dual shorting rings (a copper pole cap and an aluminum ring at the base of the pole) that reduce distortion caused by eddy currents. Last the braided voice coil lead wires terminate to a pair of gold-plated solderable terminals.
The 15V curves were too nonlinear to get a sufficient curve fit and were discarded. The remaining 10 stepped sine wave sweeps for each woofer were further processed with the voltage curves divided by the current curves to produce impedance curves. Phase curves were generated using the LEAP phase calculation routine, after which the impedance magnitude and phase curves plus the associated voltage curves were then copy/pasted into the LEAP 5 Enclosure Shop software’s Guide Curve library.
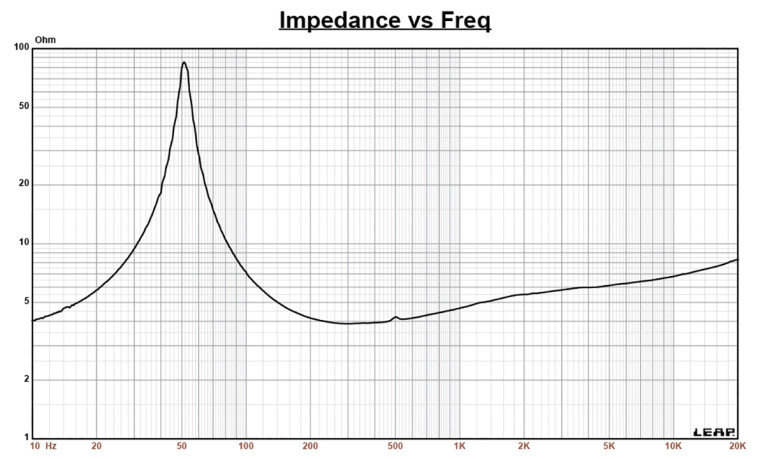
This data was used to calculate parameters in the LEAP 5 LTD transducer model. Because most manufacturing data is produced using either a standard transducer model or in many cases the LEAP 4 TSL model, I also generated LEAP 4 TSL model parameters using the 1V free air that can also be compared with the manufacturer’s data. Figure 1 shows the WF152BD09 1V free-air impedance plot. Table 1 compares the LEAP 5 LTD and LEAP 4 TSL Thiele-Small (T-S) parameter sets for the Wavecor WF152BD09 midbass driver samples along with the Wavecor factory data.
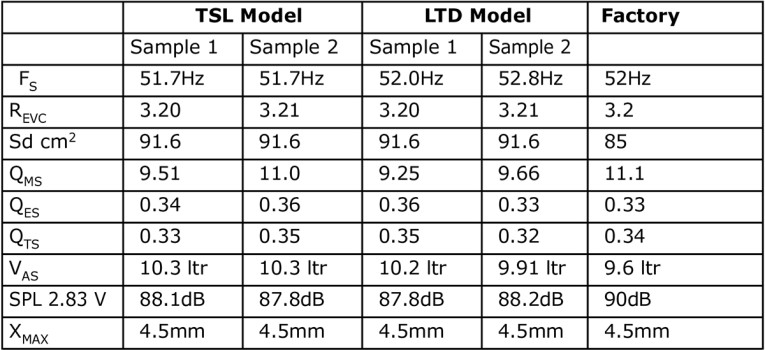
From the comparative data shown in Table 1, you can see that all four parameter sets for the two samples were reasonably similar and correlated rather well with the factory data. The only variant was sensitivity and happens because mine is a result of TSP calculations, while Wavecor averages measured SPL from 300Hz to 1kHz at 2.83V/1m.
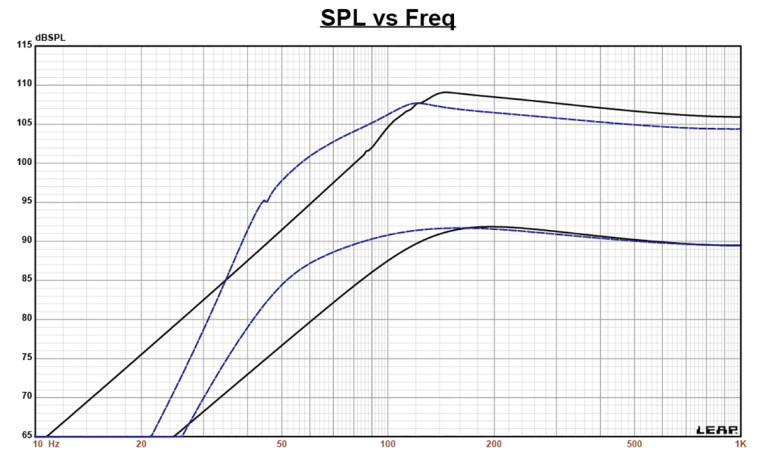
Following my normal protocol, I used the sample 1 LEAP 5 LTD parameters and set up two computer box simulations—one in a 154in3 Butterworth-type sealed enclosure (Qtc=0.7) with 50% fill material (fiberglass) and the second simulation in a vented Extended Bass Shelf (EBS) alignment in a 421in3 box with 15% fill material and tuned to 53Hz. This is a fairly low tuning for this size enclosure, so using one of Wavecor’s passive radiators would actually be a better choice than a port tube or slot-type vent.
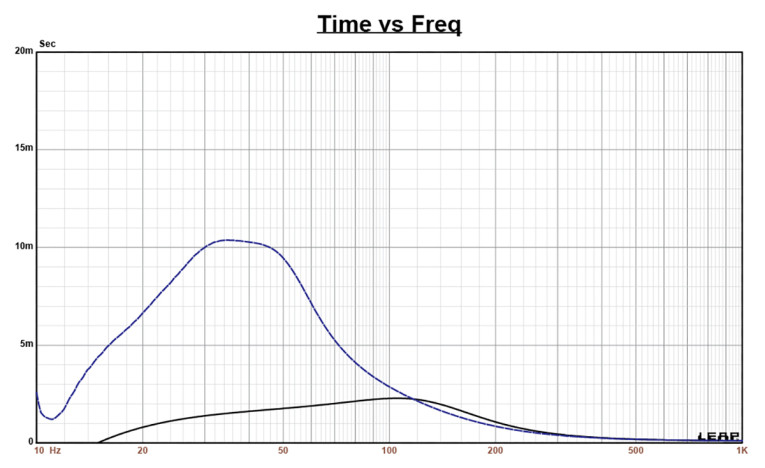
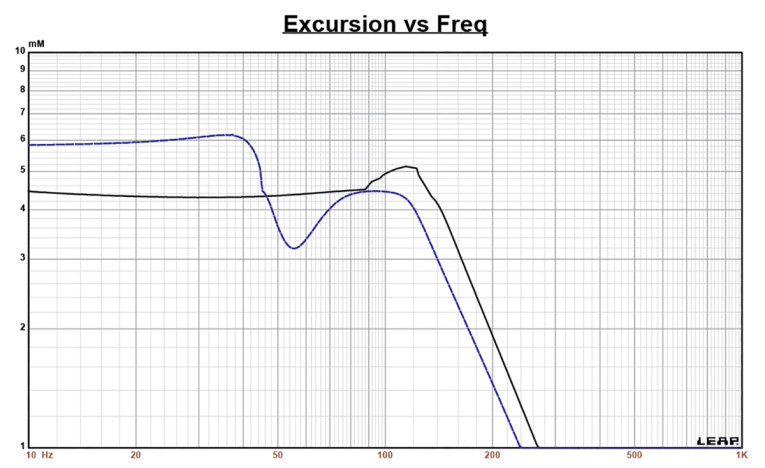
Figure 2 gives the enclosure simulation results for the WF152BD09 midbass driver in the sealed and vented enclosures at 2.83V and at a voltage level sufficiently high enough to increase cone excursion to Xmax+15% (5.2mm for WF152BD09). This resulted in a F3 of 111Hz (-6dB=69Hz) with a Qtc=0.68 for the 154in3 closed box and a -3dB for the vented simulation of 70Hz (-6dB=53Hz). Increasing the voltage input to the simulations until the approximate Xmax+15% maximum linear cone excursion point was reached resulted in 109dB at 21V for the sealed enclosure simulation and 108dB with a 17V input level for the larger vented box. Figure 3 shows the 2.83V group delay curves. Figure 4 shows the 21V/17V excursion curves.
This month the Klippel analysis for the Wavecor 6” midbass woofer was performed by Jason Cochrane at Warkwyn, using the Klippel KA3 analyzer, and produced the Klippel data graphs given in Figures 5-8. Please note, if you do not own a Klippel analyzer and would like to generate this type of data on any transducer, Warkwyn is available to perform a myriad of measurement and design consulting services.
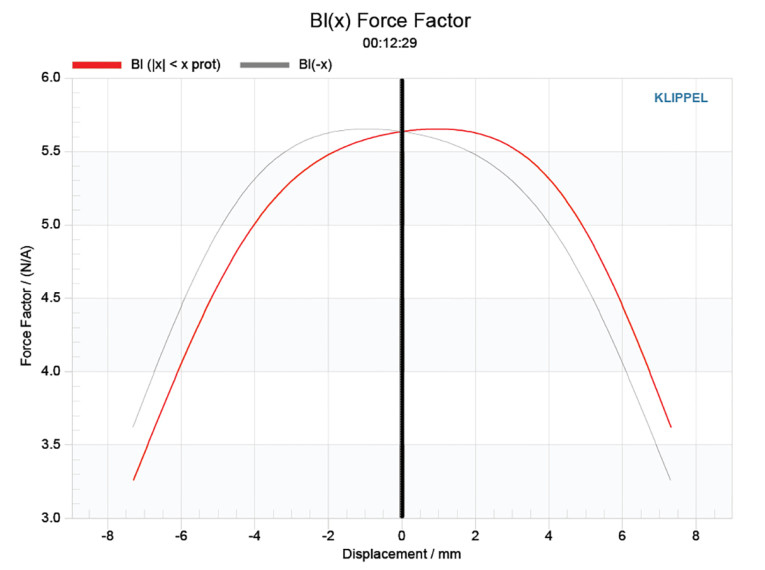
The Bl(X) curve for WF152BD09 shown in Figure 5 is moderately broad and symmetrical typical of a 5.25” to 6” woofer, and with a small amount of offset and tilt. Looking at the Bl symmetry curve (Figure 6) shows a negligible 0.49mm Bl coil-out (forward) offset once you reach an area of reasonable certainty around 4mm, decreasing to 0.37mm at the physical 5.5mm Xmax, so relatively minor.
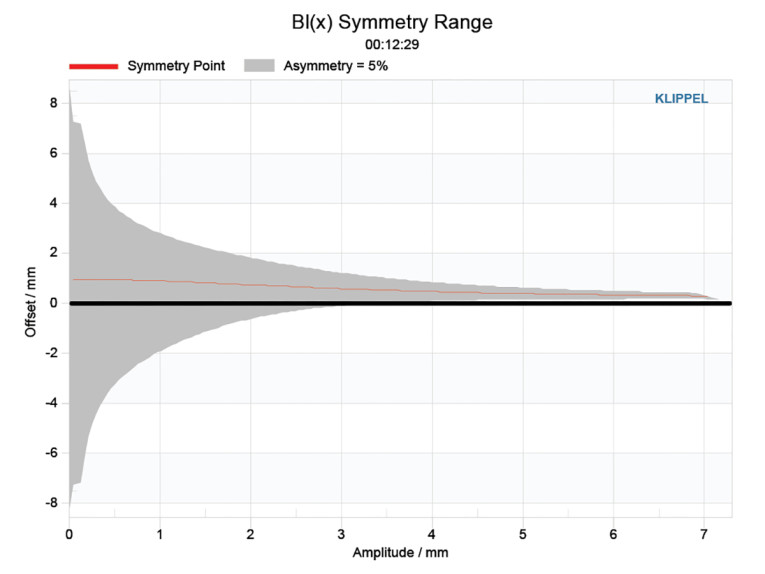
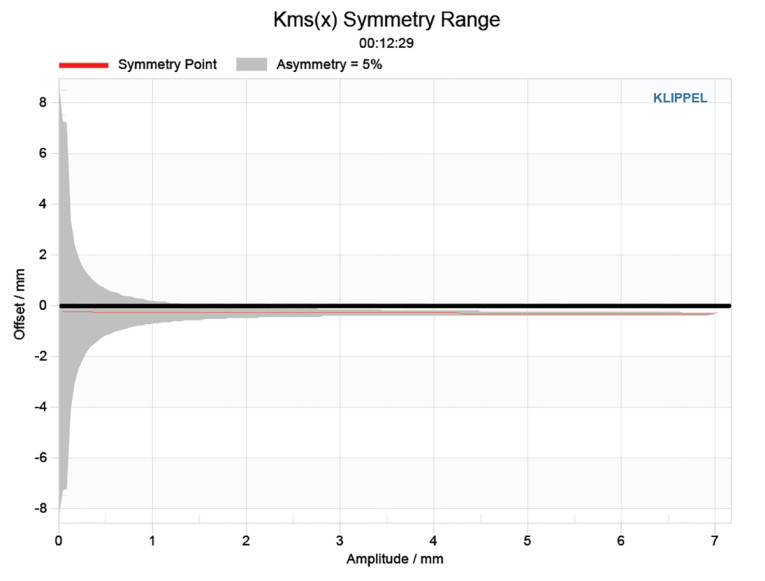
Figure 7 and Figure 8 show the Kms(X) and Kms symmetry curves. As with the Bl curve, the Kms stiffness of compliance curve (Figure 7) is very symmetrical, with only some minor offset. The Kms symmetry range curve (Figure 8) likewise indicates a negligible 0.26mm coil-out (forward) offset once you reach an area of reasonable certainty around 2mm, staying mostly constant at 0.26mm at the physical 5.5mm Xmax.
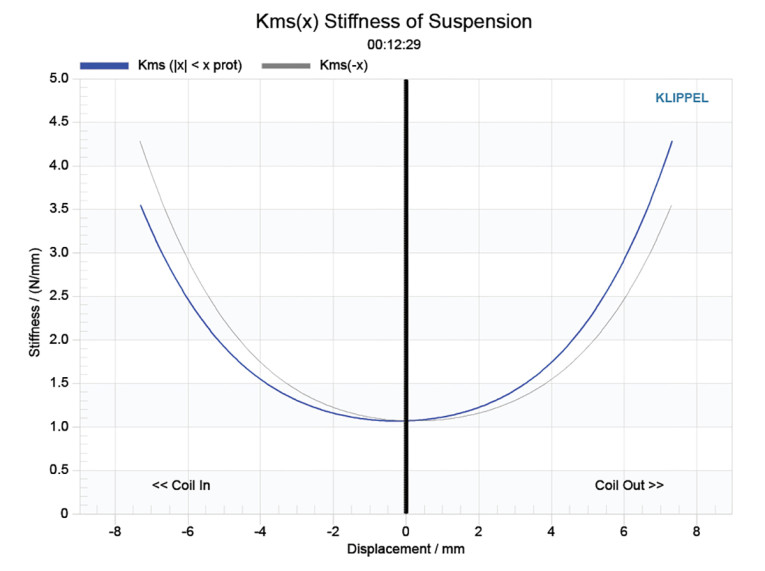
Displacement limiting numbers calculated by the Klippel analyzer for Bl was XBl @ 82% (Bl dropping to 82% of its maximum value) equal to 4.94mm for the prescribed 10% distortion level (the criterion for full range drivers). For the compliance, XC at 75% Cms minimum was 3.02mm, which means that for the WF152BD09 driver, the compliance is the more limiting factor for getting to the 10% distortion level. If we use the more conservative 20% distortion criteria, which several practitioners I know think is appropriate for midbass drivers as well as subwoofers, then the displacement limit numbers are XBl=6.20mm and XC=4.87 — both numbers greater than the physical Xmax of the WF152BD09.
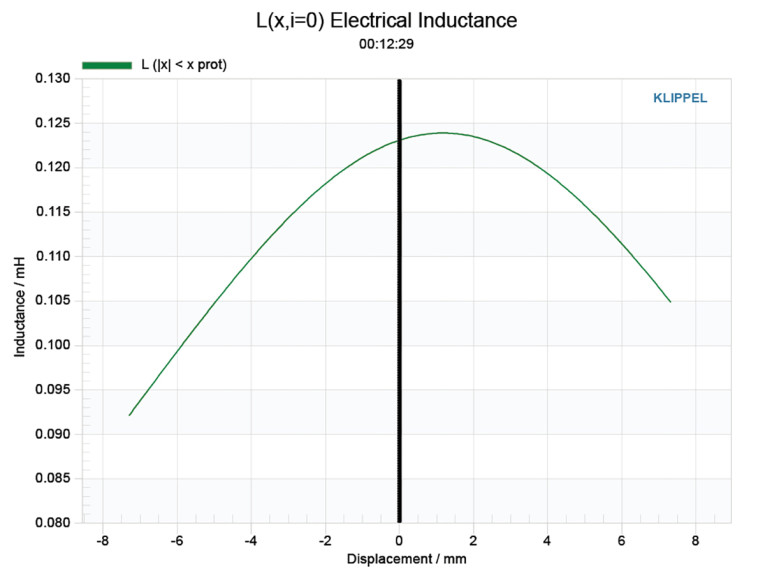
Figure 9 gives the inductance curve Le(X). Motor inductance will typically increase in the rear direction from the zero-rest position as the voice coil covers more of pole, however that doesn’t happen here because of the dual shorting ring configuration. What we do get is lower inductance variation from full in to full out travel, which is the goal you want to achieve. It’s easy to see the benefit of the dual shorting rings with inductance only varying about 0.016mH to 0.006mH from Xmax in to Xmax out, which is very minimal inductance change and indicates excellent inductive performance.
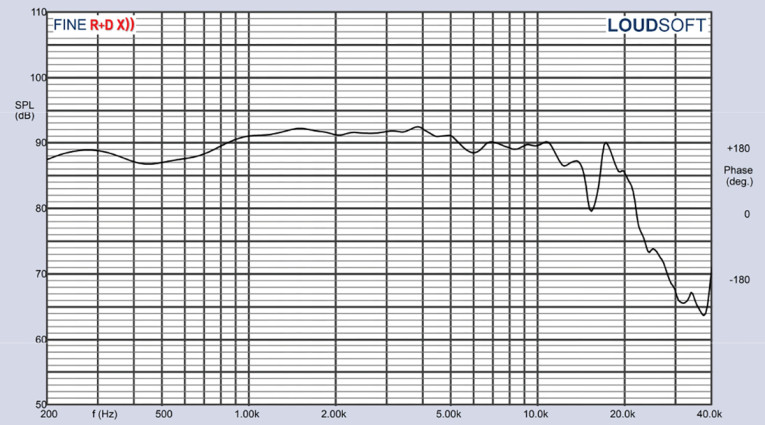
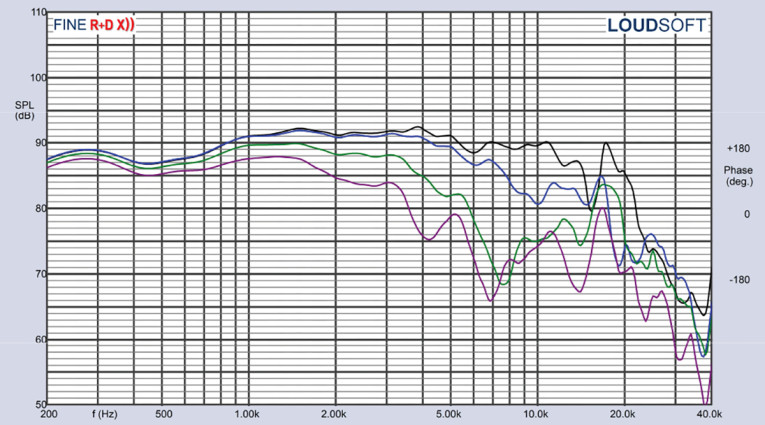
With the Klippel testing completed, I mounted the WF152BD09 woofer in a foam-filled enclosure that had a 15”×6” baffle and measured the device under test (DUT) using the Loudsoft FINE R+D analyzer and the GRAS 46BE microphone (courtesy of Loudsoft and GRAS Sound & Vibration) both on- and off-axis from 200Hz to 20kHz at 2V/0.5m, normalized to 2.83V/1m using the cosine windowed FFT method. Figure 10 gives the WF152BD09’s on-axis response indicating a smooth ±2.5 rising response from 500Hz to 12kHz.
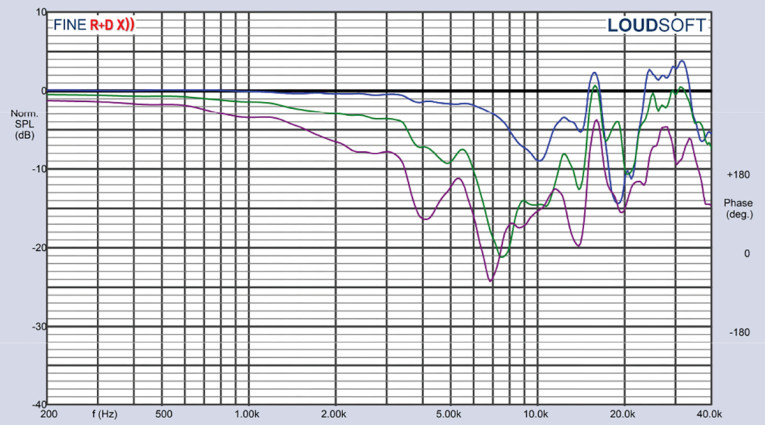
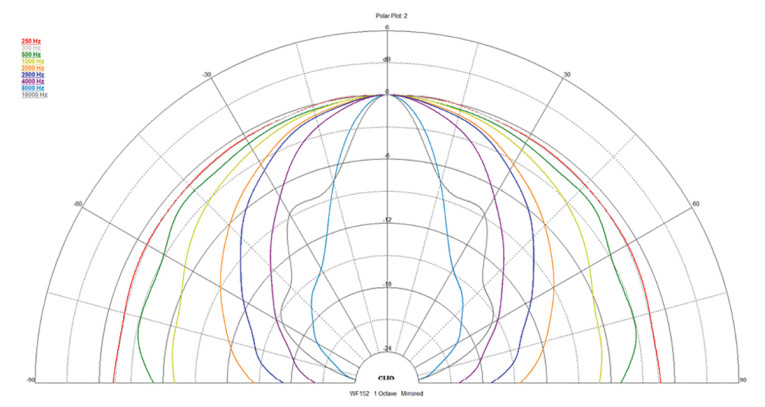
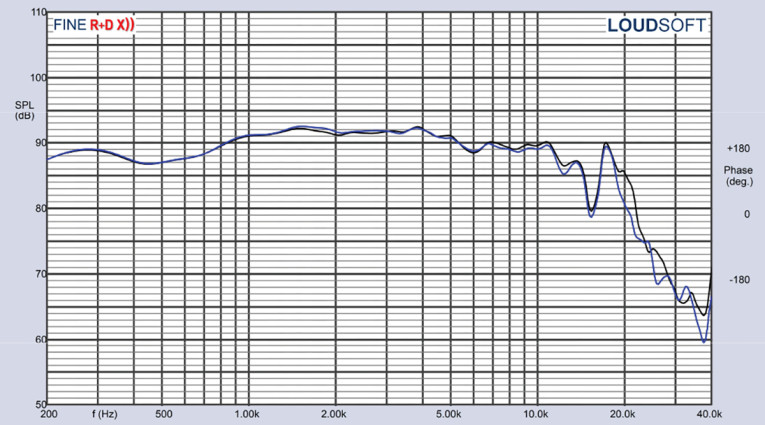
Figure 11 displays the on- and off-axis frequency response at 0°, 15°, 30°, and 45°, showing the typical directivity for a 5.25” to 6” woofer. The -3dB at 30° with respect to the on-axis curve occurs at about 2.8kHz, so is a reasonable frequency for a low-pass crossover. The normalized version of Figure 11 is given in Figure 12. The CLIO polar plot (in 10° increments and 1/3 octave smoothing) is shown in Figure 13. And finally, Figure 14 displays the two-sample SPL comparisons for the 6” Wavecor driver, showing a very close match ≤ 0.2dB throughout the operating range.
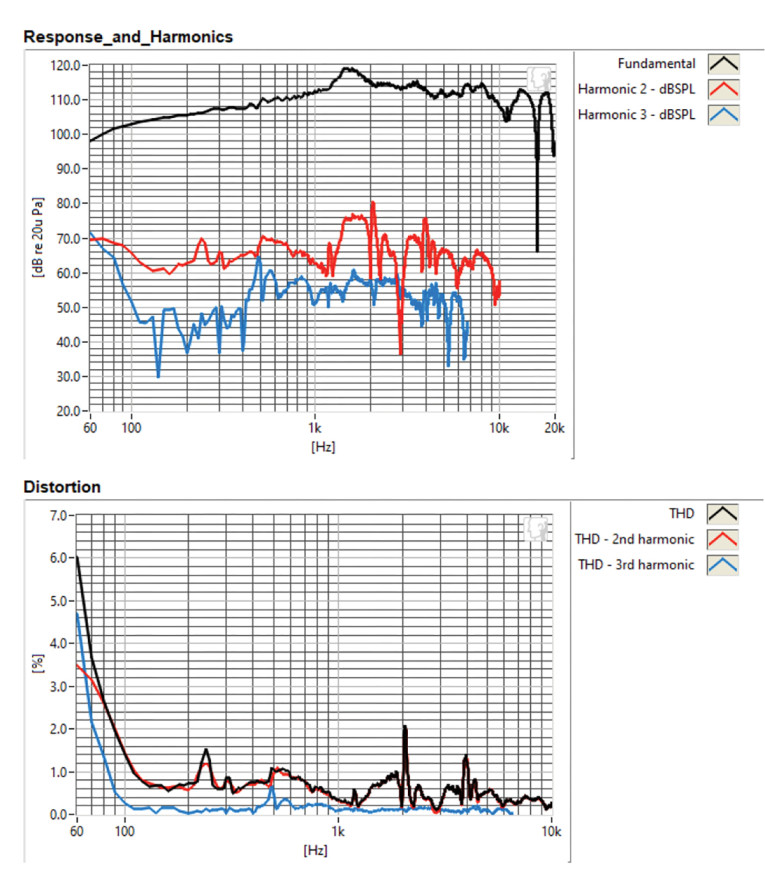
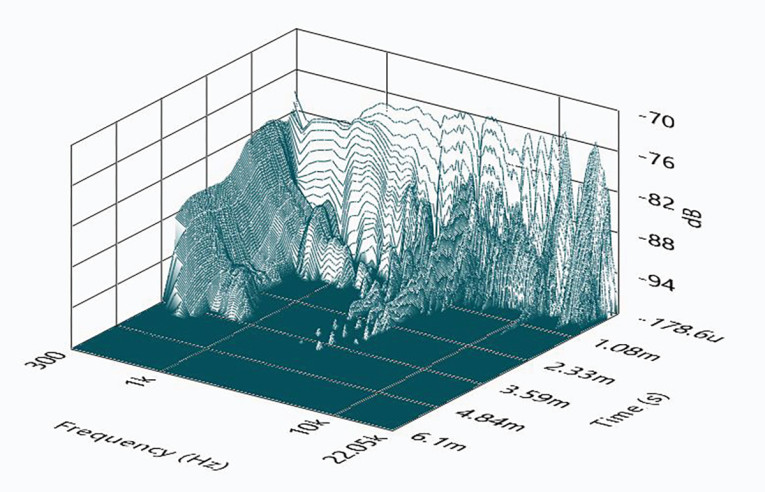
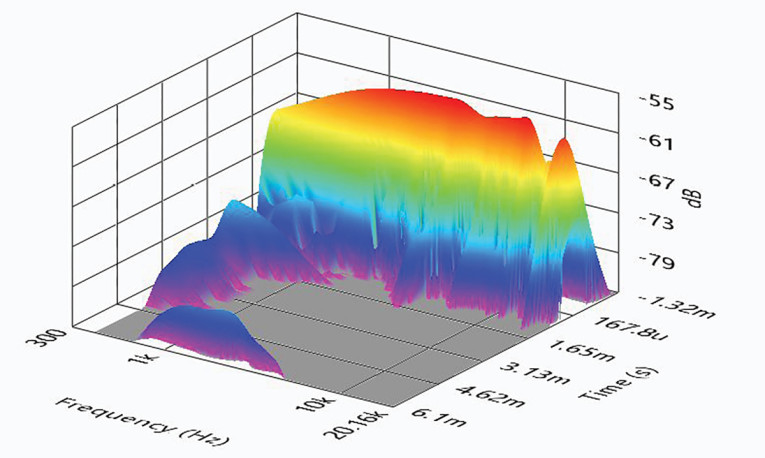
For the last remaining series of tests, I initialized the Listen, Inc. SoundCheck AudioConnect analyzer and the SCM ¼” microphone to measure distortion and generate time-frequency plots. For the distortion measurement, I mounted the 6” WF152BD09 driver rigidly in free air and set the SPL to 94dB at 1m (4.13V) using a pink noise stimulus. I then measured the distortion with the Listen microphone placed 10cm from the driver. This produced the distortion curves shown in Figure 15, with third-harmonic distortion staying primarily between 0.2% to 0.4% from 100Hz to 6.2kHz. I then used SoundCheck to get a 2.83V/1m impulse response for this driver and imported the data into Listen’s SoundMap Time/Frequency software. Figure 16 shows the resulting cumulative spectral decay (CSD) waterfall plot. Figure 17 shows the Wigner-Ville plot (chosen for its better low-frequency performance).
After reviewing the collected data, and considering that this represents the introduction of a completely new carbon fiber/Kevlar cone type, plus the consistently good performance exhibited by Wavecor’s woofers, midranges, and tweeters, the WF152BD09, like the WF182BD13 7” version, appears to be an excellent addition to Wavecor’s catalog of woofers.
The Wavecor drivers characterized in Test Bench are from Wavecor’s catalog line, however the company also does custom OEM drivers as well, whether you start with a blank page or modify something from its catalog line. For more information, visit www.wavecor.com. VC
This article was originally published in Voice Coil, November 2023.