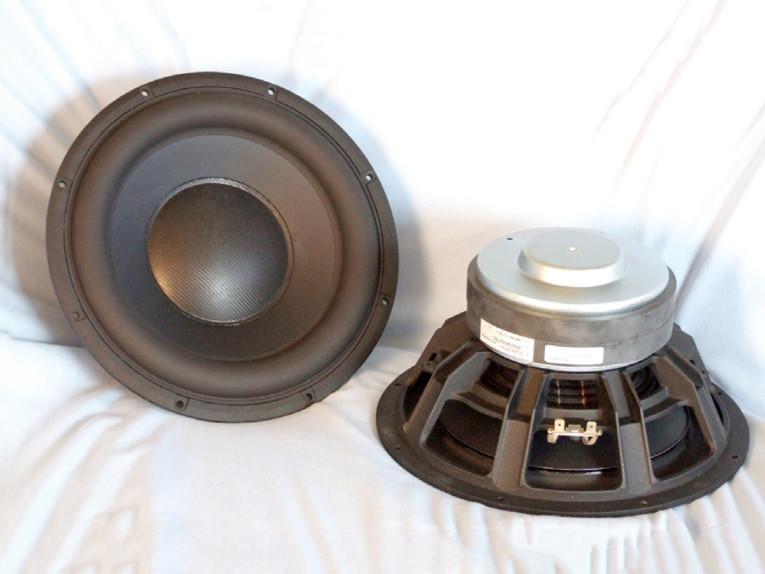
Providing compliance for this woofer is a fairly wide (30mm) black NBR surround and a black 6" diameter flat Nomex spider. It also includes flat Litz wire sewn into the spider and terminates to a pair of gold-plated terminals. While not connected to a terminal (this is a single voice coil subwoofer), there is another pair of Litz wires sewn into the opposite side of the spider. The motor system for the 26W is composed of a stacked pair of 147mm diameter and 18mm thick ferrite magnets. These are sandwiched between an 8mm front plate and a 9mm back plate with a 10mm bump out.
I commenced testing the Scan-Speak 10" 26W subwoofer using the LinearX LMS analyzer and VIBox to produce both voltage and admittance (current) curves with the driver clamped to a rigid test fixture in free-air at 1V, 3V, 6V, 10V, 15V, and 20V. The twelve 550-point stepped sine wave sweeps for each 26W sample were post-processed and the voltage curves divided by the current curves (admittance) to produce impedance curves, phase added using LMS calculation method, and, along with the accompanying voltage curves, uploaded to the LEAP 5 Enclosure Shop software.
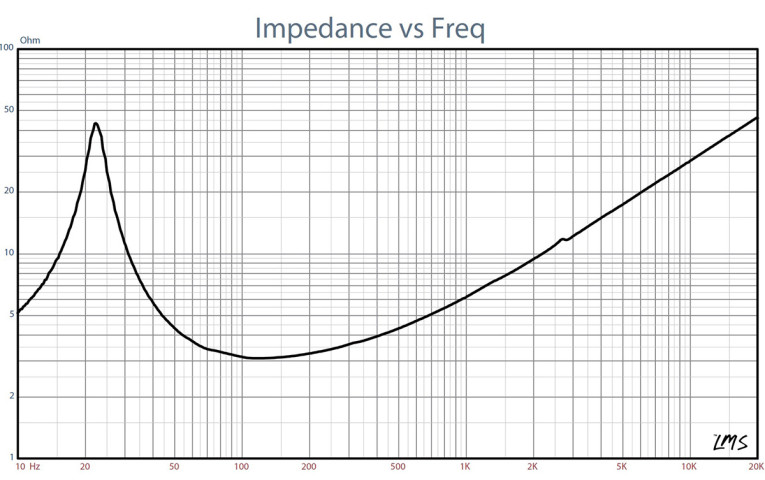
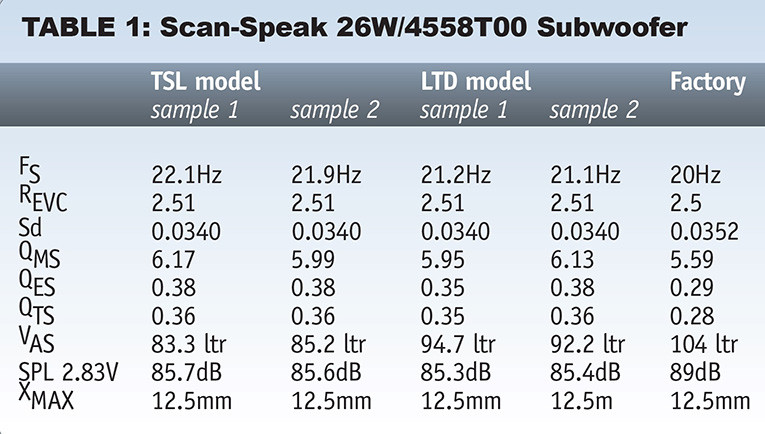
Besides the LEAP 5 LTD model results, I additionally produced a LEAP 4 TSL model set of parameters using just the 1V free-air curves. The final data, which includes the multiple voltage impedance curves for the LTD model (see Fig. 1 for the 1V free-air impedance curve) and the 1V impedance curve for the TSL model, were selected and the parameters created in order to perform the computer box simulations. Table 1 compares the LEAP 5 LTD and TSL data and factory parameters for both 26W samples.
LEAP parameter calculation results for the 26W were reasonably close to the factory data, although my data showed a lower sensitivity. Following my usual protocol, I proceeded setting up computer enclosure simulations using the LEAP LTD parameters for Sample 1. I set up two box simulations, one sealed and one vented. For the closed box simulation I used a 1.0ft3 enclosure with 50% fiberglass fill material, and for the vented box, a 1.7ft3 QB3 type vented alignment with 15% fiberglass fill material and tuned to 24Hz.
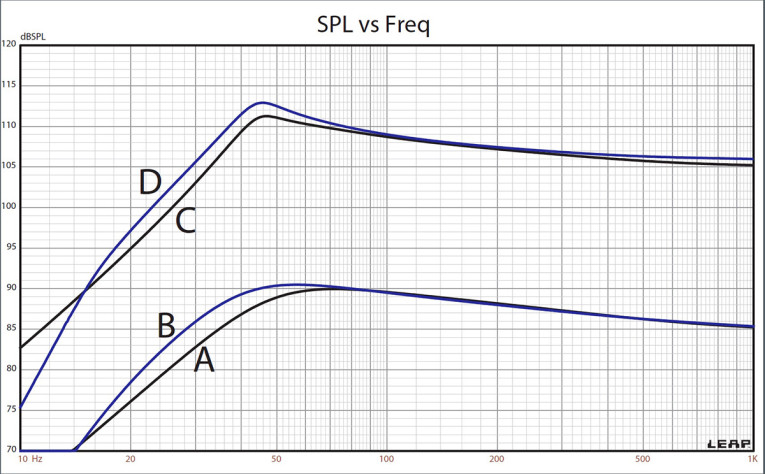
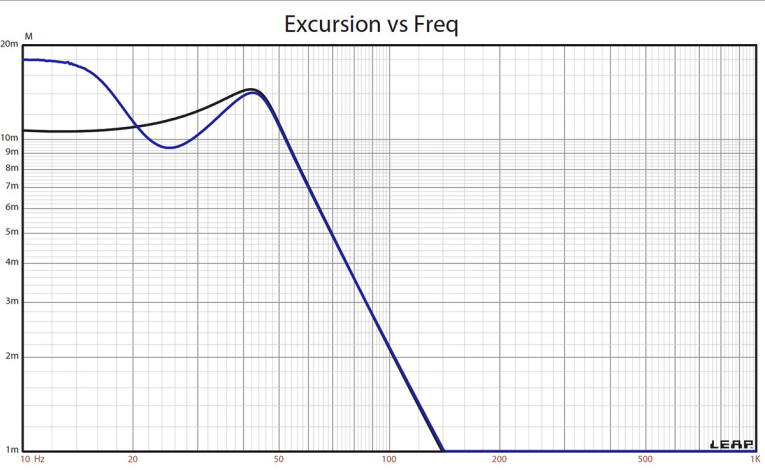
Figure 2 illustrates the results for the Scan-Speak 26W subwoofer in the sealed and vented boxes at 2.83V and at a voltage level high enough to increase cone excursion to Xmax + 15% (14.4mm for the 26W). This yielded a F3 = 40Hz with a box/driver Qtc of 0.67 for the 1.0ft3 sealed enclosure and –3dB = 33.5Hz for the 1.7ft3 vented simulation.
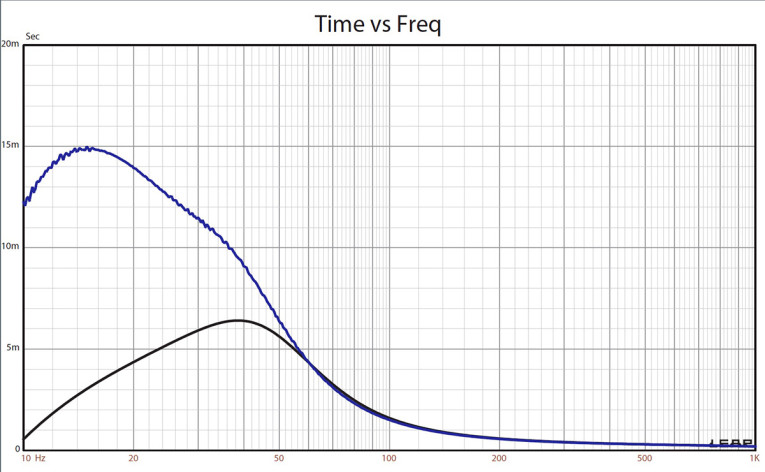
Increasing the voltage input to the simulations until the maximum linear cone excursion was reached resulted in 111.2dB at 40V for the sealed enclosure simulation and 106dB with an 16V input level for the larger vented box (see Figs. 3 and 4 for the 2.83V group delay curves and the 36/40V excursion curves).
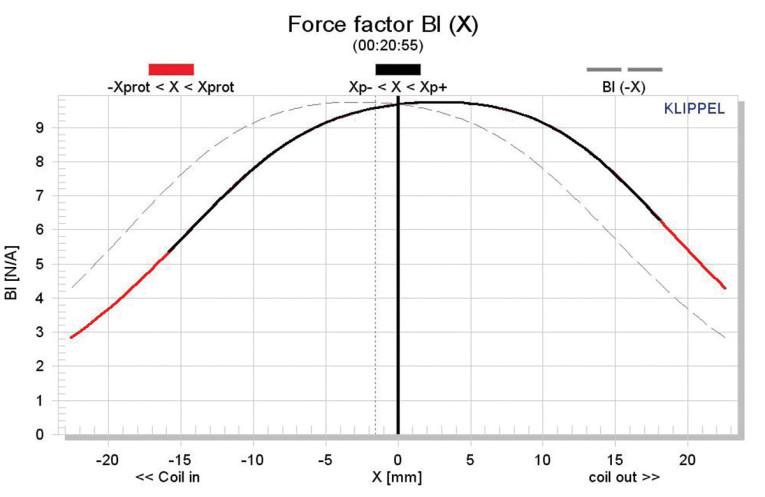
Klippel analysis for the Scan-Speak 10″ subwoofer produced the Bl(X), Kms(X) and Bl and Kms symmetry range plots given in Figs. 5-8. The Bl(X) curve for the 26W (Fig. 5) is very broad and reasonably symmetrical, typical of high Xmax drivers.
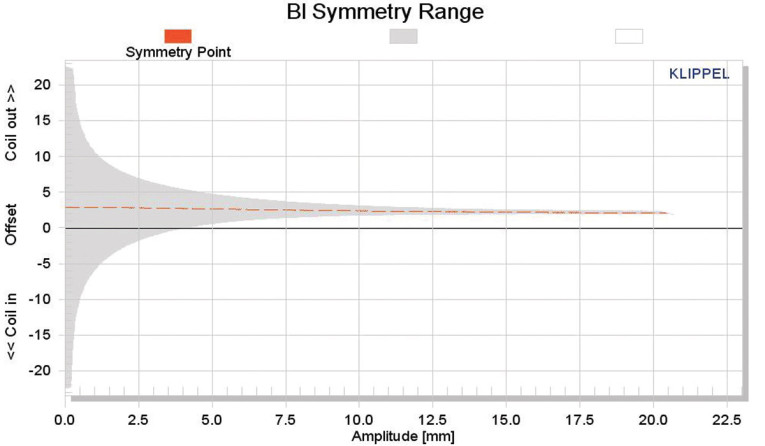
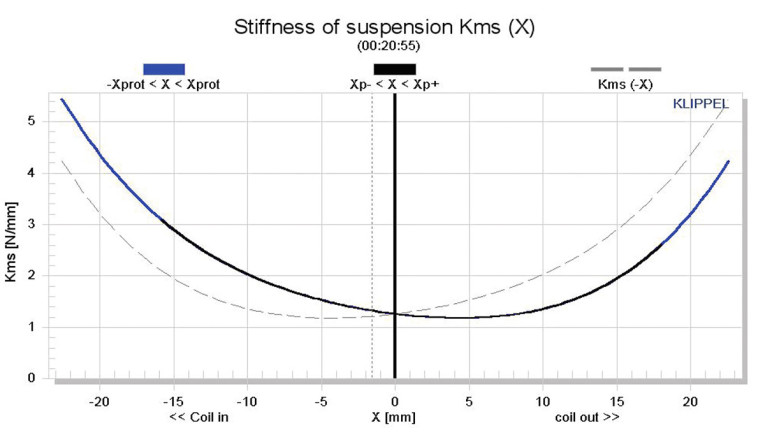
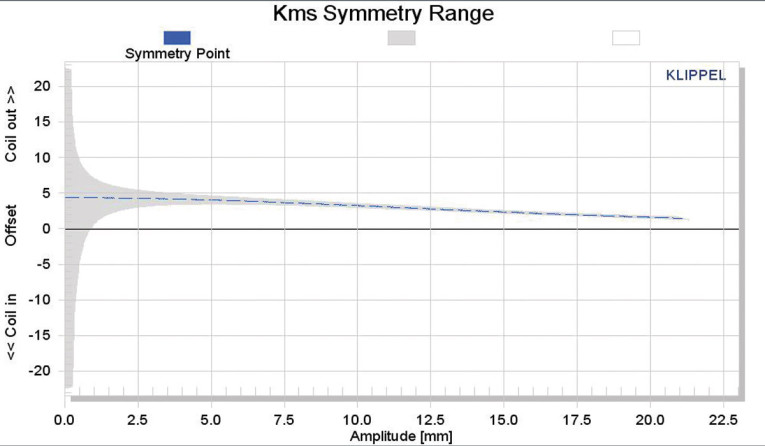
Looking at the Bl Symmetry plot (Fig. 6), this curve shows a coil forward (coil out) offset that goes from 2.8mm at rest to about 2.3mm of excursion at the physical Xmax position. Because it stays fairly constant throughout the operating range, this is likely a physical off-set. Figures 7 and 8 give the Kms(X) and Kms symmetry range curves for the Scan-Speak 26W. The Kms(X) curve (Fig. 7) is also as moderately symmetrical as the Bl curve, and likewise has a coil-out offset. In the Kms symmetry range curve in Fig. 8, the coil-out offset is 4.4mm at rest decreasing to about 3mm at the physical Xmax position. From the displacement limiting numbers calculated by the Klippel analyzer for the 26W, the XBl @ 70% is Bl = 12.6mm and for XC @ 50% Cms the minimum was 13.2mm, which means that for the 26W woofer, Bl was the limiting factor for the prescribed 20% distortion limit. This occurs at just about the physical Xmax of the driver, so not bad.
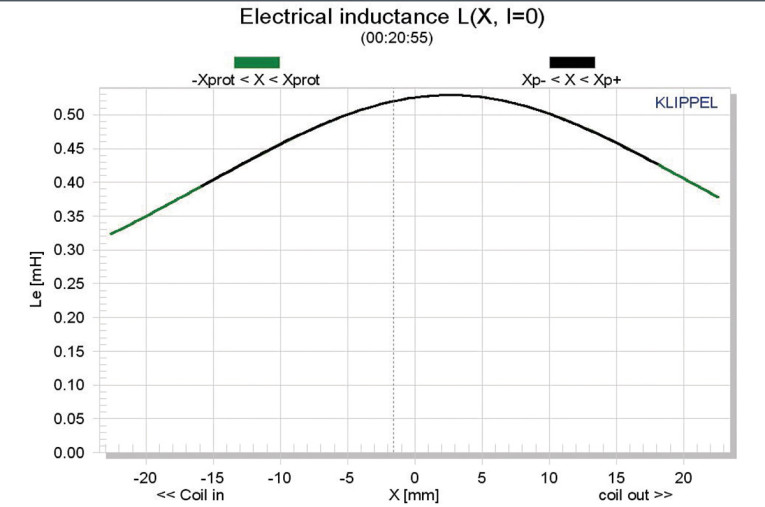
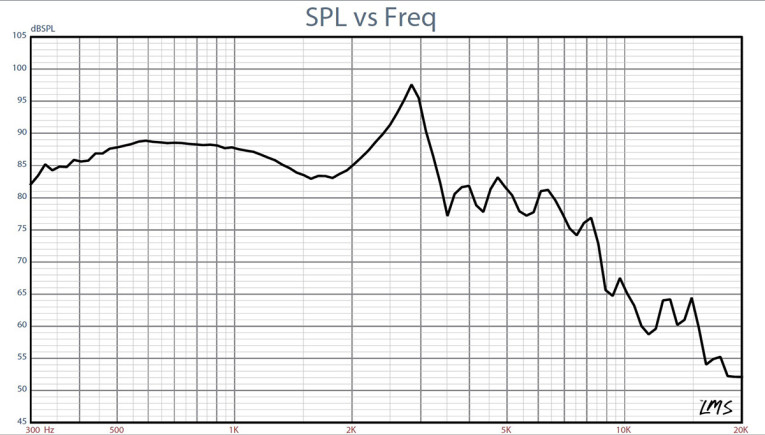
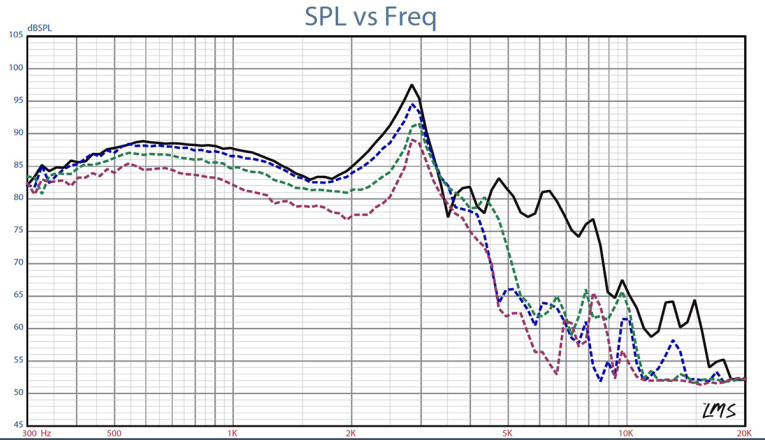
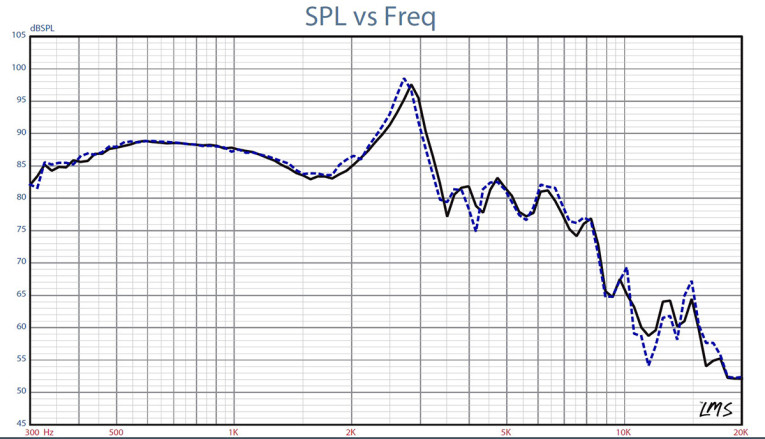
Figure 9 gives the inductance curves L(X) for the 26W. The curve illustrates a decreasing inductance as the coil moves inward, the result of the aluminum shorting sleeve in this motor system. Voice coil inductance varies only about 0.16mH from Xmax in to Xmax out (0.43mH to 0.59mH), which is very good given the amount of wire in the voice coil. Even though the 26W is a subwoofer and could likely be used with a plate amp limiting its upward extension to 100Hz, this 10" driver could also find application in three-way designs.
Given that, I mounted the 26W/4558T00 subwoofer in an enclosure which had a 12" × 12" baffle and was filled with damping material (foam) and then measured the DUT on- and off-axis from 300Hz to 20kHz frequency response at 2.83V/1m using a 100 point gated sine wave sweep. Figure 10 gives the 26W's on-axis response displaying a very smooth rising response to about 600Hz, followed by a 6dB drop in SPL to about 1.8kHz, followed by the start of the aluminum breakup mode centered on about 2.8kHz.
Figure 11 has the on- and off-axis frequency response at 0°, 15°, 30°, and 45°. With respect to the on-axis curve, -3dB at 30° occurs at 1.0kHz, so a cross point anywhere below that frequency should be fine. It certainly would be possible to match it to a ribbon driver in a two-way at that frequency, but a more likely configuration would be combining the 26W with a 5.25" midrange and a 1" dome. The last SPL measurement is shown in Fig. 12 and gives the two-sample SPL comparisons for the 10" Scan-Speak driver, showing a close matchup within the relevant operating range of the woofer.
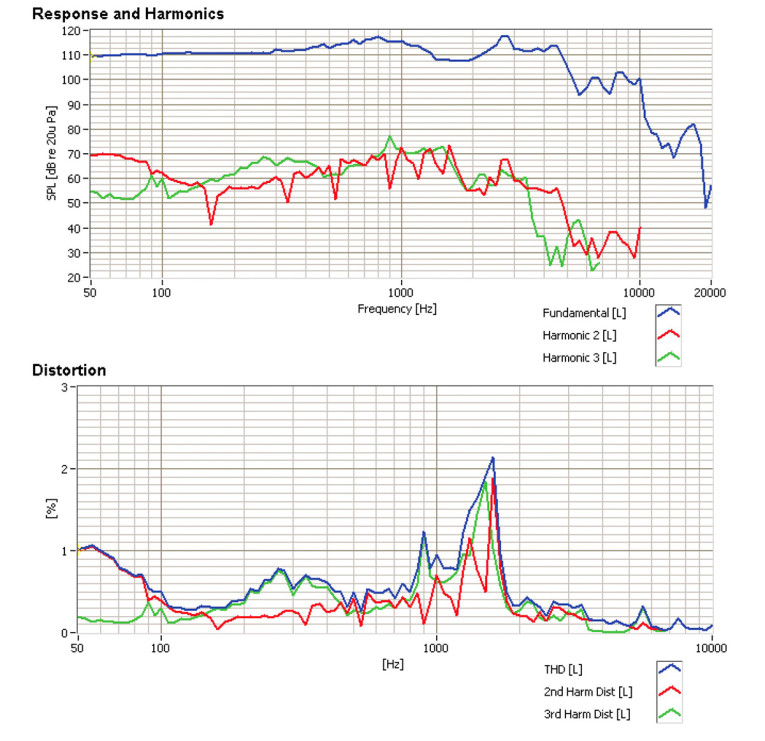
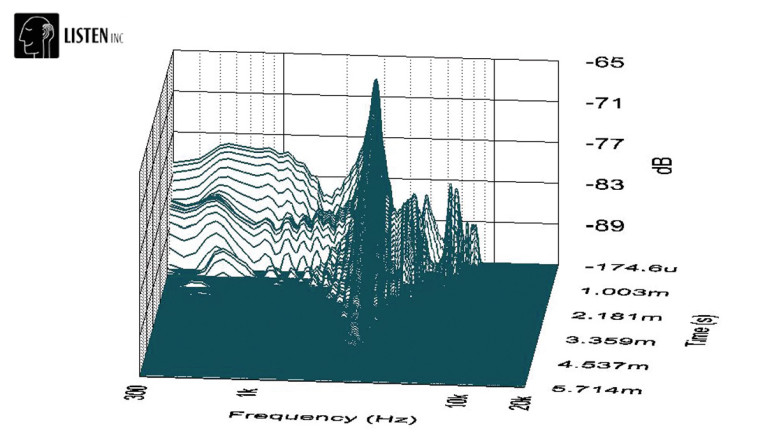
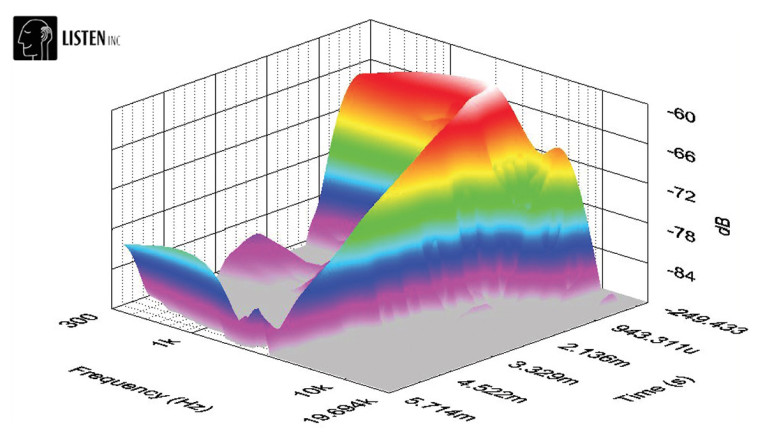
For the last group of tests, I employed the Listen Inc. SoundCheck analyzer (courtesy of Listen Inc.) and SCM microphone to measure distortion and generate time frequency plots. Setting up for the distortion measurement consisted of mounting the woofer rigidly in free-air, setting the SPL set to 94dB at 1m using a noise stimulus (SoundCheck has a software generator and SPL meter as two of its utilities), and then measuring the distortion with the Listen Inc. SCM microphone placed 10cm from the dust cap. This produced the distortion curves shown in Fig. 13. Last, I employed the SoundCheck analyzer to get a 2.83V/1m impulse response for this driver and imported the data into Listen Inc.'s SoundMap Time/Frequency software. The resulting CSD waterfall plot is given in Fig. 14 and the Wigner-Ville logarithmic surface map (for its better low-frequency performance) plot in Fig. 15. Looking over all the data presented, this is a very well designed driver, and another good one from Scan-Speak. For more information on these and the other new Scan-Speak drivers, visit the Scan-Speak website at www.scan-speak.dk
This article was originally published in Voice Coil, February 2011.