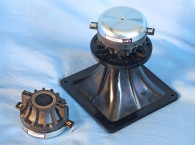


Oberton built its own 21,500 ft2 factory building in 2006. This company is probably more vertically integrated than a lot of pro sound OEMs, producing all the important parts (e.g., voice coils, diaphragms, and metal parts) for all low-frequency loudspeakers and high-frequency drivers in the Oberton factory with 100% quality control. As a result, Oberton can guarantee the tolerance of 1” high-frequency drivers to a ±1 dB frequency response in the 2,000 Hz to 15,000 Hz range compared with the reference driver of each model, which is impressive.
The driver that Oberton supplied for this month’s Test Bench explication is the company’s new ND45 1 (see Photo 1) along with the H-960 1" throat PBT-PET 90° × 60° constant directivity horn. The ND45 has a 44 mm (1.75”) diameter two-layer voice coil wound with aluminum wire wound onto a Kapton former driving a polyester sandwich diaphragm and vented surround (see the Photo 2), with the entire assembly being field replaceable.
Other features include a FEA-optimized neodymium ring magnet motor structure, copper shorting ring, a continuous rated power handling of 40 W with a peak power handling of 80 W, a 1.5 kHz recommended minimum crossover frequency (second-order high-pass filter), heatsink fins on the back of the assembly, 110 dB sensitivity, plus gold terminals. Cut-off frequency for the H-960 horn 850 Hz, perfect for the ND45.
Testing began using the LinearX LMS analyzer to produce the 300-point stepped sine wave impedance plot shown in Figure 1, with the solid black curve representing the ND45 mounted on the H-960 horn and the dashed blue curve representing the compression driver without the horn. With a nominal 16 Ω impedance (the ND45 is also available in 8 Ω), the ND45 had 10.61 Ω DCR (Re), with a minimum impedance mounted on the H-960 horn of 12.4 Ω and at 3.4 kHz.


For the next set of SPL measurements, I free-air mounted the Oberton ND45/H-960 combination without an enclosure and measured both the horizontal and vertical on- and off-axis at 2 V/0.5 m (normalized to 2.83 V/1 m) from 0° on-axis to 60° off-axis using the LoudSoft FINE R+D analyzer and GRAS 46BE microphone (supplied courtesy of LoudSoft and GRAS Sound & Vibration).
Figure 2 displays the on-axis frequency response of the compression driver/horn, which is relatively smooth with no major anomalies from the 1.5 kHz recommended crossover frequency to about 19 kHz, with the typical downward sloping response of a constant directivity horn.
Figure 3 shows the 0°-60° on- and off-axis response in the horizontal plane. Figure 4 displays the normalized horizontal plane response. Figure 5 shows the 180° horizontal polar plot (in 10° increments with 1/3 octave smoothing applied), generated by the CLIO Pocket analyzer and accompanying CLIO microphone (courtesy of Audiomatica SRL).
Rotating the horn 90° to capture the vertical axis response resulted in the vertical plane 0° to 60° on- and off-axis response seen in Figure 6. The normalized version is illustrated in Figure 7. Figure 8 shows the CLIO Pocket-generated 180° vertical plane polar plot (in 10° increments with 1/3 octave smoothing applied).


Last, Figure 9 illustrates the two-sample SPL comparison showing the two Oberton ND45 compression driver samples to be closely matched within 0.25 dB or less throughout the transducer’s entire operating range.
For the remaining series of tests, I set up the Listen, Inc. AudioConnect analyzer and 1/4” SCM microphone (provided by Listen, Inc.) to measure distortion and generate time-frequency plots. For the distortion measurement, I mounted the Oberton ND45/H-960 combination in free-air in the same manner as was used for the frequency response measurements, and set the SPL to 104 dB at 1 m (2.83 V determined by using a pink noise stimulus generator and internal SLM in the SoundCheck 17 software). Then, I measured the distortion with the Listen microphone placed 10 cm from the mouth of the horn. This produced the distortion curves shown in Figure 10.
Following this test sequence, I set up SoundCheck 17 to generate a 2.83 V/1 m impulse response curve for this driver/horn combination and imported the data into Listen’s SoundMap Time/Frequency software. Figure 11 shows the resulting cumulative spectral display (CSD) waterfall plot. Figure 12 shows the Short Time Fourier Transform (STFT) plot.
When you sift through all the objective data I took regarding the Oberton ND45 compression driver and the H-900 horn combination and consider the excellent build quality, Oberton is clearly a very competent OEM and it provides manufacturers with another place to shop for high-quality pro sound OEM transducers.
For more information about the ND45 and Oberton’s complete line of neodymium and ferrite cone, coaxial, and high-frequency drivers, as well as line array drivers, tweeters, and horns, visit www.oberton.com. VC
This article was originally published in Voice Coil, September 2020.


