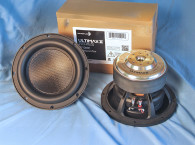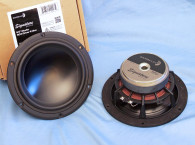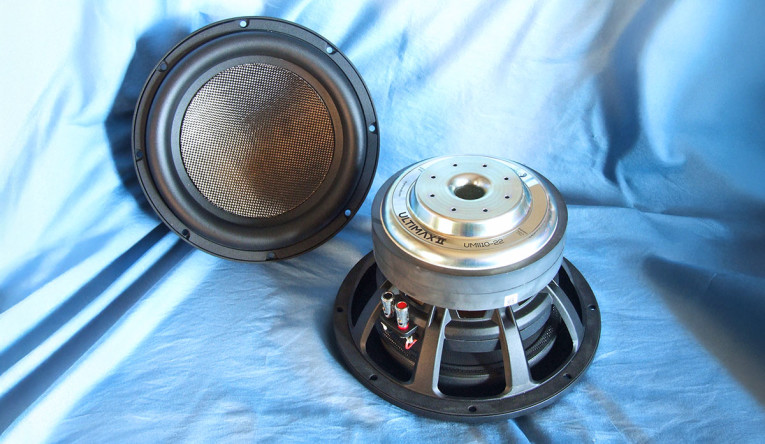
This 10" subwoofer model from Dayton Audio’s new upgraded Ultimax II line of high-performance shares the common feature set for the new line, including a large aluminum shorting ring and aluminum pole sleeve for lower magnetic distortion, a lightweight and rigid woven carbon fiber cone assembly, and high Xmax from 18mm to 28mm (18mm on the 8” up to 28mm on the 18”). The frame and motor are designed with extensive thermal venting, and there's a 2.5” to 3” diameter DVC 2Ω flat wound voice coils with power handling from 400W (8”) to 1200W (18”), with a dual back-to-back spider configuration. All Thiele-Small Parameters (TSP) are optimized for compact sealed enclosures, but also capable of low-frequency extension vented designs.
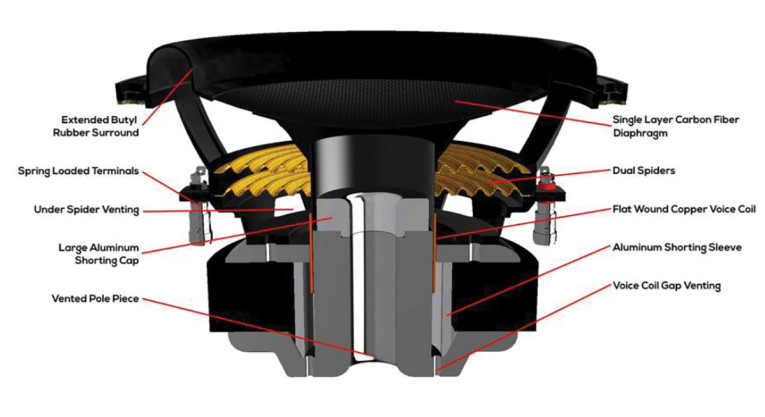
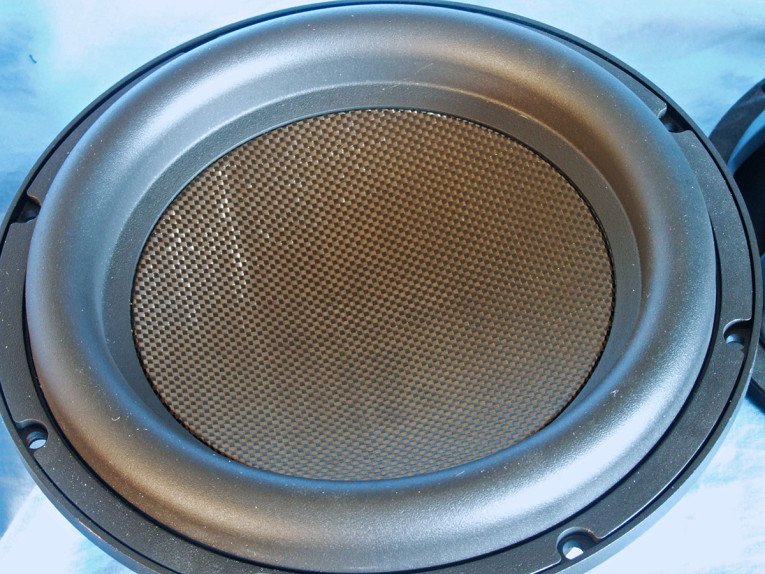
Other features include the incorporation of a very stiff and thick curvilinear profile carbon fiber cone, further stiffened by 4” diameter 1.25” high heavy paper cone section that attaches to the bottom of the carbon fiber cone to the voice coil neck joint. For additional thermal cooling, the paper cone extension includes four oval 10mm x 5mm vents with eight more 4mm diameter vents at the top of the voice coil former near the neck joint. Suspension is provided by a FEA-optimized low-loss (high Qm) high profile (22mm high and 24mm wide) NBR surround plus two flat 6” diameter cloth spiders (damper).
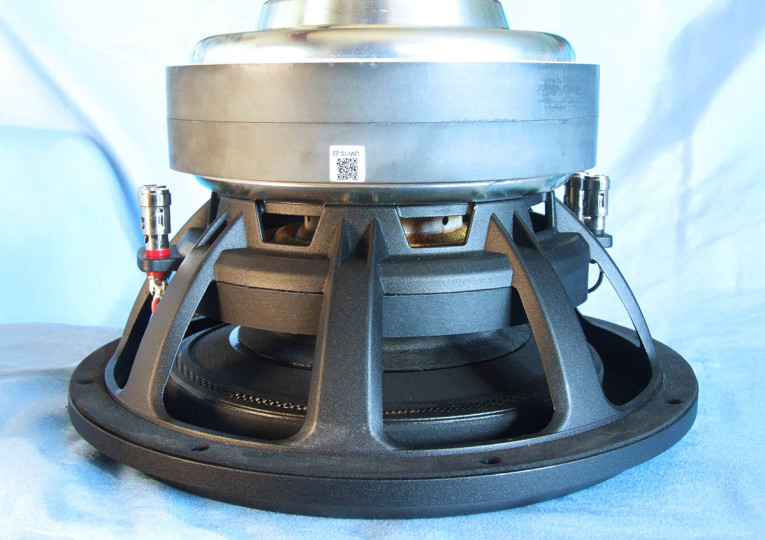
All this is driven by a 63.5mm (2.5”) diameter four-layer voice coil wound with flat copper wire on a vented aluminum former. The motor system powering the cone assembly utilizes two 20mm thick 175mm diameter ferrite magnets sandwiched between a milled and polished 10mm thick front plate and a milled and polished shaped T-yoke that utilizes a flared 25mm diameter pole vent surrounded by eight 3.5mm diameter peripheral vents that exhaust from the gap area. The UMII10-221 also incorporates a set of dual aluminum shorting rings (Faraday shields) — one being an aluminum sleeve on the inner diameter of the motor magnets and the other as a cap on the pole piece that reduce distortion caused by eddy currents. Last, the braided voice coil lead wires are stitched into the top spider and terminate to a pair of chrome-plated color-coded push terminals located on opposite sides of the frame.
The 50V curves were too nonlinear for a reasonable curve fit and were discarded. The remaining 16 sine wave sweeps for each woofer were further processed with the voltage curves divided by the current curves to produce impedance curves. Phase curves were generated using the LEAP phase calculation routine, after which the impedance magnitude and phase curves plus the associated voltage curves were copy/pasted into the LEAP 5 Enclosure Shop software’s Guide Curve library.
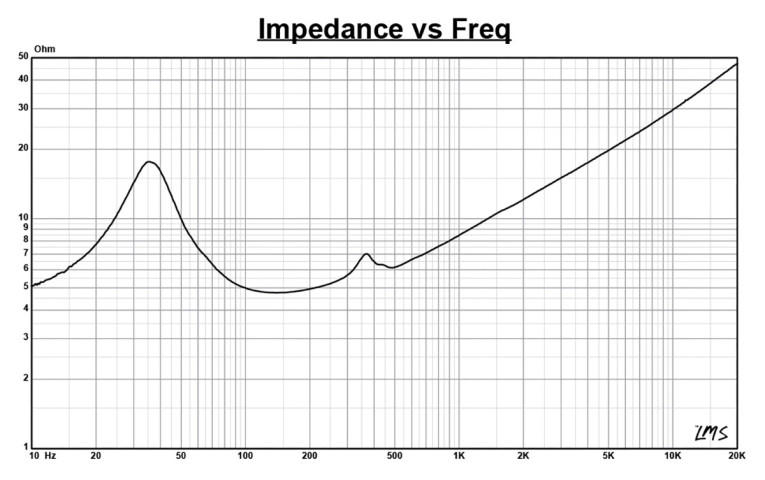
This data was then used to calculate parameters using the LEAP 5 LTD transducer model. Because most all manufacturing data is produced using either a standard transducer model or in many cases the LEAP 4 TSL model, I also generated LEAP 4 TSL model parameters using the 1V free air that can also be compared with the manufacturers data. Figure 2 shows the UMII10-22 1V free-air impedance plot. Table 1 compares the LEAP 5 LTD and LEAP 4 TSL TSP sets for the Dayton Audio UMII10-22 driver samples along with the Dayton Audio factory data.
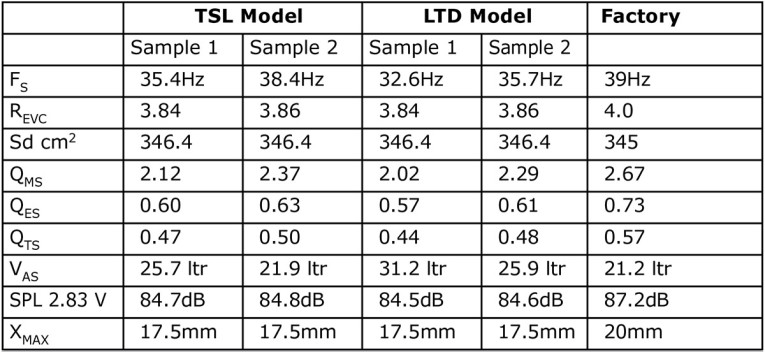
From the comparative data shown in Table 1, you can see that all four parameter sets for the two samples were reasonably similar and correlated well with the factory data. The Qts was somewhat lower than the factory data, but Fs/Qt ratios were close, confirmed by a box simulation using the factory data. The Xmax number for the Dayton factory data was calculated as 70% Bl from Klippel analysis.
Following my normal protocol for Test Bench testing, I used the Sample 1 LEAP 5 LTD parameters and set up two computer box simulations, both being the recommended enclosures volumes published by Dayton Audio. The first was a 0.8ft3 type sealed enclosure with an F3=53Hz. No Qtc was specified or a percentage of damping material, but I followed my usual protocol with 50% fill material (fiberglass). The second example was a vented box in a 1.5ft3 box yielding an F3=27Hz. No tuning frequency was specified or a percentage of fill material, so I again follow my standard protocol with 15% fill material and tuned the enclosure to 30Hz.
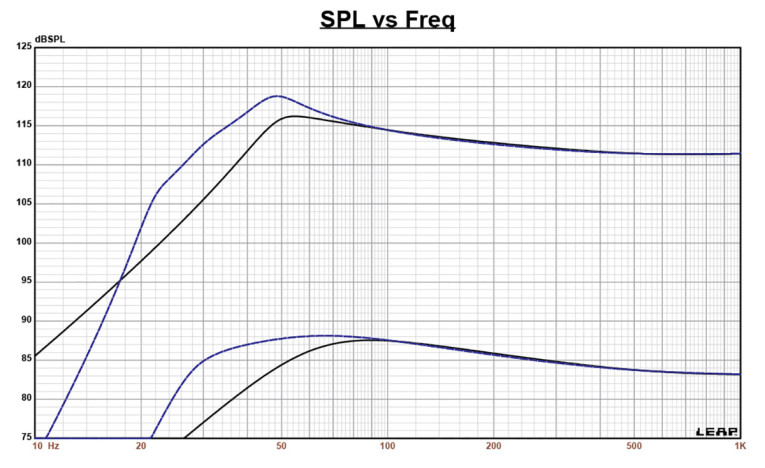
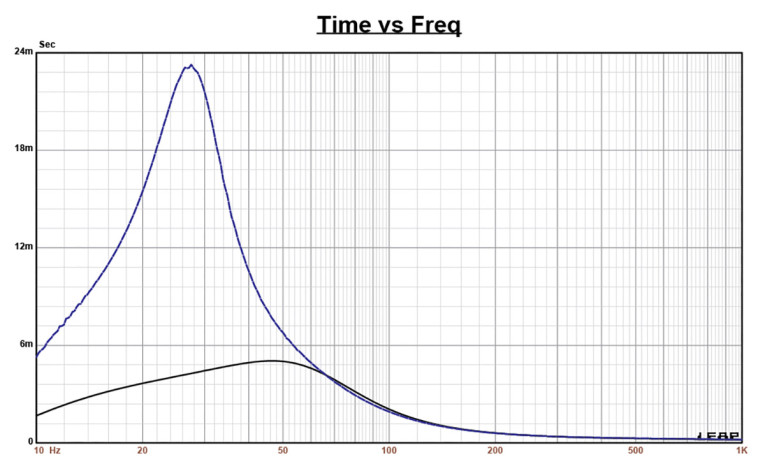
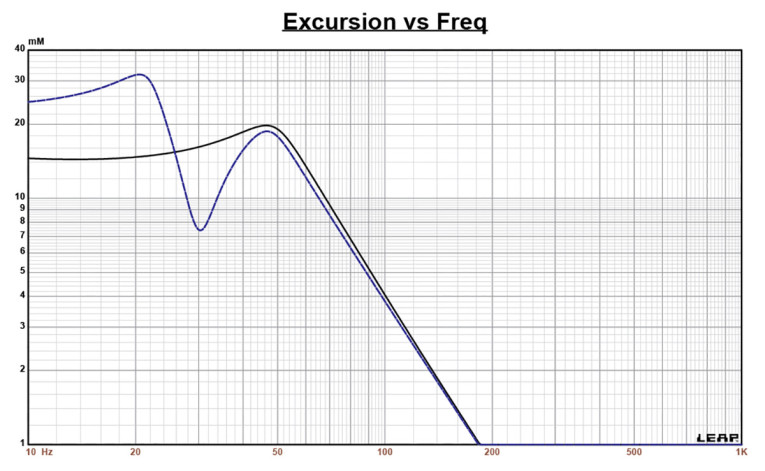
Figure 3 gives the results for the 10” Dayton Audio UMII10-22 subwoofer in the sealed and vented enclosures at 2.83V and at a voltage level sufficiently high enough to increase cone excursion to Xmax+15% (20mm for UMII10-22). This resulted in an F3 of 51Hz (-6dB=40Hz) with a Qtc=0.68 for the 0.8ft3 closed box and a -3dB for the vented simulation of 30Hz (-6dB=26Hz). Increasing the voltage input to the simulations until the approximate Xmax+5% maximum linear cone excursion point was reached resulted in 116dB at 98V for the sealed enclosure simulation and 119dB with same 98V input level for the larger vented box. Figure 4 shows the 2.83V group delay curves and Figure 5 shows the 98V excursion curves.
Klippel analysis for the 10” Dayton Audio UMII10-22 subwoofer was performed by Patrick Turnmire at Redrock Acoustics. He used the Klippel DA2 analyzer and produced the Klippel data graphs given in Figures 6-9. Please note, if you do not own a Klippel analyzer and would like to generate this type of data on any transducer, Redrock Acoustics is available to perform this and a myriad of other measurement and design consulting services.
The Bl(X) curve (Figure 6) is very broad and mostly symmetrical (with an element of “tilt”) typical of a driver with a high Xmax number. Looking at the Bl symmetry curve (Figure 7) shows a relatively small 1.4mm Bl coil-out (forward) offset once you reach an area of reasonable certainty around 10mm, decreasing to 1.3mm at the physical 17.3mm Xmax position and decreasing beyond this point.
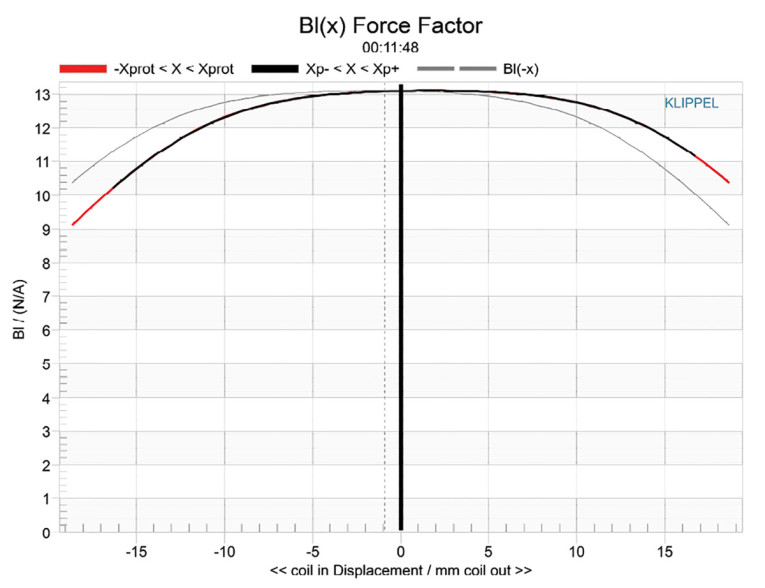
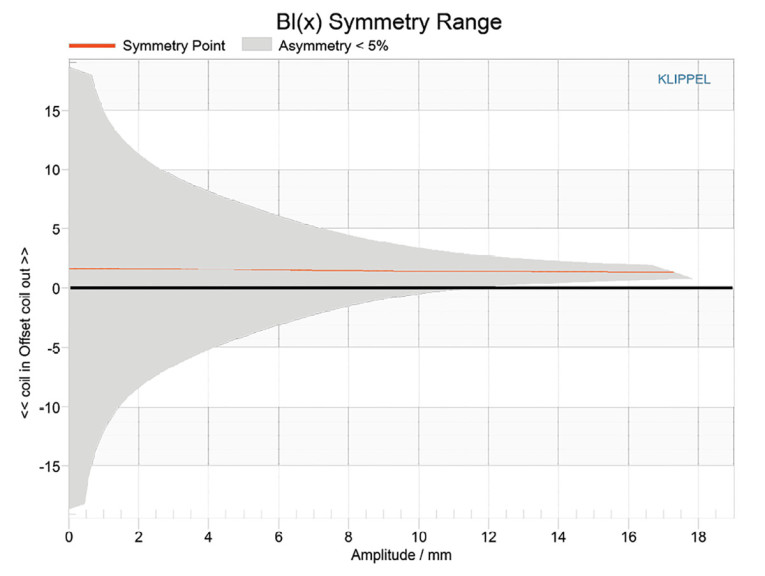
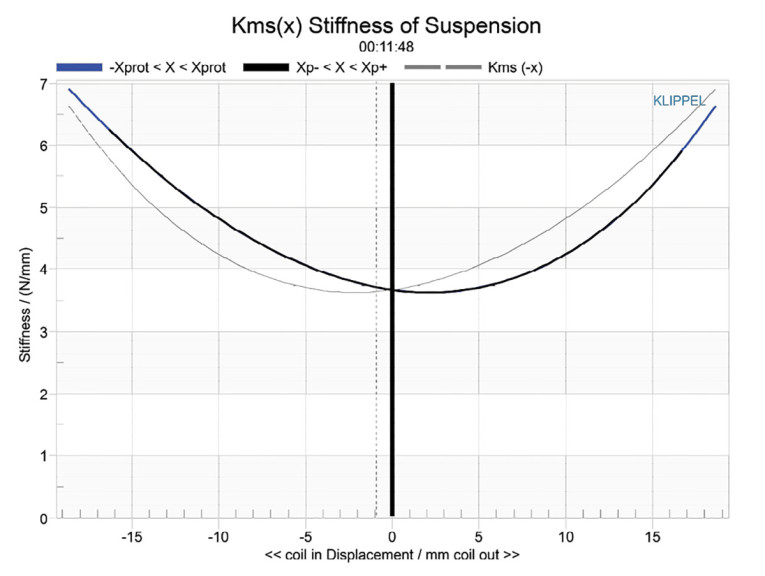
Figure 8 and Figure 9 show the Kms(X) and Kms symmetry curves for the Wavecor subwoofer. Like the Bl curve, the Kms stiffness of compliance curve (Figure 8) is also very symmetrical, and with a small degree of offset. The Kms symmetry range curve exhibits a small forward offset that is about 1.6mm at the 10mm excursion point that decreases to 0.64mm at the 17.3mm physical Xmax of this transducer.
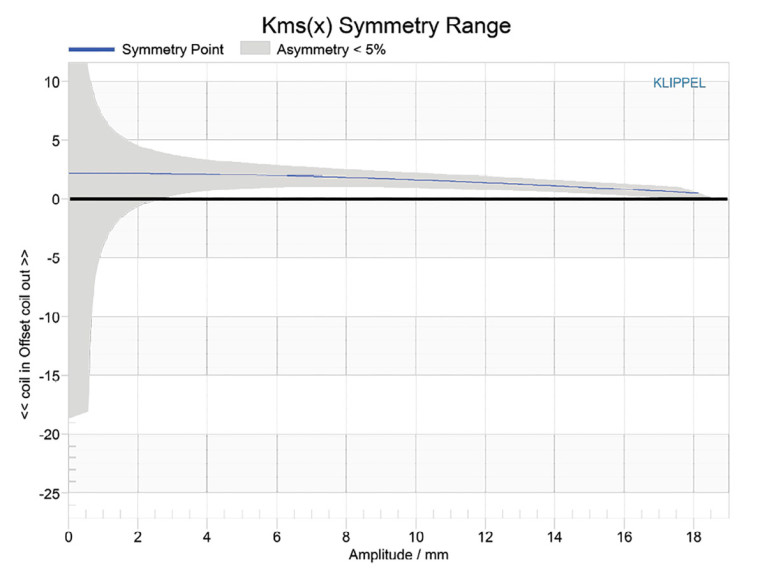
Displacement limiting numbers calculated by the Klippel analyzer for the Dayton UMII10-22 using the subwoofer criteria for Bl was XBl @ 70% (Bl dropping to 70% of its maximum value) greater than 16.3mm for the prescribed 20% distortion level (the criterion for subwoofers). For the compliance, XC @ 50% Cms minimum was also greater than 16.3 mm, which means that for the Untimax II 10” subwoofer, the Bl and the compliance are about equal contributors for getting to the 20% distortion level, however, both numbers were just 1mm short of physical Xmax of the driver.
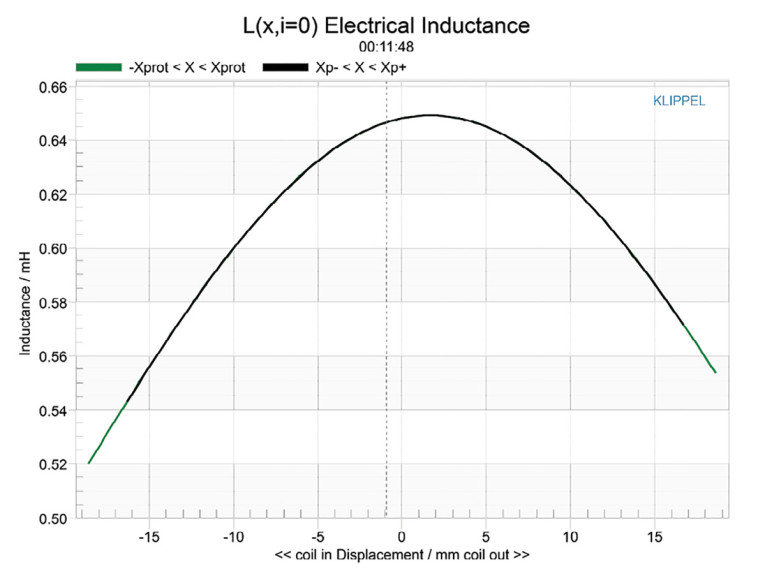
Figure 10 gives the inductance curve Le(X) for this transducer. Motor inductance will typically increase in the rear direction from the zero-rest position as the voice coil covers more of pole, however that doesn’t happen here, mostly due to the extensive dual shorting rings built into the motor structure. What we do get is lower inductance variation from full in to full out travel, which is the goal you want to achieve. It’s easy to see the benefit of the dual aluminum shorting rings with inductance only varying about 0.08mH to 0.114mH from Xmax in to Xmax out, which is very minimal inductance change for such a large motor.
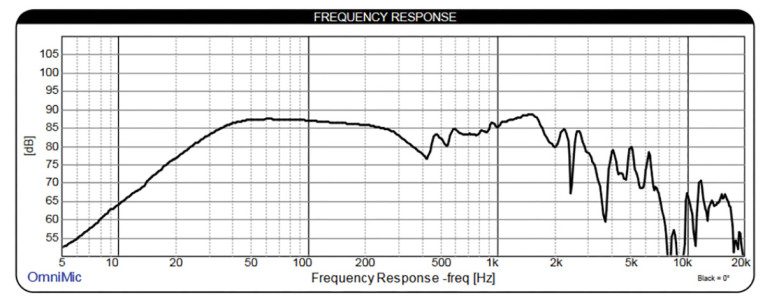
Given that the Dayton Audio UMII10-22 is a subwoofer mostly intended for applications below 100Hz, I dispensed with the SPL measurements since this driver will not likely be crossed over much over 100Hz. That said, the factory generated frequency response curve is shown in Figure 11. I also dispensed with time domain analysis for subwoofers as the data is not really significant below 100Hz.
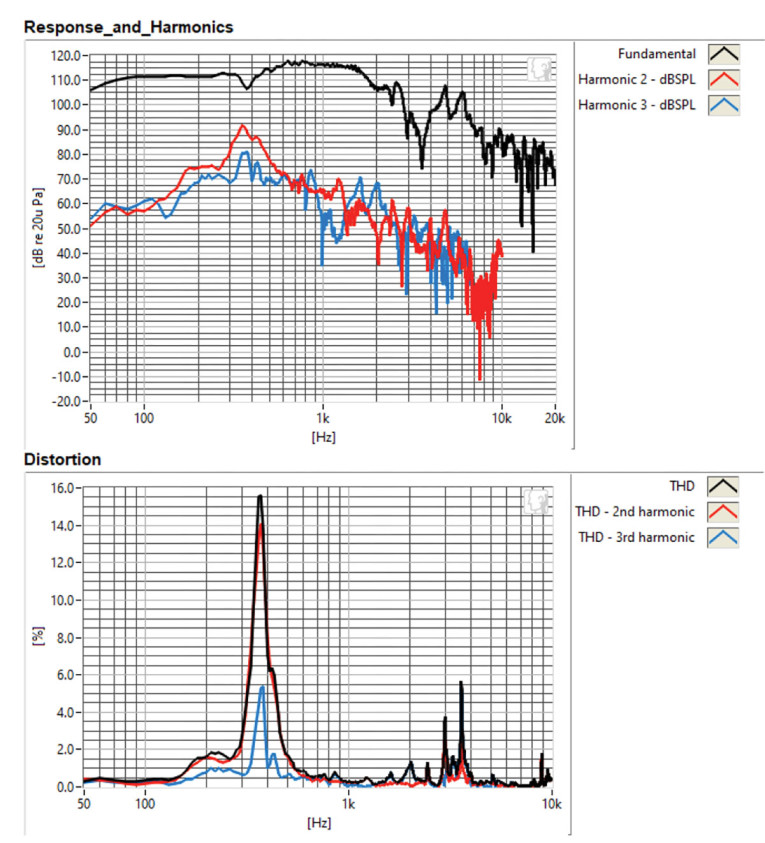
Next, I used the Listen SoundCheck analyzer to perform distortion analysis. For distortion measurements, the voltage level was set with the driver rigidly mounted in free air and the voltage increased until it produced a 1m SPL of 94dB (10.9V), my distortion SPL standard for home audio drivers. The distortion measurement was then made with the microphone placed near-field about 10cm from the dust cap. This plot is shown in Figure 12 for the 10” Ultimax II subwoofer. As can be seen, this actually includes two plots — the top graph being the standard fundamental SPL curve with the second and third harmonic curves, and the bottom graph the second and third harmonic curves plus the THD curve with an appropriate X-axis scale. Interpreting the subjective value of conventional distortion curves is almost impossible; however, looking at the relationship of the second to third harmonic distortion curves is of value.
As can be derived from this month’s explication, the Dayton Audio UMII10-22 is another well-crafted transducer from the engineering talent at Dayton Audio. Given its 50Hz F3 performance in a compact sealed box, I would probably use DSP to boost the response down to around 25Hz rather than use a vent or passive radiator and get the benefit of lower group delay. For more information, visit www.daytonaudio.com. VC
This article was originally published in Voice Coil, January 2025