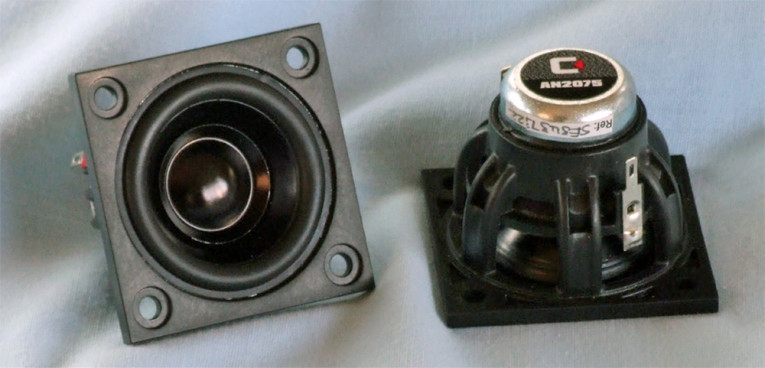


The AN2075 has a 20-mm diameter two-layer voice coil wound with copper wire on a nonconducting polyimide former attaching to a pair of aircraft-type terminals. Powering this structure is an overhung neodymium motor with a ventilated (four 2-mm vent holes) motor return cup for better heat transfer to the surrounding air.
I clamped the driver to a rigid test fixture in free air at 0.3, 1, 3, and 6 V and used the LinearX LMS analyzer and VIBox to create voltage and admittance (current) curves. Next, I post-processed the eight 550-point stepped sine wave sweeps (four current and four voltage sweeps) for each AN2075 sample. Then, I divided the voltage curves by the current curves (admittance curves) to produce the impedance curves, which were phase generated by the LMS calculation method.
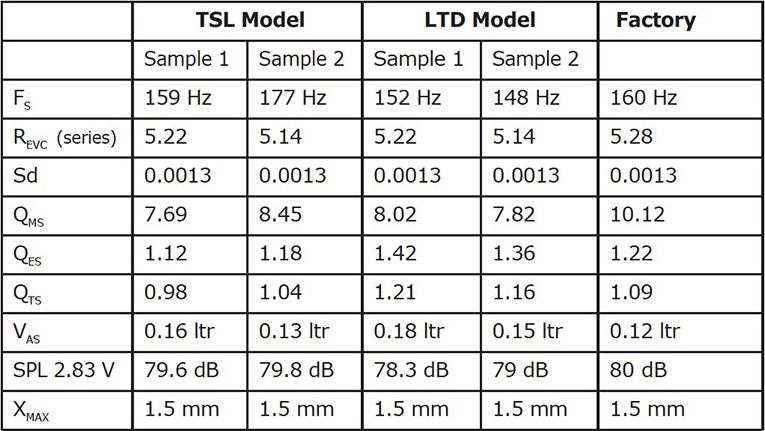
Next, I imported them along with the accompanying voltage curves into the LEAP 5 Enclosure Shop software. Most Thiele-Small (T-S) data provided by OEM manufacturers is produced using either a standard transducer model or the LEAP 4 TSL model so I used the 1-V free-air curves to create a LEAP 4 TSL model. From LEAP 5’s transducer derivation menu, I selected the complete data set, the LTD model’s multiple voltage impedance curves, and the TSL model’s 1-V impedance curve and created the parameters for the computer box simulations. Figure 1 shows the 1-V free-air impedance curve. Table 1 compares the LEAP 5 LTD and TSL data and Celestion factory parameters for both the AN2075 samples.
The AN2075’s LEAP parameter calculation results were reasonably close to the factory data. The only real difference was some minor variation in the sensitivity rating, but mine is a calculated mid-band derived from the parameter measurement and Celestion’s is a half-space anechoic chamber measurement at 1 W/1 m.
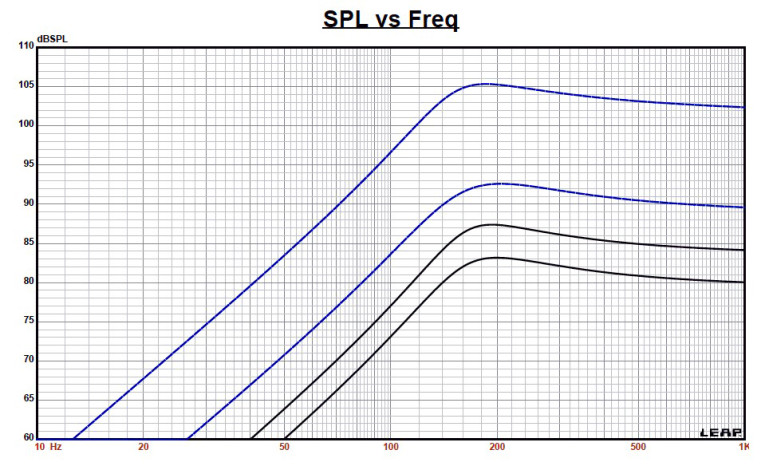

Then, I used the LEAP LTD parameters for Sample 1 to set up the computer enclosure simulations. I programmed two computer box simulations into LEAP. The first simulation was a single AN2075 driver in a 61-in3 sealed box alignment (50% fill material). Figure 2 shows the second simulation, which was a nine-driver array with a total of 549 in3 for the sealed enclosure (also with 50% fill material). Figure 3 shows the results for the Celestion AN2075 full-range array driver in the two enclosure simulations at 2.83 V and at a voltage level sufficiently high enough to increase the cone excursion to 1.73 mm (XMAX + 15%). This produced a F3 frequency of 140 Hz with a box/driver Qtc of 1 for the single-driver sealed enclosure and –3 dB = 137 Hz with a Qtc = 1 for the sealed-box nine-driver array simulation.
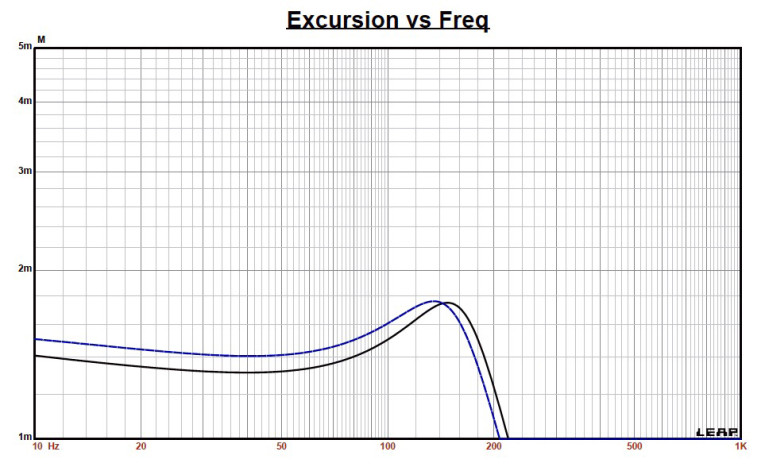
I increased the voltage input to the simulations shown in Figure 3 until the maximum linear cone excursion was reached. This resulted with only 1.5-mm XMAX, 87.5 dB at 4.75 V for the sealed enclosure simulation, and 105 dB with a 13.25-V input level for the larger nine-driver array. Figure 4 and Figure 5 show the 2.83-V group delay curves and the 4.75-V/13.25-V excursion curves).
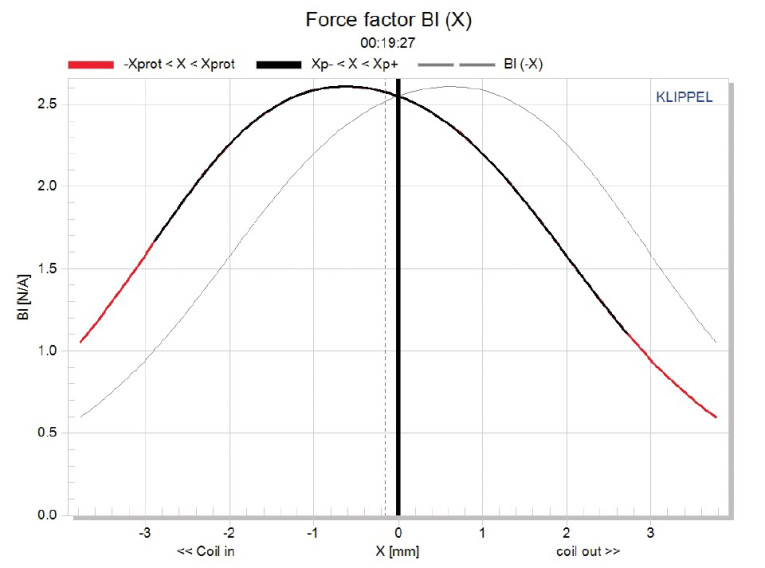
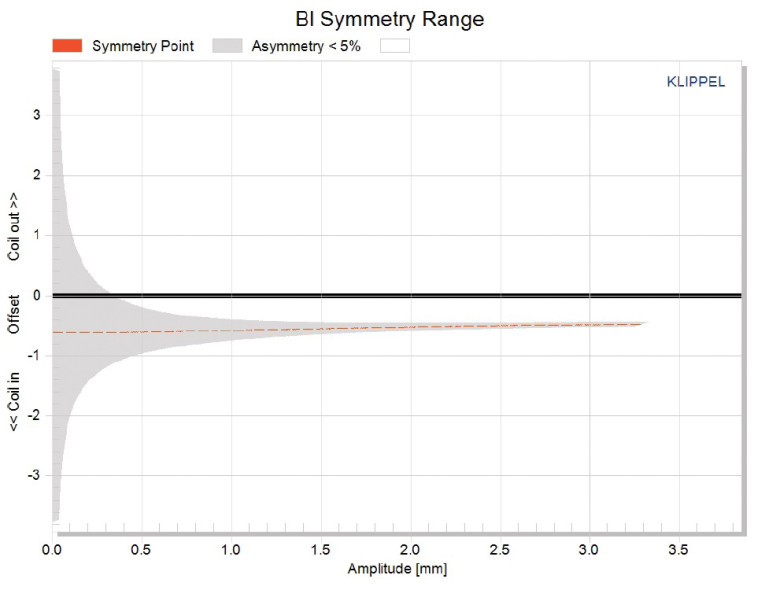
The AN2075’s Klippel analysis produced the Bl(X), KMS(X) and Bl and KMS symmetry range plots shown in Figures 6–9. (The analyzer I use for Test Bench is provided courtesy of Klippel. Pat Turnmire of Redrock Acoustics performs the testing). The AN2075’s Bl(X) curve is relatively shallow, which is typical of any short XMAX driver (as opposed to being broad and flat like a high XMAX driver), as well as having a good degree of symmetry, but there is some obvious offset (see Figure 6). The Bl symmetry plot shows about 0.61-mm coil-in offset at the rest position that decreases to 0.54 mm at the driver’s physical 1.5-mm XMAX (see Figure 7). This small offset is mostly normal production variation. Given these drivers are not likely to perform in their piston range, I don’t think this is much of an issue.
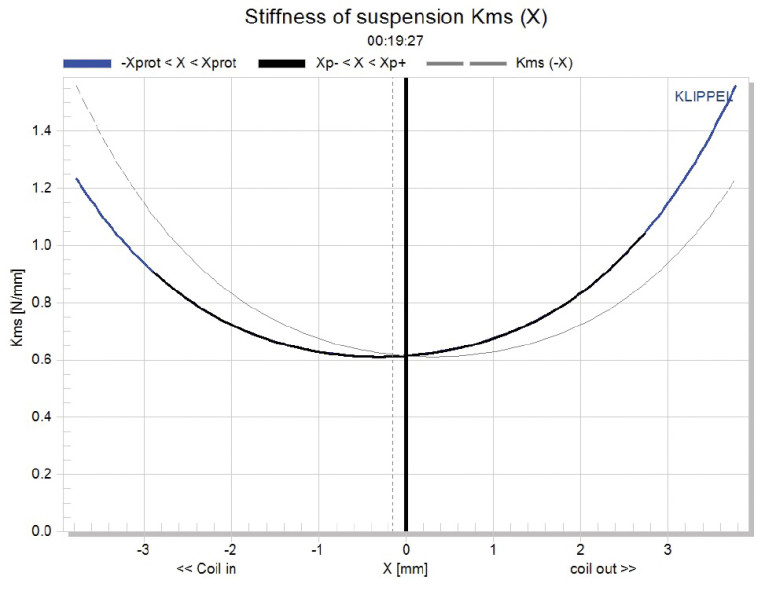
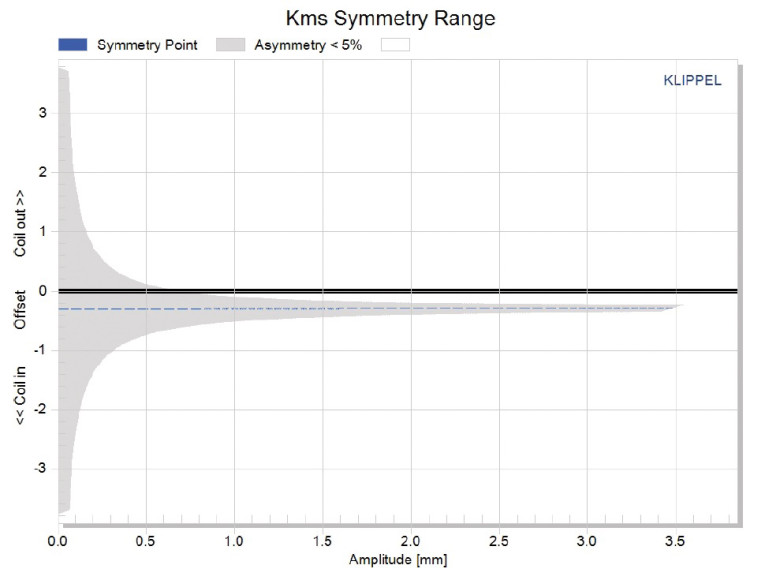
Figure 8 and Figure 9 show the AN2075’s KMS(X) and KMS symmetry range curves. The KMS (X) curve is also symmetrical and has a very minor forward (coil-in) offset of about 0.3 mm at the rest position. The AN2075’s displacement limiting numbers, calculated by the Klippel analyzer, were XBl at 82%, Bl = 1.2 mm. For the crossover at 75%, the CMS minimum was 1.9 mm. For Celestion’s AN2075, this means the Bl is the most limiting factor for the prescribed 10% distortion level and is somewhat less than the physical XMAX.
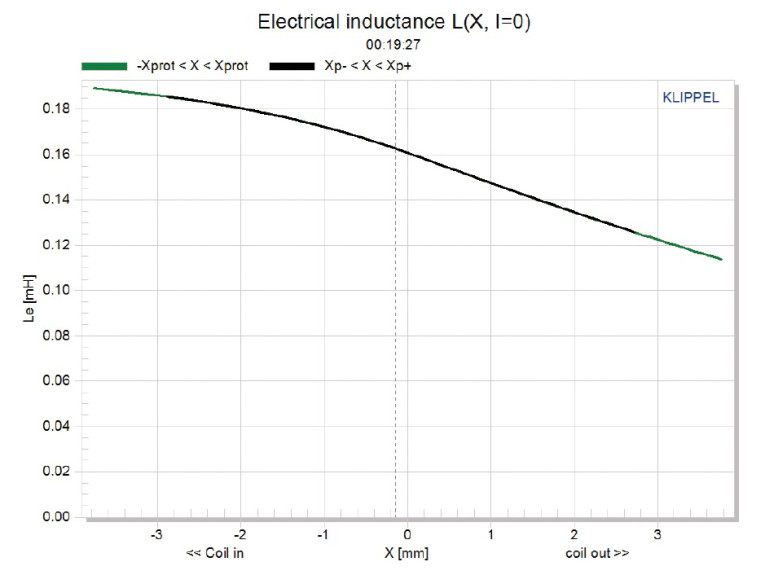
Figure 10 shows the AN2075’s inductance curve Le(X). Inductance will typically increase in the rear direction from the zero rest position as the voice coil covers more pole area. However, the AN2075’s inductance variance due to the neodymium motor structure is rather small. The inductance variation is only 0.035 mH from the XMAXIN and XMAXOUT positions, which is very good.
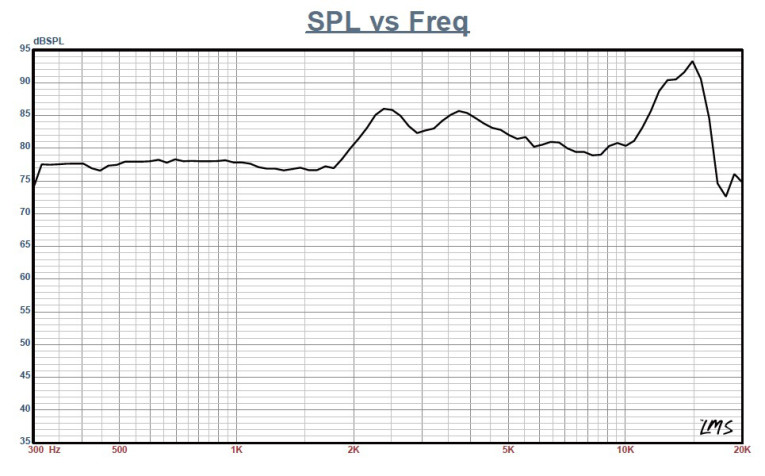
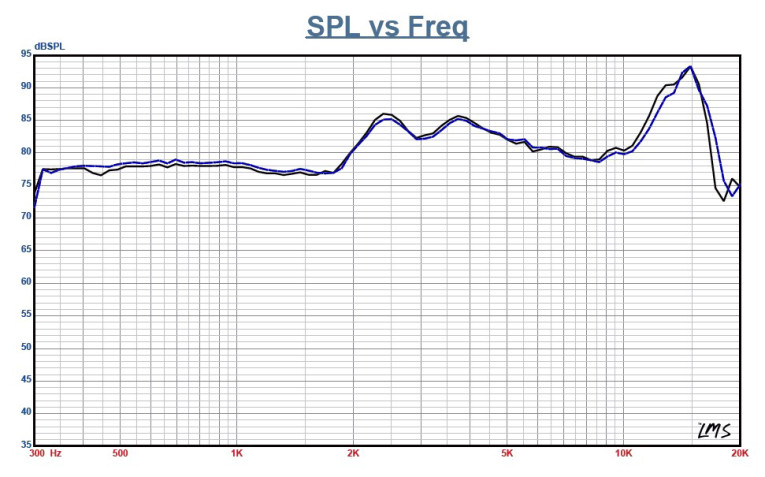
Next, I mounted the AN2075 in an enclosure that had a 4” × 9” baffle filled with damping material (foam). I used the LinearX LMS analyzer set to a 100-point gated sine wave sweep to measure the transducer on- and off-axis from 300-Hz-to-40-kHz frequency response at 2.83 V/1 m. Figure 11 shows the AN2075’s on-axis response, which indicates a smoothly rising response to about 1.8 kHz with a couple of peaks at 2.4 kHz and 3.7 kHz, and some breakup peaking at 15 kHz prior the high-pass rolloff. Figure 12 shows the on- and off-axis frequency response at 0°, 15°, 30°, and 45°. The driver demonstrates a really good off-axis response, better at 30° off-axis than the typical 1" dome device. Last, Figure 13 shows the AN2075’s two-sample sound pressure level (SPL) comparison, which is a close match to within less than 0.6 dB throughout the operating range.
For the remaining tests, I used the Listen SoundCheck analyzer with AmpConnect and the Listen 0.25” SCM microphone and power supply to measure the distortion and generate time-frequency plots. For the distortion measurement, I mounted the AN2075 rigidly in free air and used a noise stimulus to set the SPL to 94 dB at 1 m (14 V). Then, I placed the microphone 10 cm from the dust cap to measure the distortion. Figure 14 shows the distortion curves.

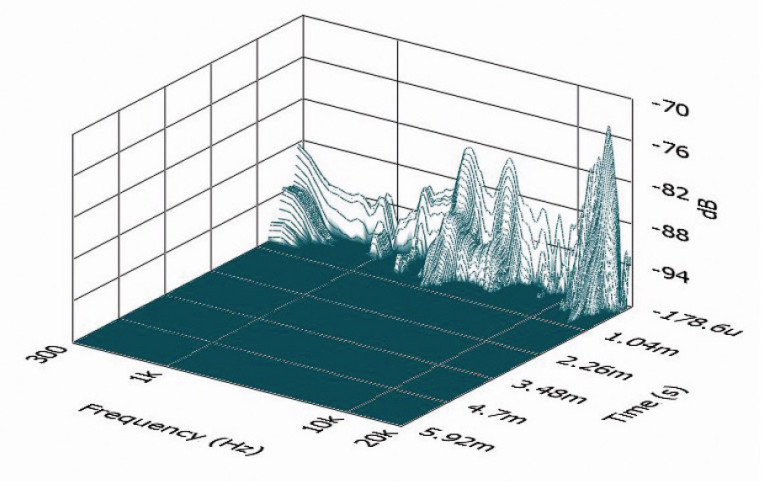
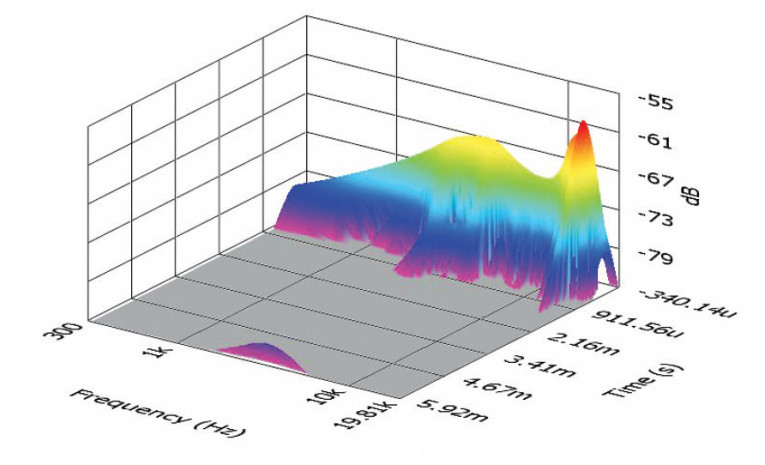
I used SoundCheck to get a 2.83-V/1-m impulse response and imported the data into Listens SoundMap time-frequency software (included with SoundCheck V. 12). Figure 15 shows the resulting cumulative spectral decay (CSD) waterfall plot. Figure 16 shows the Wigner-Ville plot, which I use for its better low-frequency performance.
The AN2075 is a well designed and well-crafted 2” full-range array driver. Given the popularity of line arrays in both MI and PA applications, this is an important product line for Celestion. For more information, visit www.celestion.com VC
This article was originally published in Voice Coil, February 2014.