

Beyma’s first solution, patented in 2007, was its Helicex cooling technology (Voice Coil, February 2008). After Helicex, Beyma created the Malt Cross, a new enhanced voice coil cooling system. The cut-away drawing in Figure 1 shows the Malt Cross consists of an air diverter/director mounted on the driver pole piece just above the pole vent. As air pumps in and out past the inside gap area between the voice coil former and the pole piece, it is immediately directed to the gap rather than being allowed to escape into the larger air volume below the dust cap.
Figure 2 shows a Klippel analyzer graph of the voice coil heating over time. The graph compares the new Beyma 12MC500 equipped with the Malt Cross air deflector to a similar 2.5” diameter voice coil 12” Beyma driver (the SM212). At 600-W input to each woofer driven after 30 min of operation, the Malt Cross-equipped woofer is about 110° cooler than the non-Malt Cross driver. The temperature differential between 5 min of operation vs. 30 min of operation is significantly less with the Malt Cross technology. Very cool (really, no pun intended)!
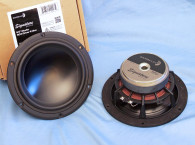
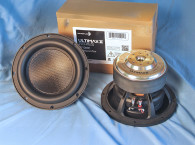
The Beyma 12MC500’s features include a proprietary Y-shaped five-spoke cast-aluminum frame, a waterproof coated (both sides) curved profile paper cone, a 3.75” diameter waterproof coated paper dust cap, and a 2.5” (63.5 mm) diameter non-conducting voice coil former. It also has a finite element analysis (FEA) optimized ferrite motor system with a 165-mm diameter and 25-mm thick ceramic ferrite magnet sandwiched between a black coated 12-mm front plate, a black emissive-coated T-yoke, a coated pleated three-roll cloth surround, and a 6” diameter coated cloth spider.
Beyma’s Mechanical Mirror Suspension System (MMSS) design software was used to design the spider and the surround. A 0.625” diameter pole vent (terminated to the Malt Cross deflector) and five 0.25” diameter peripheral vents provide the cooling. Last, the voice coil terminates to a set solderable terminals.


I used the LMS analyzer and VIBox to generate voltage and admittance (current) curves with the driver clamped to a rigid test fixture in free-air at 1, 3, 6, 10, 15, 20, and 30 V to begin analysis of the 12MC500 pro sound woofer.
As is the established protocol for Test Bench testing, I no longer (or at least seldomly) use a single added mass measurement. I use actual physically measured Mmd with 50% of the surround, the spider, and the lead wires removed. Note, I ran the sine wave at the 200-Hz given sweep voltage level for a set period of time to raise the voice coil temperature to the third time constant for that voltage level to better approximate actual operating conditions (10 s between sweeps 1–6 V, 30 s between sweeps 10–20 V, and 50 s between sweeps 25–40 V).
I further processed the 14 sine wave sweeps (two at each voltage level for each driver sample) by dividing the voltage curves by the current curves to produce impedance curves. Then, I used the LEAP phase calculation routine to generate the phase curves. I copy/pasted the impedance magnitude and phase curves plus the associated voltage curves into the LEAP 5 software’s Guide Curve library.
I used the LEAP 5 LTD transducer model to calculate this data’s parameters. Since virtually all manufacturing Thiele-Small (T-S) data is produced using either a standard transducer model or, in many cases, the LEAP 4 TSL model, I also generated LEAP 4 TSL model parameters using the 1 V free-air curve to compare it with the manufacturer’s data. Figure 3 shows the Beyma 12MC500’s 1 V free-air impedance plot. Table 1 compares the LEAP 5 LTD and LEAP 4 TSL T-S parameter sets for the Beyma’s two 12MC500 driver samples with the Beyma preliminary factory data.
Looking at the Beyma 12MC500’s comparative data in Table 1, the measured data varies slightly from the factory data, but it’s not bad considering the factory data was preliminary data. The XMAX stands out as a large variation, but Beyma’s formula for XMAX is (LVC - HAG)/2 + (HAG/2), which is Beyma’s way of adding in a fringe field approximation to the number, whereas I always use the pure physical XMAX.
I then used the LEAP LTD parameters to set up computer enclosure simulations for Sample 1. I set up two vented box simulations, a QB3 alignment with a 0.76-ft2 vented enclosure tuned to 65 Hz, and a larger extended bass shelf (EBS) alignment with a 1.34-ft2 vented box tuned to 53 Hz, both with 15% fiberglass fill material.
Figure 4 shows the 12MC500’s results in the two vented enclosures at 2.83 V and at a voltage level sufficiently high enough to increase cone excursion to 5.56 mm (XMAX + 15%). This resulted in a F3 of 88 Hz (F6 = 70 Hz) for the 0.76-ft3 box (suggested application could be a wedge-type floor monitor) and –3 dB at 68 Hz (F6 = 52 Hz) for the EBS enclosure.


Increasing the voltage input to the simulations until the maximum linear cone excursion was reached (XMAX + 15%) resulted in 125 dB at 100 V for the 0.76-ft3 simulation and 122 dB at 70 V for the larger vented enclosure. Figure 5 and Figure 6 show the 2.83-V group delay curve and the 100 V/70 V excursion curves, respectively.
Pat Turnmire, Redrock Acoustics, performed the Klippel analysis for the Beyma 12” woofer (the analyzer is provided courtesy of Klippel). The analysis produced the Bl(X), KMS(X) and Bl and KMS symmetry range plots shown in Figures 7–10. Figure 7 shows the 12MC500’s Bl(X) curve is nicely symmetrical and, like most pro sound drivers, not quite as broad as a really high XMAX device.
Figure 8 shows a small 0.7-mm coil-out (forward) offset at the rest position that increases to a 0.37-mm coil-out offset at the driver’s physical 4.75-mm XMAX. Figure 9 and Figure 10 show the 12MC500’s KMS(X) and KMS symmetry range curves. The KMS(X) curve is also symmetrical and has a 1.5-mm forward (coil-out) offset at the rest position that remains constant throughout the operating range. This is sometimes seen in cloth surrounds, but it is also possibly a small forward location of the voice coil at magnetic center. The Klippel analyzer calculated the 12MC500’s displacement limiting numbers for XBl at 82% (Bl = 5.9 mm) and for crossover at 50% (CMS minimum was 3.2 mm), which means compliance is the 12MC500’s most limiting factor for prescribed 10% distortion level.
Figure 11 shows the 12MC500’s inductance curve Le(X), which for a normal-type ferrite motor increases inductance as the voice coil moves to the rear. The inductance variance over the operating range (XMAX IN to XMAX OUT) is 0.03, which is minimal variation for this size driver. While it is not mentioned in the Beyma literature, the cut-away drawing shows a shorting ring installed on this driver, which would account for the low inductance variation.
With the Klippel testing completed, I mounted the 12MC500 in an enclosure that had a 17” × 17” baffle filled with foam damping material. I used a 100-point gated sine wave sweep to measure the driver’s on- and off-axis frequency response from 300 Hz to 20 kHz at 2.83 V/1 m. Figure 12 shows the 12MC500’s on-axis response is smooth and even up to 1.3 kHz with some small variations followed by the low-pass roll-off.


Figure 13 shows the on- and off-axis frequency response at 0°, 15°, 30°, and 45°. The 3 dB from the on axis to the 30° off-axis curve occurs at 1.9 kHz, which is about as high as you would want to crossover any 12” in a two- or three-way configuration and maintain a reasonably good power response. Figure 14 shows the 12MC500’s two-sample SPL comparisons, with results indicating a good match throughout its 2-kHz operating range.
For the final group of tests, I set up the Listen SoundCheck AmpConnect analyzer (courtesy of Listen), the SCM 0.25” microphone, and the power supply to measure distortion and generate time-frequency plots. To set up for the distortion measurement, I mounted the woofer rigidly in free-air and used a noise stiumulus (SoundCheck has a software generator and SPL meter as two of its utilities) to set the SPL to 104 dB at 1 m (6.9 V). Next, I measured the distortion with the SCM microphone placed 10 cm from the dust cap. This produced the distortion curves shown in Figure 15.
For the last 12MC500 test, I used the SoundCheck analyzer to obtain a 2.83 V/1 m impulse response and imported the data into Listen’s SoundMap time/frequency software (included in SoundCheck Version 12). Figure 16 shows the resulting CSD waterfall plot. Figure 17 shows the Wigner-Ville plot, which I use for its better low frequency performance details. For more information of this well-executed ferrite 12” driver and other Beyma pro sound products, visit www.beyma.com


This article was originally published in Voice Coil, October 2013.


