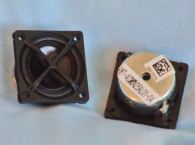


Recently, the company has also developed a series of small speaker drivers incorporated into integrated enclosures called “Sound Modules.” TB Speaker has more than 100 patented products/technologies. The 25-2234SD is a compact tweeter that features a 1” aluminum/magnesium inverted dome, a neodymium motor structure, an injection-molded faceplate (1.875” × 1.875”), a protective grill, and a rear cavity with magnetic fluid in the motor gap for cooling. The unit has an integrated circuit board with bare tinsel lead wires for connection (rather than the usual terminals), as it is assembled using a semi-automated production line, which results in excellent repeatable consistency.
I began analysis for the 25-2234SD by performing a 300-point LMS impedance curve shown in Figure 1. The impedance resonance for this tweeter occurs at a moderately low 673 Hz (factory spec is 850 Hz). With a 3.55 Ω DCR (Re) (factory spec is 3.6 Ω), with the minimum impedance for this tweeter measuring 3.71 Ω at 2.90 kHz.
Next, I mounted the 25-2234SD in an enclosure with a 4” × 9” baffle area and proceeded to measure the on- and off-axis SPL. I used the LMS analyzer to produce a 100-point 300-Hz-to-40-kHz frequency response curve. Data was then taken with sweeps at 0°, 15°, 30°, and 45°. Figure 2 shows the 25-2234SD’s on-axis response. The 25-2234SD’ frequency response was ±3.85 dB from 700 Hz to 17.27 kHz, with the primary breakup mode centered on 35 kHz.
Figure 3 depicts the on- and off-axis frequency response in the horizontal plane. Figure 4 shows the off-axis curves normalized to the on-axis response. Figure 5 shows the CLIO 180° polar plot (measured in 10° increments). The two-sample SPL comparison is illustrated in Figure 6, indicating the two samples were closely matched to within 0.75 dB throughout most of its operating range, with some minor 1.5 dB variation between 4 to 4.5 kHz.


For the last group of measurements, I again set up the Listen SoundCheck analyzer with the SCM microphone and AudioConnect preamp/power supply. I used the built-in pink noise generator with SLM utilities to set the SPL to 94 dB/1 m (4.46 V) and placed the 1/4" SCM microphone to 10 cm from the faceplate of the 25-2234SD. Next, I ran the distortion curves depicted in Figure 7 (red curve = second harmonic, blue curve = third harmonic).
For the final measurement, I performed an impulse measurement, and then imported the results into the Listen SoundMap software, windowed out the room reflections, and created the CSD plot shown in Figure 8 and the STFT shown in Figure 9. For more information, visit www.tb-speaker.com. VC


This article was originally published in Voice Coil, June 2018.


