 In this article series, we are examining ways to create a low-cost system for lab-grade audio electronics measurements. Now, I’ll discuss a few measurement examples to illustrate the power and the versatility of sound-card-based measurement. The first example I will discuss is a gain block for a hybrid tube gain block intended for a Recording Industry Association of America (RIAA) preamplifier. The second example takes a brief look at the distortion characteristics of a commercial preamplifier. The third is rather more outré — a gadget that is intended to plug in between a headphone amplifier and headphones, claiming to significantly improve the sound through means about which the manufacturer is rather unclear. And finally, to illustrate the usefulness of sound card measurement in the design process, I’ll explore the effects of load on power supply noise for a common IC regulator circuit.
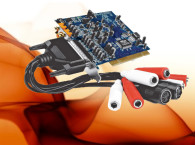
 These examples just scratch the surface, but it will give you an overview of some of the more useful ways that sound card measurement can be of use in audio testing. These measurements were all done with my M-Audio AP192 PCI card in a Hewlett-Packard PC with the “novel” mechanical modification shown in the first part of the series “Sound Cards for Data Acquisition in Audio Measurements” (audioXpress, June 2015).
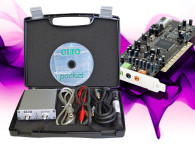
I used various bits and pieces of the software I mentioned before, but there is a definite slant toward the AudioTester—not because the other packages are less good (in some ways, and for some measurements, they’re better), but because at the time I took these measurements, it was the one I used day in and day out. (However, these days, I am using ARTA and Virtins more and more.) Familiarity breeds efficiency! Where a particular measurement was easier with different software, I bowed to the inevitable. The Millett interface box and a few improvised bits also make an appearance.
Preamplifier Gain Block Measurement
The preamplifier under test is a gain block of about 36 dB (A = 60) with balanced inputs and outputs. Since this is intended for phono preamp service, the likely input voltages will be in the millivolt range. So we will have two tasks: create a balanced input signal at the millivolt level (while maintaining a good signal-to-noise ratio) and measuring the output for noise and linearity.
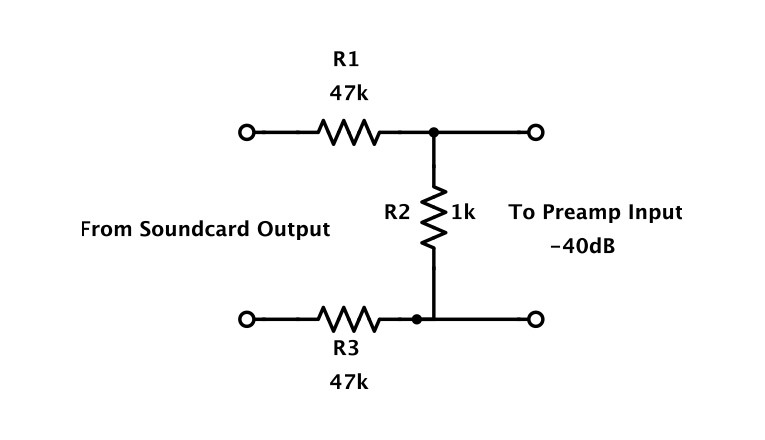
For the first task, the easiest way is to use the sound card output, but reduce the output level using the mixer controls or the level control in the measurement software. But “easiest” does not necessarily mean “best.” The problem is noise near our “sweet spot,” a nominal 1 V sound card output level, the signal-to-noise ratio (SNR) is somewhere close to 100 dB, which is excellent. But drop that output level 40 dB to 10 mV and the SNR ratio is more like 60 dB, which is likely to be noisier than the preamp that we want to measure. The solution is to create a balanced attenuator, which can easily be fabricated from three resistors. Figure 1 shows the one I used. The series resistors R1 and R3 were chosen to be large enough not to load down the sound card output (which is happiest with a 2 kΩ or higher load), but not so large that their parasitic capacitances become significant.
R2 was calculated by a simple voltage divider equation, but using the sum of R1 and R3 (which should be matched for best balance). To get realistic results, it’s nice to have R3 somewhere near the DC resistance of the source that is expected to be driving the preamplifier. In this case, the source will be a moving magnet phono cartridge, which is likely to have a DC resistance of about 1 kΩ. Set R1 = R3, and R2/(2 × R3) should be approximately 0.01 to get the desired 40 dB level reduction. So I set R2 to 1 kΩ and R1 and R3 to 47 kΩ (a standard value), which is very close.
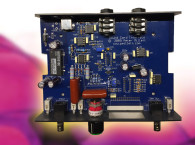
On the output end, we are taking the differential signal off the plates of a pair of tubes, so there’s a lot of DC (nearly 100 V). Also, the impedances are likely to be several thousand ohms, so we’ll need to buffer. In this case, I used both channels of my BUF03 box, with a channel sampling each leg of the preamp’s differential output. I connected the buffer box’s outputs to one channel of the sound card, taking advantage of the sound card’s balanced input.
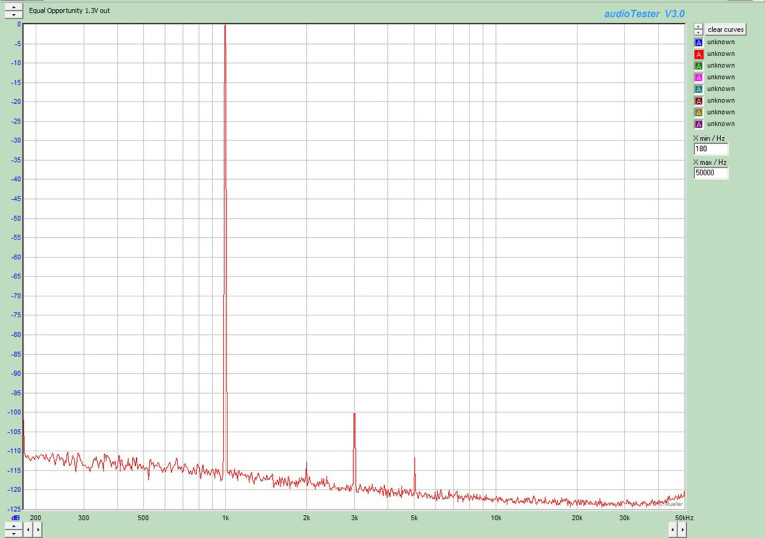
I took the basic measurements — the harmonic and intermodulation distortion, which provide a measure of the preamp’s linearity. Figure 2 shows the harmonic distortion spectrum for a 1 kHz sine wave at 1.3 V out (corresponding to 20 mV input from the attenuator and 2 V output from the sound card). As expected for a well-balanced differential circuit, the even-order distortion is nearly canceled, and the dominant harmonic is the third at slightly under –100 dB (0.001%). The vertical axis is set to be relative to the fundamental rather than relative to a voltage standard (e.g., 1 V).
AudioTester has a provision for calibration. Once that’s done, you can choose the display to show decibels relative to the highest peak in the spectrum, dBV (decibels with respect to 1 V), dBu (decibels with respect to 0.775 V), dB relative to full-scale, or dB relative to measured value at 1 kHz. Your choice.
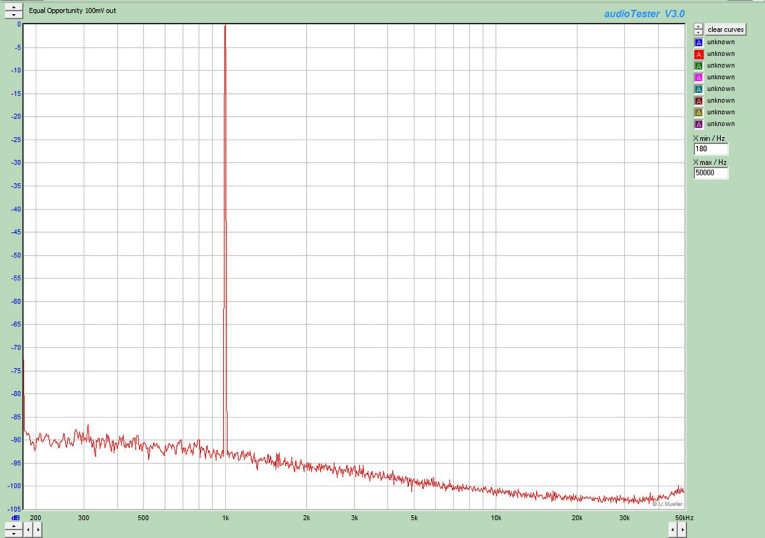
Figure 3 shows the distortion spectrum with the preamplifier’s output reduced to 100 mV. The noise floor is, as expected, 20 dB higher relative to the signal, but the distortion products seem to have largely disappeared. This measurement also indicates that the noise limitation in the measurement is not the sound card, but rather the preamp itself, so it’s a useful control measurement.
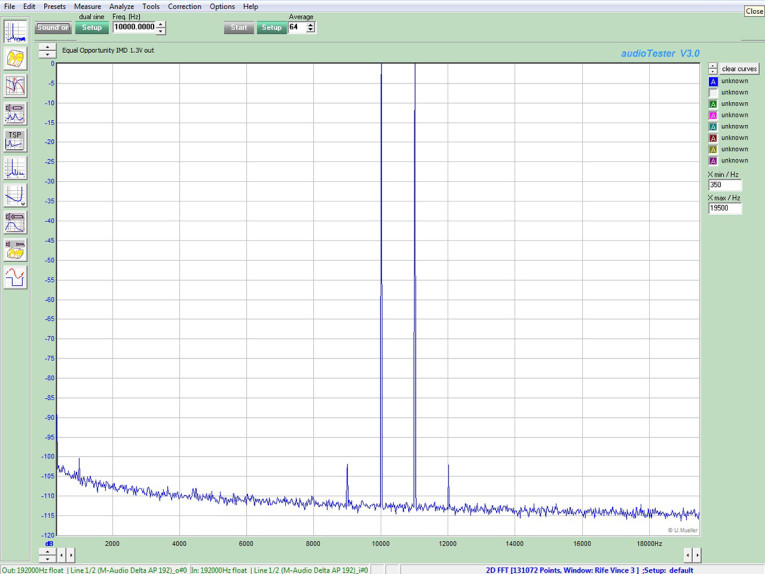
Turning to intermodulation distortion (IMD), AudioTester gives the option of a two sine wave measurement, with the ability to choose both frequency and relative amplitude of each of the two sine waves. I arbitrarily picked 10 kHz and 11 kHz at equal levels, and adjusted the sound card output to give a preamp output of 1.3 V. Figure 4 shows the spectrum I obtained. Intermodulation products can be seen at the difference frequency of the two sine waves (1 kHz) and as sidebands at 1 kHz above and below the radomly selected 10 kHz and 11 kHz test signals.
With the worst IMD product below –100 dB with respect to the test signals, I am not unhappy with this result. At this point, we’re starting to challenge the lowest limits of the test gear, and this is well under the floor of what most of the classic dedicated IMD test sets could measure.
Line Amplifier Measurement
My doctor is an audiophile, and I occasionally do repair work for him as a favor (and in exchange, he does repair work on me). In this case, he bought a used 1980s vintage Nakamichi preamplifier that needed a bit of TLC to get it working like new. Out of curiosity, I wanted to see how its distortion looked.
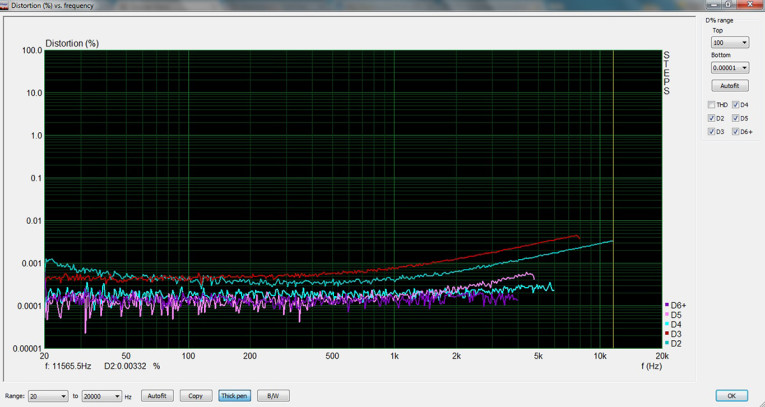
I set the line stage gain to unity (using the volume control) and fed in a 2 V signal from the sound card. The STEPS software from ARTA has a nifty capability that measures each distortion harmonic as a function of frequency, which is a useful way of uncovering the dominant distortion mechanisms. Figure 5 shows a screen capture of the measurement. Several things can be inferred from the data, the first being that the overall distortion is quite low, better than 0.001% at midband. The third harmonic is dominant, suggesting that the circuit has a complementary or push-pull topology (since odd-harmonic distortion is symmetrical on the top and the bottom of the test waveform). The second harmonic rises slightly at low frequencies, suggesting that the coupling capacitors used may be polar electrolytics, which would be expected to show higher distortion at low frequencies, with the distortion being non-symmetric on the positive and negative halves of the waveform.
The overall distortion rises with increasing frequency, which is likely a function of the preamp’s compensation causing a rolloff of open loop gain (and hence reduced feedback) at higher frequencies. That’s a lot of information from a quick measurement!
Measuring a Tweak
The headphone gadget under test comprises a 0.25” stereo phone jack and plug situated on opposite ends of a plastic tube. The user inserts the plug end into the headphone output jack of a headphone amplifier or a similar source, and the headphones plug into the gadget’s jack. The manufacturer makes some claims about “maximizing your enjoyment with increased resolution and smoothness in the world’s most holographic headphone experience.” I’m not sure quite what that means, but any actual sonic changes that the gadget might do would have to be reflected in an electrical measurement. You can’t change the sound without changing the signal. It seems reasonable, given a generous reading of the claims, to measure frequency response and distortion (tonal balance), crosstalk (imaging), and noise to see if the device has any effect on these audible parameters.
And, that seems like a good range of tests to show what our sound card measurement system can do. A preliminary electrical test showed that the jack’s terminals directly connect to the plug’s corresponding terminals (resistance between corresponding terminals was in the milliohm range) and an ohmmeter check showed an open circuit between right hot, left hot, and common. For the crosstalk, noise, and distortion tests, the device was plugged into a unity gain headphone amplifier of my own design (basically an emitter follower with an FET input), which features very low noise and distortion.
For a load, I wanted to simulate a set of headphones. The manufacturer claims that the device was “voiced” using Sennheiser HD 800 headphones, which have a nominal impedance of 300 Ω. The published impedance curve shows about 300 Ω in the midrange, with the impedance rising in the treble because of the inevitable inductance of the headphones’ voice coils.
A few minutes with a calculator suggested that the inductance was likely to be 1.5 to 2 mH. So I put a 300 Ω resistor in series with a 1.7 mH inductor to use as a dummy load to simulate the headphone load. (I chose the value using the rigorous scientific process of seeing what was in my box of coils.) To make sure the proposed dummy load really looks like the impedance curve of the headphones, I measured it with my sound card system. Headphone jacks and plugs are single-ended rather than balanced, so I used adapters on the sound card balanced input and output to accommodate this. For convenience, the adapters I used terminated into RCA plugs. This is also convenient for measuring conventional single-ended audio equipment (which is the vast majority of consumer audio), but you could just as easily use mono 0.25” phone plugs.
Figure 6 shows the test setup with AudioTester, which I used to measure impedance. The sound card left channel output is used for applying the test signal through a 1 kΩ resistor. AudioTester recommends using a resistor of similar value to the expected impedance. Since the impedance varies with frequency, this seemed like a reasonable value. You could probably use anything between 300 to 1,500 Ω and get a good result, but the higher values present a friendlier load for the sound card output. In any case, the resistor value is entered into the test setup window of the software.
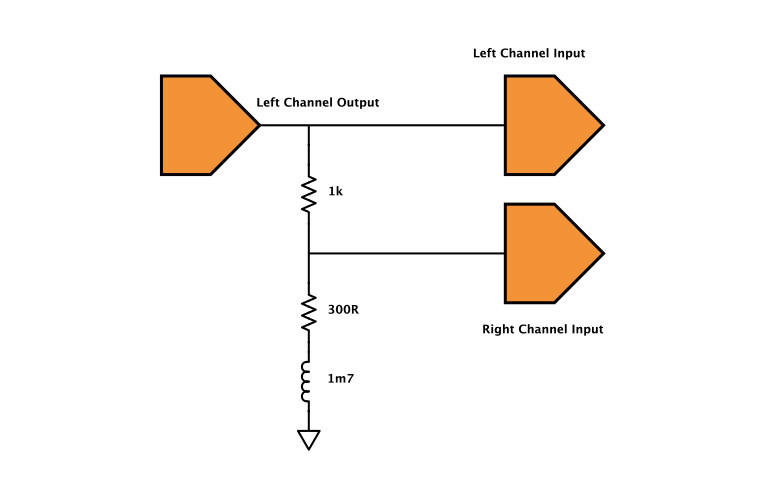
For cases where the impedances are low (e.g., speaker testing), a small power amplifier is driven by the sound card output, the fixed resistor and the load are connected to its output, and the sound card inputs are connected as shown in Figure 6. The sound card left and right inputs are connected across the excitation signal and the dummy load, respectively. The sound card generates a stepped set of tones spanning a user-specified frequency range and number of steps (also entered into the setup window of AudioTester in the impedance measurement mode). The impedance measurement is performed by measuring the voltage across the known-value series resistor and the voltage across the load. Then, use the voltage divider equation to calculate the load impedance as a function of frequency.
In theory, this can be done using an impulse or MLS excitation rather than swept or stepped sine waves. This is also how some other software packages perform the impedance measurement. The advantage to that approach is measurement speed, but you have to always be aware of resolution issues, especially at lower frequencies.
The stepped frequency method has the advantage of being able to choose steps that are either linear (i.e., the test frequencies are evenly spaced) or logarithmic (the test frequencies are fixed portions of an octave). One might choose the latter for a loudspeaker impedance measurement to get better resolution in the bass while not wasting a lot of measurement time with higher-than-needed frequency resolution in the treble. The difference in impedance between 20 Hz and 30 Hz is a lot more important than between 19,960 Hz and 19,980 Hz!
Tip: If your software uses Fourier Transform (FT) or maximum length senquence (MLS) for an impedance measuring signal, a nice way to increase bass resolution (at the expense of high-frequency bandwidth) is to drop the sampling rate. For example, if you set the sample rate to 32 kHz, you’ve lost most of your information above 15 kHz. But for a set sampling rate, the low-frequency extension and the resolution will be better by a factor of three compared to 96 kHz.
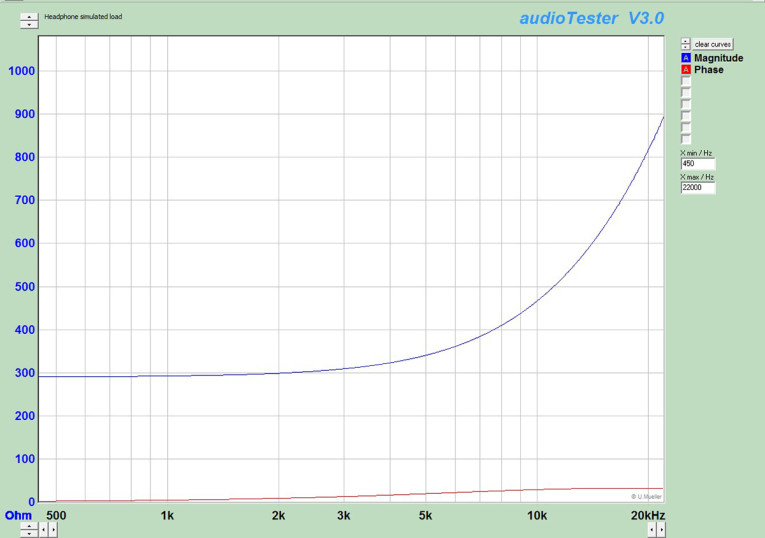
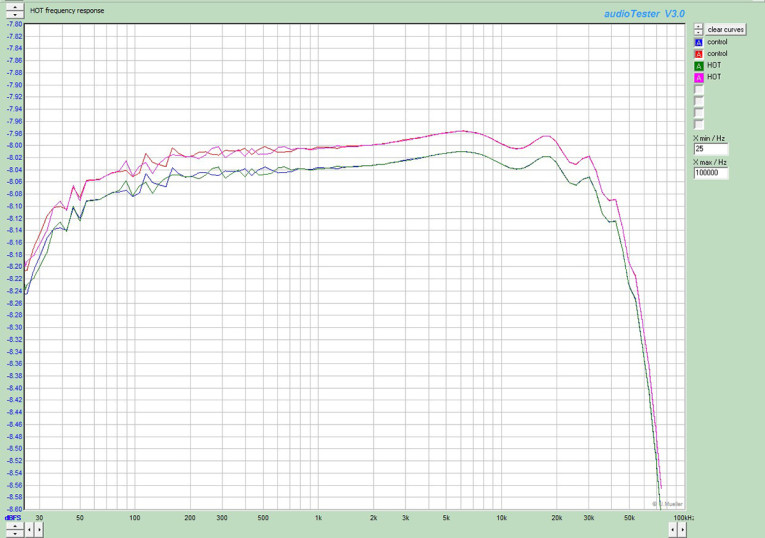
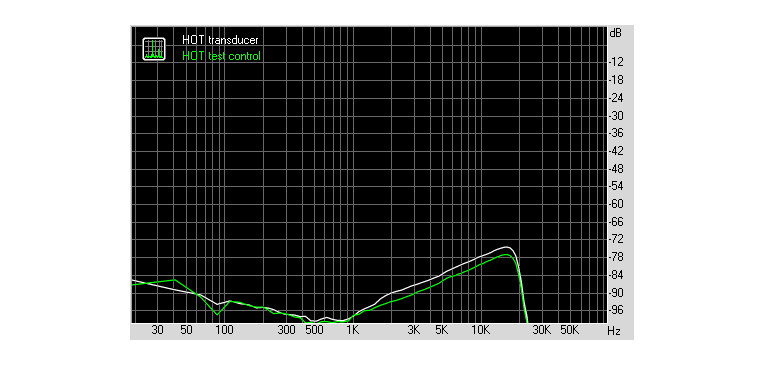
Figure 7 shows the resulting impedance vs. frequency. It resembles the impedance curve of electrodynamic headphones through midrange and treble frequencies, where we would expect to see the claimed effects of the headphone “enhancement” device. Once I established the impedance curve was reasonable, I began measuring frequency response with and without the device in circuit to see if it had any equalization properties. Figure 8 shows the results of a swept sine wave frequency response measurement using AudioTester, both with and without the device inserted. As can be seen, there is no significant difference (this measurement exposes a minuscule 0.02 dB difference in gain between the channels of the sound card, but that difference is not altered by the device). So clearly, the device does not provide any significant equalization.
When one hears terms like “holographic” in the context of headphones, thoughts immediately turn to some sort of cross-feed circuit, where signals are leaked between channels, perhaps with alterations of phase or some filtering. To test this hypothesis, I ran a crosstalk measurement using the RightMark Audio Analyzer (RMAA). Figure 9 shows the results. The slight rise in crosstalk at higher frequencies is likely due to capacitive coupling between channels, but again, there’s no real difference with or without the device inserted. So clearly, the device does not provide any significant cross-feed.
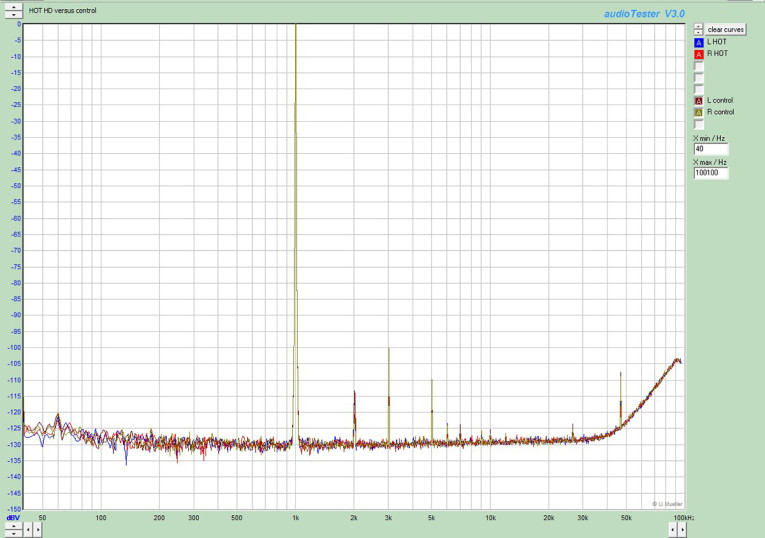
Perhaps there’s some sort of nonlinear function involved? Noise reduction? There’s one way to find out and that’s to measure! First, I did a harmonic distortion measurement. Figure 10 compares the 1 kHz harmonic distortion spectrum at 1 V, with and without the device inserted. The spectra overlay perfectly, and the noise floor is unaffected (and I might modestly comment that my little headphone amplifier seems to perform pretty well, with only slightly more than 0.001% THD).
Maybe there’s something going on at a higher frequency? And a more complex test signal might unravel the device’s secrets? For a test signal, I chose a combination of 18 kHz and 19 kHz sine waves to expose any IMD changes and the effects of any high-frequency harmonic distortion. Figure 11 shows the results. As before, the distortion is quite low (0.005% or so), but neither the distortion nor the noise floor seem to be at all affected by the device.
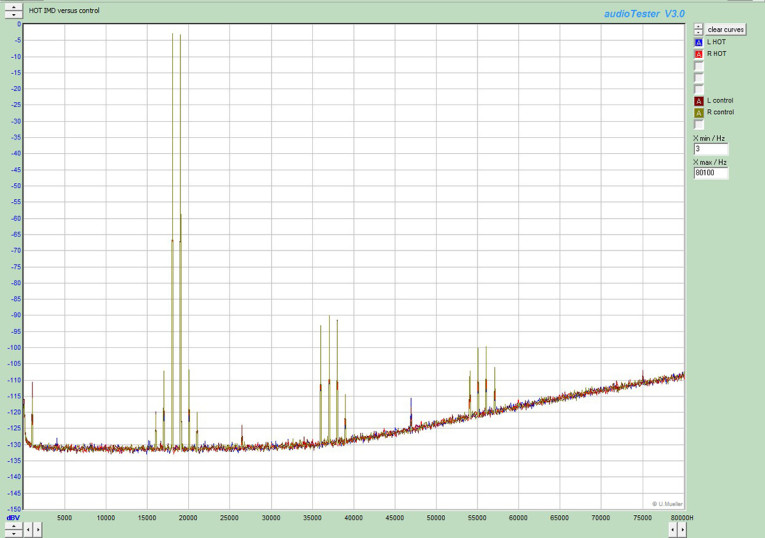
device. The test signal is 19 kHz/20 kHz dual sine wave. There is no significant change.
With no changes in frequency response, crosstalk, noise, harmonic distortion, or IMD, the device apparently does not have any significant effect on the signal flowing through it, not atypical for audio “tweaks.” But I don’t feel that these measurements are wasted. Not only do they give a nice illustration of the power of sound-card-based measurement, they showed me that my little prototype headphone amplifier is a pretty high-performance unit!
Power Supply Noise
This is a lively topic of discussion among audiophiles, and having a sound-card-based measurement system will enable you to see what effect changes in a power supply design will have on output noise by examining the output noise’s frequency-domain spectrum. You could also use the sound card to measure supply output impedance by injecting a signal into the supply output from a source with a known impedance and measuring the resulting supply output. If you’re ambitious, you could even do this with a pulse signal, then a Fourier Transform into the frequency domain to get an impedance vs. frequency curve. I didn’t do that here due to some time limitations, but it would be a great use of the sound card measurement capability.
In this measurement set, I was interested in the effects on noise and line rejection from loading the output of the power supply. Because the power supply output impedance and the DC voltage were low, I was able to run this measurement with the “bare” sound card and no interface box. The power supply under test was a simple 15 V raw supply fed into an LM317 regulator set for a 10 V output. I measured the output with no load (other than the set resistors of the LM317 circuit, which drew about 10 mA) and then with a 500 mA load. Figure 12 shows the results.

The lower curves show the sound card without any input (control). The upper two curves show the power supply’s output with and without loading. Both have a small 60 Hz peak (–110 dBV), probably due to radiative pickup in my test setup. The overall noise floor runs about 6 dB above that of the sound card alone. With loading, two effects appear: the noise at frequencies above 13 kHz increases about 4 dB and the power supply ripple frequencies (multiples of 60 Hz) increase by about 20 dB. They’re still low, but if low noise at these load currents is important in a design, I can now quantify any changes I make in the power supply circuit.
Summing Up
With a very low expenditure, the modern audio amateur or semi-professional can have a measurement capability more powerful than the best labs of the last century. With some minimal external hardware and free or inexpensive software, and recognizing bandwidth limitations, you can have a top-quality virtual spectrum analyzer, impedance bridge, oscilloscope, real-time analyzer, and signal generator capable of parts-per-million measurements. And when you get bored, you can use your test equipment center to play Solitaire! ax
Author’s Acknowledgments: I would like to thank Pete Millett for the boards, case, and critical parts for his excellent little interface box; the kind folks at ARTA and Virtins for generously providing me with their software; Jan Didden, Ladislav Bunta, Scott Wurcer, and Pavel Macura for advice and input; John Curl for the gift of two BUF03 ICs; and all of the wonderful people at Nicolet (especially their erstwhile Chief Scientist, Dr. Warren Vidrine) for teaching the much younger me everything I know about measurement.
Resources
S. Yaniger, “Sound Cards for Data Acquisition in Audio Measurements,” audioXpress, June 2015.
———, “The Equal Opportunity Preamplifier,” Linear Audio, Volume 8, 2014.
Sources
Audio Measurement Analysis Software
ARTALABS | www.artalabs.hr
Millett Interface Box
DIY Audio Home | www.pmillett.com/ATEST.htm
RightMark Audio Analyzer
iXBT.com | http://audio.rightmark.org/products/rmaa.shtml
M-Audio AP192 PCI card
M-Audio | www.m-audio.com/products/view/audiophile-192#.Vfbr6RFVhBc
Virtins Multi-Instrument
Virtins Technology | www.virtins.com
This article was originally published in audioXpress, November 2015.


