
Sound waves are rapid changes in air pressure to which our ears respond. Therefore, SPL stands for sound pressure level, though you’ll sometimes see the devices that measure SPLs called Sound Level Meters (SLM). Because SPL meters are “reference” devices, they must be calibrated at the factory using known absolute volume levels. The Galaxy meter is accurate to within ±2 dB, which is reasonable for an inexpensive meter. SPL meters can be calibrated by an independent lab for a fee, but that’s not needed for casual use (e.g., matching loudspeaker levels in a stereo system or home theater). What matters is consistency from one reading to another more than absolute accuracy.
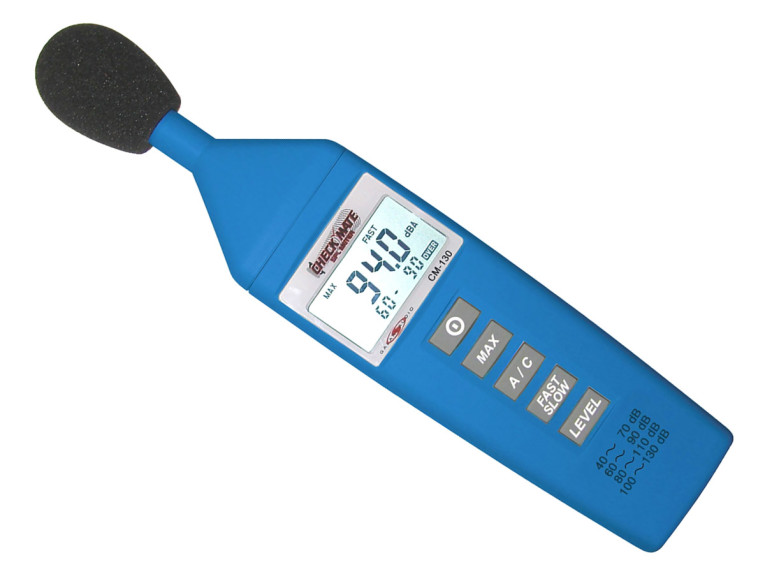
In truth, SPL meters are quite simple — a built-in microphone and a preamplifier connect to a readout that displays the absolute sound level in decibels. The Galaxy meter can measure levels between 40 and 130 dB, which is adequate for home use (see Photo 1). Most SPL meters have a switch to accommodate a range of sound levels, though some cover a large decibel span without switching. When used to measure absolute volume levels, some common applications include:
• Ensuring your rock band’s outdoor gig doesn’t exceed the maximum volume allowed by local ordinance
• Law enforcement use for the same reason
• Highway engineers to assess pavement surface noise, or when designing barriers to shield nearby houses
• In a recording studio to ensure consistent monitoring levels from one mixing session to another
• As a reality check for how loud you’re listening to music to avoid hearing damage
• To brag to your friends about how loud your system can play
An SPL meter is also useful for assessing relative levels (e.g., to calibrate your stereo or surround system to ensure that all loudspeakers play at the same volume level). Calibration products, such as the DVD Essentials test DVD that I use, include signals that play through each speaker one at a time. This lets you set identical levels from each speaker and adjust your subwoofer’s volume relative to the main speakers.
You simply place the SPL meter where your head would be while listening, then play that section of the DVD. As each speaker sounds the test signal, you can adjust your receiver so the volume from all the speakers is the same.
Unlike the directional microphones commonly used by singers and radio announcers, SPL meters contain an omnidirectional microphone that responds more or less equally to sound arriving from all directions. In theory, it shouldn’t matter which way the meter is pointed, though all omni microphones have a flatter response for sound arriving from the front.
When balancing speaker levels in a stereo system, pointing the microphone straight ahead equally favors the left and right speakers. Neither speaker is on axis to the microphone, but the angle and resulting response errors are the same. However, when balancing speaker levels in a surround system, the convention is to point the microphone straight up, with the microphone’s element at the same height as the tweeters in each speaker. Again, this ensures the same response for all speakers, even if that response is not perfect. However, when verifying frequency response, it’s best to play one speaker at a time and point the microphone straight at it.
Calibrating Loudspeaker Levels
When using an SPL meter to calibrate loudspeaker levels, you can use either static sine waves or pink noise as the test signal. A sine wave used for level adjustment is usually 1 kHz, which is the center of the midrange. The meter displays a number corresponding to the volume at its microphone. However, sine waves are not a good choice for matching speaker levels because they cause standing waves in the room. Standing waves create peaks and deep nulls in the response that are highly positional. If you play a 1-kHz sine wave and note the level on the meter, then move the meter only a few inches, the level will likely be very different.
Room acoustic treatment — especially absorption at reflection points — reduces the level difference at nearby locations, but doesn’t completely avoid it. Therefore, a much better signal source for matching loudspeaker levels is pink noise, which contains all frequencies. If the SPL meter’s microphone happens to be in a null location for 1 kHz, a nearby frequency (e.g., 1.1 kHz or 912 Hz) will not be in the same physical null. Therefore, the main advantage of pink noise is its inherent averaging of volume level vs. frequency vs. location. Taken as a whole, the measured volume will be fairly accurate.
Pink noise contains all audio frequencies and sounds like tape hiss. Unlike white noise that contains equal energy at every frequency, pink noise is filtered to have less treble. Technically, the level falls at a rate of 3 dB per octave, so each octave contains the same energy level as all other octaves, rather than the same energy for each single hertz of bandwidth. Pink noise is less irritating to listen to than white noise. You can also play pink noise louder without damaging your tweeters. The DVD Essentials DVD that I mentioned earlier filters the pink noise to contain only midrange frequencies. The bass response in most domestic-size rooms wildly varies with position — much more than in the midrange — so filtering the noise ensures more consistent and reliable readings when used for matching speaker levels.
While pink noise is better for speaker level matching than sine waves, there’s one drawback. Because noise is by definition random, the volume constantly fluctuates. So when viewed on a conventional signal meter, such as the volume unit (VU) meter in a cassette deck, the needle dances around making it difficult to read.
The variance is typically several decibels, though it can be 5 dB or more at very low frequencies. So, the meter might display 80 dB for a moment, then 77 dB, then 84 dB, and so forth. To get the true picture, you need to carefully watch the meter for 10 s or longer and mentally average all the numbers. This is another advantage of filtered pink noise containing only midrange frequencies. It is also why I prefer modern digital SPL meters over older analog models. A digital meter averages the variations over time for you.
Room Acoustic Measurements
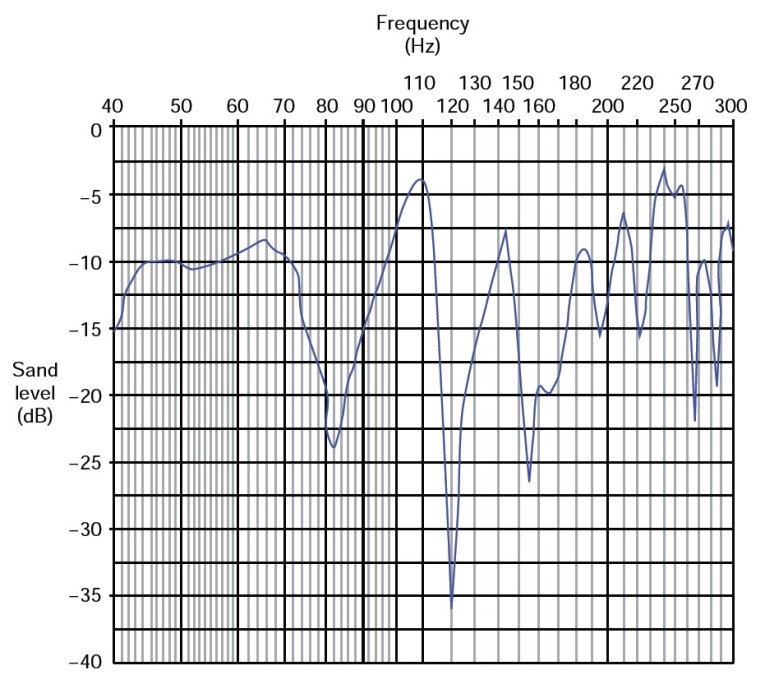
Most people have no idea how much their listening rooms influence the frequency response of their systems. Numerous peak/null spans of 20 dB or larger are typical, especially below 300 Hz. It astounds me that people will obsess over frequency response errors of less than 1 dB in electronic gear yet totally ignore a typical room response (see Figure 1). Note the peak/null pair at 110 and 122 Hz where the response varies a staggering 32 dB across a range smaller than one musical whole step!
There are two basic ways to measure a room’s acoustic properties. The simple method plays test tones at many different frequencies, which you monitor on the SPL meter and draw as dots on semi-logarithmic graph paper. That’s how I measured the response shown in Figure 1. The most accurate way to measure room and loudspeaker response is with individual sine waves at 1 or 2 Hz increments for 300 Hz and below, and pink noise in third or sixth-octave bands for frequencies above 300 Hz. You can buy test tone CDs having sine waves at each of the 31 standard third-octave frequencies, but I do not find them useful. For example, the room response shown in Figure 1 has a peak at 110 Hz and a very deep null at 121 Hz. But the standard third-octave test frequencies are 100 Hz and 125 Hz. So measuring at only 100 Hz and 125 Hz completely hides the true response.
Furthermore, sine wave levels are highly positional at all frequencies so such test CDs are not useful at mid and high frequencies either. Other commercial test CDs contain pink noise filtered into each standard third-octave band. While that works fine at mid and high frequencies, third-octave averaging lacks sufficient resolution at bass frequencies to see the true response. This is why I recommend sine waves for low frequencies and filtered pink noise above 300 Hz. A set of low-frequency MP3 files for creating your own bass-range test tone CD is available for free from my company’s website (www.realtraps.com/test-cd.htm).
Modal Ringing Decay Times
Room acoustics arguably affect a stereo or home theater system’s sound more than any of the electronic components. Therefore, measuring room acoustics is an important use for SPL meters. So far we’ve considered only frequency response. However, properly assessing room acoustics also requires measuring in the time domain. Many people use an SPL meter as a microphone to feed a computer sound card and software for room measurements. If an SPL meter has a line-level output, it can plug directly into a sound card’s line input without a separate microphone preamp.
The Galaxy 130 does not have an output jack, though the more expensive model 140 does. There are many SPL meters to choose from, so if you’re purchasing a meter to use with room measuring software make sure it includes this feature.
Several affordable programs are available for measuring room acoustics. The advantage of software vs. using simple test signals and an SPL meter is to measure frequency response and modal ringing and reverb times. Room measuring software also identifies the arrival time of individual reflections to help determine where they come from so you can apply absorption or diffusion there. Home-sized rooms don’t have true reverberation such as those that occur in auditoriums or gymnasiums, but the same metrics are often used. In small rooms, reflections from the walls, floor, and ceiling create individual echoes that decay fairly rapidly vs. true reverb that first swells over time and then decays.
I use a freeware program called Room EQ Wizard (REW) that’s available in versions for Windows, Mac OS, and Linux. Although REW is intended mainly for adjusting an equalizer to compensate for poor bass response, it’s a full-featured room analysis program in its own right. For Mac users, I also recommend FuzzMeasure Pro. Originally from SuperMegaUltraGroovy, this software was acquired by Rode Microphones and is now available here.
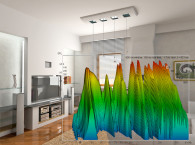
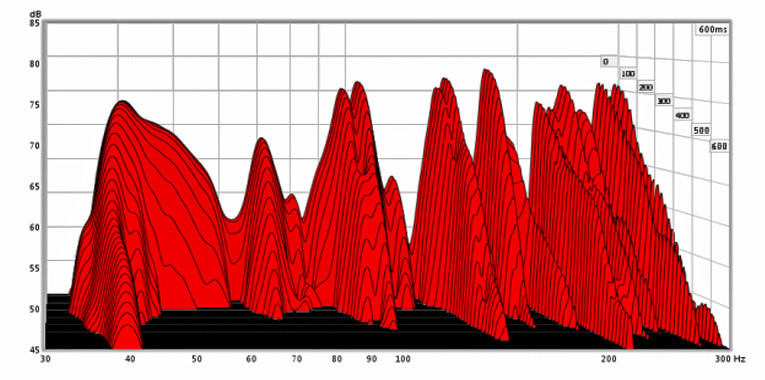
Unlike the simple response graph shown in Figure 1, room measuring programs can also display modal ringing using a waterfall plot. Ringing at bass frequencies is a major problem in small rooms because it causes some, but not all, bass notes to linger after the bass player stops the note. This is similar to the “boing” sound you get when you clap your hands in an empty room or stairwell, but it occurs at low frequencies.
Modal ringing is caused by room modes, which are resonances that occur at frequencies related to the room’s dimensions. Figure 2 shows a pair of REW graphs I measured in the RealTraps test lab when it was completely empty. All that was in the room was one loudspeaker, the measuring microphone, a laptop computer, and, of course, me. This room is 16‘ × 11.5’ × 8’ high. The response is just as terrible as the response graph shown in Figure 1.
Figure 2b shows the same frequency response as Figure 2a, but it also includes the decay time of each mode frequency. In this type of graph, the “mountains” come forward over time. With a waterfall graph, you can see that each response peak is accompanied by sustained ringing that decays slowly over time. Ringing is a big problem because it causes some bass notes to sustain and overlap subsequent notes. This results in the indistinct and muddy sound commonly known as “one-note bass”—no matter which note is playing, the room’s ringing sounds at the same frequency.
And because the notes linger, there’s more total energy in the room at those frequencies. Using simple test signals and an SPL meter only measures the frequency response and ignores the ringing. Likewise, using hand claps to assess a room by ear creates mostly higher frequencies, so that won’t reveal modal ringing either.
Microphone Accuracy
It’s worth mentioning that inexpensive SPL meters use inexpensive microphones that are not as accurate as professional microphones. Fortunately, most budget meters are fairly accurate at bass frequencies, although above 1 kHz, they’re typically much worse. I use a precision DPA 4090 microphone for room testing; but it costs a lot more than the Galaxy meter. However, even if the microphone in an inexpensive meter is not fully accurate, it’s still useful to assess relative changes (e.g., to see how the response and ringing in your room improve as bass traps and other acoustic treatment are added).
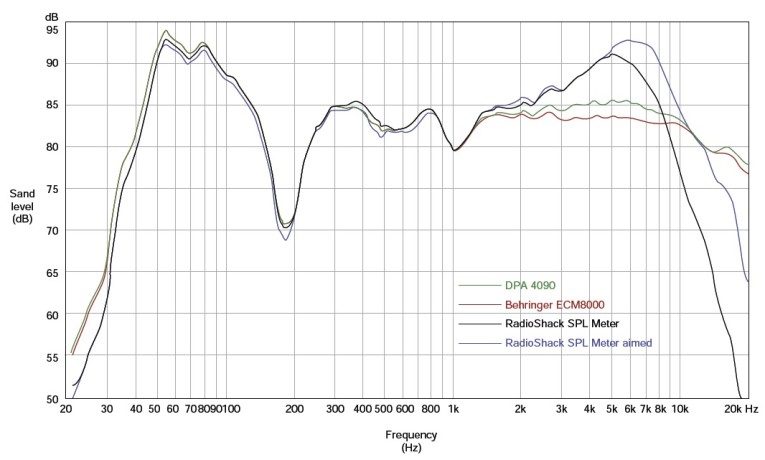
Figure 3 shows a frequency response comparison of four different microphones. The deviation from a flat response below 2 kHz is mainly due to the acoustics of the room in which the microphones were measured. So even if a particular microphone is perfectly flat, its response will not appear flat in the graphs due to the room and loudspeaker. However, the relative responses are valid, letting you compare how closely the inexpensive microphones match the expensive and highly accurate DPA model.
For the experiment, I compared an expensive DPA 4090 used by professional acousticians, a popular but inexpensive Behringer ECM8000, and a RadioShack digital SPL meter. In all but one test, the microphones were pointed straight down, perpendicular to the loudspeaker (a Mackie HR624) at tweeter height. To show how the high-frequency response improves on-axis for an inexpensive omnidirectional microphone, the fourth plot shows the same RadioShack SPL meter pointed directly at the loudspeaker.
For consistency the plots were adjusted to the same level at 1 kHz. As you can see, all of the microphones are pretty consistent up to about 1 kHz, but the inexpensive SPL meter substantially deviates at higher frequencies. You’ll find “calibration” tables on the Internet claiming to compensate for the inaccuracy of various SPL meters and microphones, but those are mostly worthless if well-intentioned. Figure 3 shows the RadioShack meter’s response is fine at bass frequencies, so no correction is needed. And above 1 kHz, it’s unlikely that these meters are consistent from unit to unit for various reasons. So there’s no assurance that someone else’s meter has the same high frequency response. Further, properly measuring a microphone’s response is not a trivial task! I can’t imagine that most people who post correction curves are skilled enough or have the tools to do that correctly.
Many other microphones (and SPL meters) are suitable for room measurement, in a variety of price ranges, including models from Earthworks, Nady, Dayton, and others. An article I wrote, “Measuring Microphones: Ten Omni Microphones Compared,” on the RealTraps website details how the frequency responses shown in Figure 3 were measured, and includes more microphone models.
Nuts and Bolts
When used as a microphone front end for software room analysis, the only knob you need to adjust on an SPL meter is the range. It’s best to set your sound card’s software mixer for maximum input level, then use the range switch to control the actual signal level. For other SPL meter applications, it helps to understand the various options.
The weighting switch selects one of two or three response curves that bias the display. Our ears hear midrange frequencies more readily than bass or treble, so when the goal is to assess perceived volume — how loud something actually sounds — the A-weighting curve is preferred. With A weighting, sound containing mainly midrange frequencies displays a higher value than very low or very high frequencies at the same SPL.
But when measuring the frequency response of a loudspeaker or room, you’ll use C (sometimes called Z) weighting because you want the true response. Many meters also let you select a fast or slow display response time. A slow response is usually better because it keeps the displayed level more consistent.

a comprehensive set of measurement
types required by professional acousticians.
When absolute accuracy is needed, professional acousticians use a calibrated SPL meter with a known flat-frequency response. The NTI Audio XL2 meter is that and much more (see Photo 2). The XL2 boasts a frequency response (–3 dB) from 4.4 Hz to 23.6 kHz, over a volume range of 17 to 153 dB SPL depending on the microphone option chosen. In addition to serving as an SPL meter with an accuracy of 0.5%, the XL2 also displays frequency response, reverb times in third-octave bands, harmonic distortion, and absolute polarity.
It also offers real-time analysis (RTA), Fast Fourier Transform (FFT) spectrum analysis, and audio recording for later analysis. It can even serve as an oscilloscope. As the British say, this is a serious piece of kit!
The main advantage of a meter such as the XL2, besides accuracy, is that it’s small and totally self-contained. For a professional acoustician who measures sound every day in disparate locations both indoors and out, carrying a laptop, a microphone, and an external sound card with a phantom powered preamp quickly grows old. Some external sound cards can be powered by a computer’s USB port, but many laptops do not provide enough current. The USB specification requires USB ports to provide up to 500 mA, but many laptops fall short of that, and thus, cannot power an external sound card. So then, you need AC power just for the sound card. The XL2 will run for more than 4h on the included rechargeable battery. And while its built-in display is smaller than a laptop’s, it clearly shows everything needed. It can also save measurement data and screen images for later transfer to a computer.
Figure 4 and Figure 5 show noise and reverb time measurements in my rather large home studio. This room is on my home’s second floor. The furnace and air blowers are in the basement two floors below. So even when the heat or air conditioning is on, the residual noise is very soft at most frequencies. Figure 4 shows the noise in third-octave bands, but note the A and Z levels at the bottom right. The A level is the sum of noise at all frequencies with A-weighting applied, while the Z level is unweighted reflecting a greater contribution from lower and higher frequencies.
Reverb time is also known as RT60, because its decay time is defined by how long it takes for the sound to decay by 60 dB after it stops. Since very few rooms are quiet enough to measure sound over a 60 dB range, it’s common to measure only the first 30 dB of decay. Reverb decay time is linear, so doubling the time measured for the sound to drop by 30 dB results in the correct RT60 value.


EQ Will Not Improve Room Acoustics
Because so many people use SPL meters for measuring room acoustics, I’ll conclude by explaining why you should not try to equalize a system for a flat-frequency response. It may seem that an equalizer could be used to reduce peaks and raise nulls to obtain a flat response from your loudspeakers and room. But in practice, it rarely works as expected.
And, using EQ often results in worse perceived sound, not better. One problem is that peaks and nulls are highly positional. So any correction you apply will be valid for only a very small physical area. Indeed, it’s not even possible to obtain the same response at both ears in most rooms.
Moreover, modal ringing as mentioned earlier is at least as damaging as the peaks and nulls, and EQ cannot improve that. Nor can EQ counter nulls that are typically 10 to 30 dB deep without blowing up your amplifier and speakers. Some systems claim that using sophisticated DSP overcomes the shortcomings of equalizers, but in truth they suffer from the same problems for the same reasons. The more correction that’s applied, the smaller the improved physical area becomes. So, using such a device is guaranteed to make the response worse elsewhere in the room, even the next seat over on a couch. The only place an equalizer makes sense is below around 40 or 50 Hz, where conventional bass traps tend to be less effective. Even then, an equalizer should be used to reduce peaks only—never to raise a null. aX
This article was originally published in audioXpress, March 2015.
 About the Author
Ethan Winer has been a professional musician, composer, circuit designer, recording engineer, audio instructor, computer programmer, technical writer, and consultant since the 1960s. His book The Audio Expert (Focal Press, 2012) is a comprehensive reference covering all aspects of audio, with many practical as well as theoretical explanations. Ethan has also written more than 100 feature articles for audio, music, and computer magazines. When he’s not playing his Fender Telecaster electric guitar, Ethan designs acoustic treatment products for RealTraps, in New Milford, CT. Contact him at www.ethanwiner.com or www.realtraps.com.
Resources
J. Mulcahy, Room EQ Wizard, www.roomeqwizard.com.
Joe Kane Productions, Digital Video Essentials, www.videoessentials.com.
RealTraps, RealTraps Test Tone CD, www.realtraps.com/test-cd.htm.
SuperMegaUltraGroovy, FuzzMeasure - now Rodetest.
E. Winer, “Measuring Microphones: 10 Omni Microphones Compared,” www.realtraps.com/art_microphones.htm.
Sources
ECM8000 Microphone
Behringer | www.behringer.com
DPA 4090 microphone
DPA Microphones | www.dpamicrophones.com
CM-130 SPL meter
Galaxy Audio | www.galaxyaudio.com/CM130.php
Mackie | www.mackie.com
NTI Audio XL2 SPL Meter
NTi Audio | www.nti-audio.com/en/products/xl2-sound-level-meter.aspx