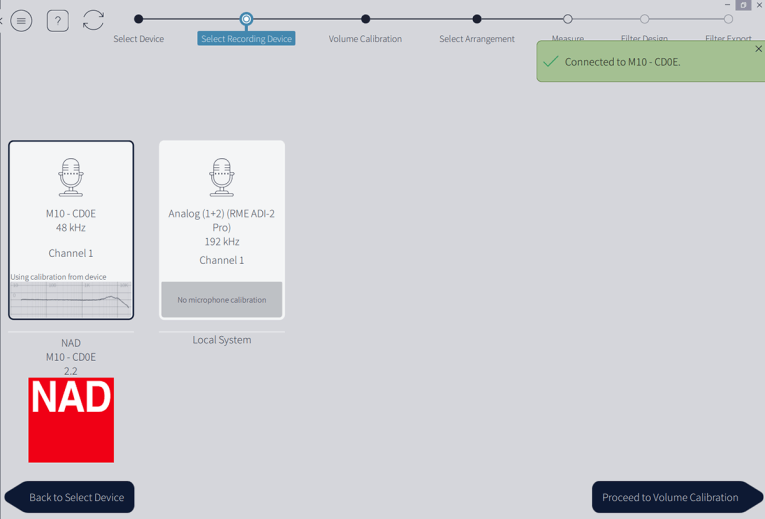
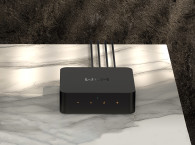
Dirac has tried to make the measurement and calibration process as simple and flexible as possible. The app takes the user through a series of screens to achieve the calibration. First, the user can choose whether to use the included mic (see Figure 1) plugged into the M10’s USB port or a separate mic/preamp with its own calibration file. I opted for the former, since that’s what most users will do.
Figure 1: The M10 enables the user to select either the included microphone or an external mic and interface.
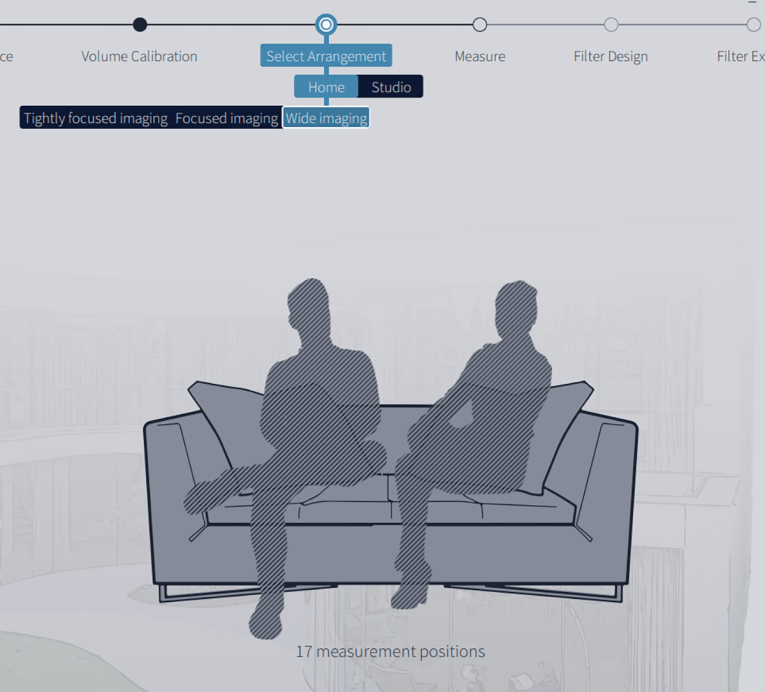
Figure 2: Dirac Live can be configured for a narrow or wide area, depending on desired seating arrangement. It can also be configured for studio use with desktop monitors.
Once the M10 and mic source are chosen, the user has the options of a studio or home setting for the loudspeaker arrangement. Within the “Home” option, one has the further choice of a wide or narrow seating arrangement (see Figure 2), with the former requiring more measurement locations and potentially not having the same degree of correction. Since I’m a selfish man who usually listens to music in solitary, my choice was the single seat, “tightly focused” imaging. The Dirac/M10 combination allows up to five different filter settings to be stored, so if you like, you can do measurement/calibration for both single and multiple seats, then select the appropriate filter for any given listening situation.
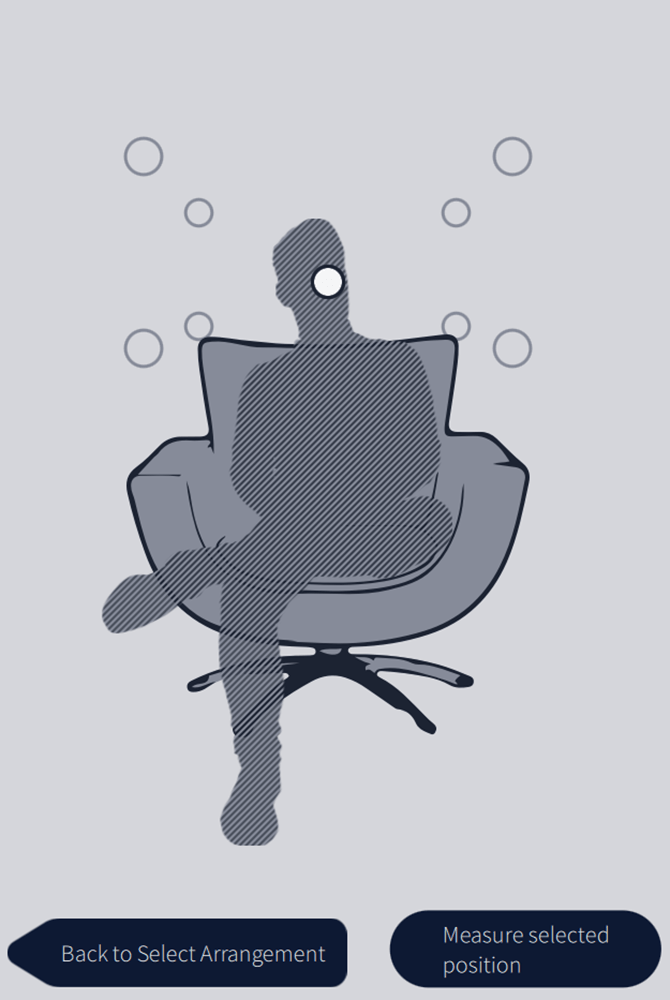
Once the speaker and seating arrangements are chosen, the app has the user set testing levels using the app’s pink noise source, and running through each speaker in turn. With the overall levels set, the measurement process then begins. For the chosen seating arrangement, the Dirac app shows the mic measurement positions (see Figure 3).
There’s two small problems. First, the provided test mic needs to point upward and mounts on a photo tripod. That’s great except for measurement at the actual listening position, where the tripod and the chair cannot occupy the same space at the same time! This is less of a problem with a more conventional measurement mic, which can be placed on a boom and extended over the chair. I did several workarounds here, but it would be nice to have some manufacturer suggestions.
Figure 3: Once the area and seating positions are chosen, Dirac Live indicates the positions for the acoustic measurement.
The second problem is that the positions to the sides, above and below the listening height are not really specified (i.e., there’s a line drawing with circles, but no actual distances). This is left to guesswork. The ranging process used by Sonarworks is still the best I’ve seen for setup, but giving the user actual distances between points would be a nice second-best.
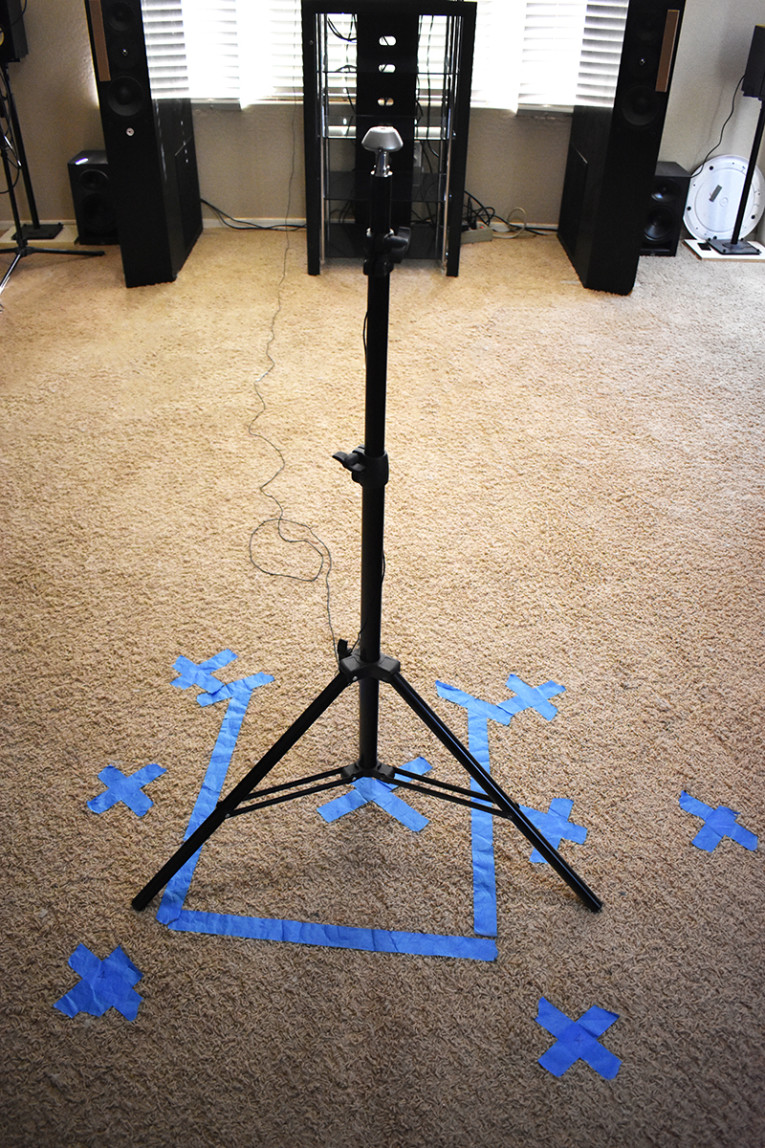
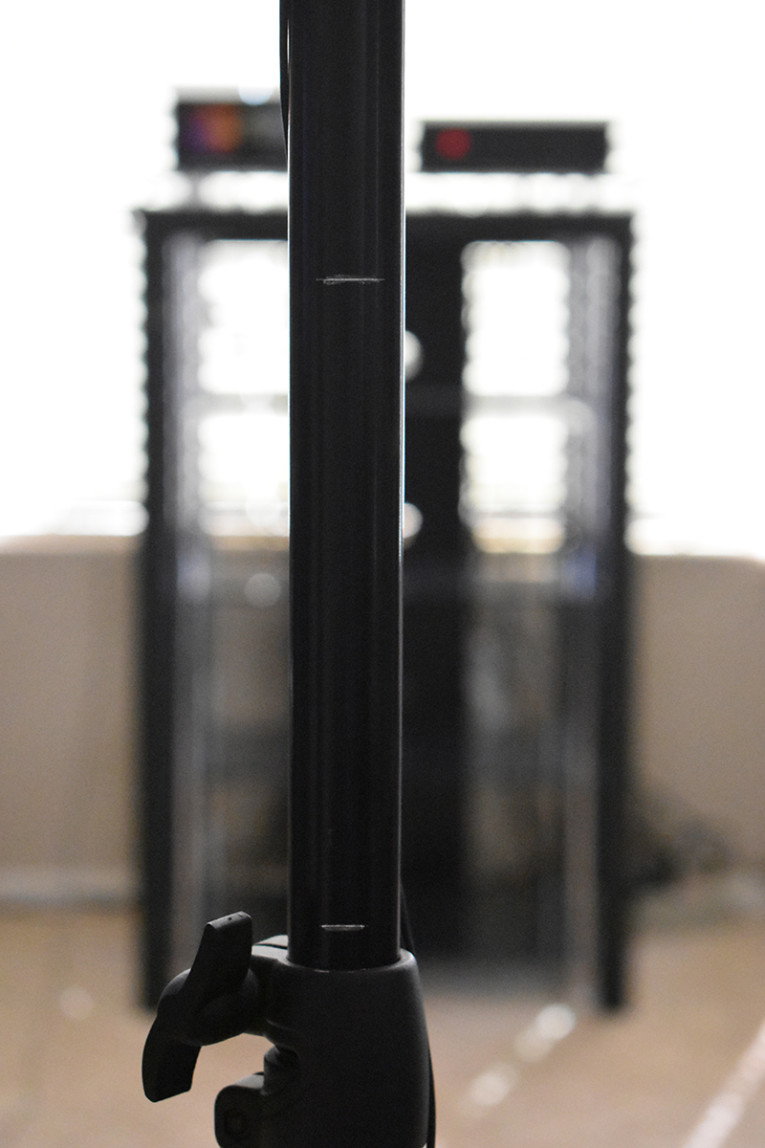
If I can’t be accurate, I at least want to be precise! So we did two things for precision — marking and measuring listening position and measurement locations on the floor with tape (see Photo 1), and making marks on the mic tripod to accurately reset the height at each location (see Photo 2). These are easy things to do for repeatability, but I sure would like to know the distances assumed for the mic positions during the filter calculation.
Photo 1: To ensure mic placement was consistent from side to side, we measured and marked spots on the floor. Note my remarkably empty equipment rack!
Photo 2: Putting marks on the tripod shaft enables consistent and repeatable changes in mic height for the Dirac measurements.
Other than this quibble, the measurement process was easy and only took 15 minutes or so. At each point, the Dirac system does a sine sweep for each speaker, then a final verification sweep before prompting you to move on to the next position. Once that’s complete, the filter can be generated (it’s apparently calculated at Dirac rather than by your local device), then loaded into one of the slots of the M10 and saved. A useful feature is that you can choose the target response for the filter to be something other than flat — a common adjustment is an overall downward response with increasing frequency (e.g., the KEF and Harman curves). The response curve is adjusted graphically by moving points on the target curve Dirac enables you to see the results of the measurements for each speaker, corrected and uncorrected. Even better, you can also see the uncorrected and corrected impulse response for each speaker.
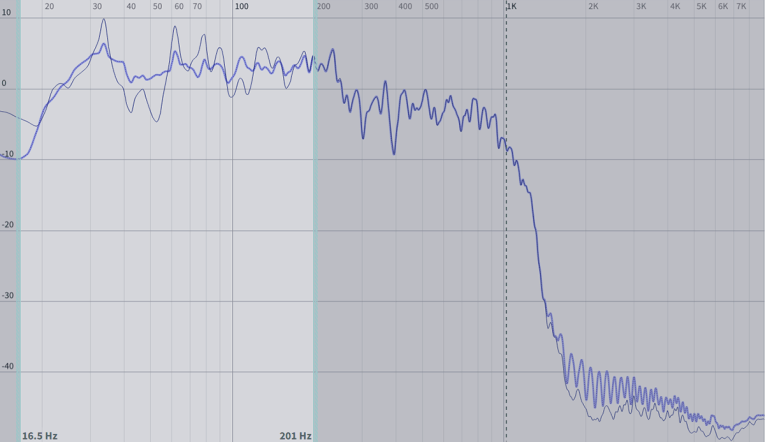
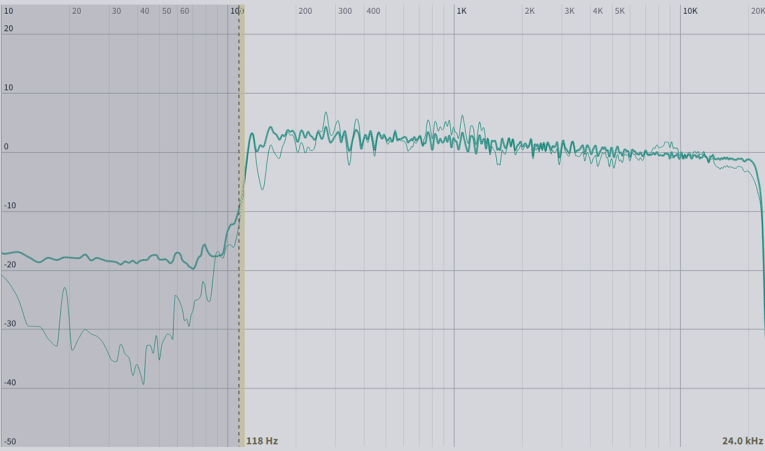
Figure 4 is a screenshot of the measured uncorrected and corrected subwoofer response. The response swing without correction (thin trace) is almost 15 dB; after correction, this is improved to within a 5 dB window (thick trace). Figure 5 is the equivalent responses of the main speakers before and after correction—the effect is a bit subtler but still very evident.
Even more interesting is the comparison of the impulse responses. Figure 6 shows the uncorrected (upper) and the Dirac corrected impulse response (lower). What’s striking is that the reflections at about 3 ms and 4ms from the main impulse are only slightly diminished, but the cleanness of the main impulse and phase coherence is markedly improved.
Figure 4: Dirac displays the measured and corrected frequency responses of each of the subwoofers, in this case, the left one. Note the greatly improved bass smoothness.
Figure 5: The frequency response of the left main speaker before and after Dirac correction shown in the Dirac window also shows improved flatness of frequency response.
Figure 6: Comparing the ungated in-room impulse response of the left speaker uncorrected (upper) and the same impulse with Dirac Live correction (lower) shows a remarkable improvement in phase coherency over the first few milliseconds.
To get a better overall picture of what Dirac was doing in my system, I set up my usual acoustic measurement system of an Audio Precision APx525 analyzer, APx1701 transducer interface, and a PCB Piezotronics 376A32 1/2” condenser mic, with the mic placed at the listening position. The M10 was fed Farina chirp (log sine) test signals via its analog inputs, and these were converted to frequency and impulse responses.
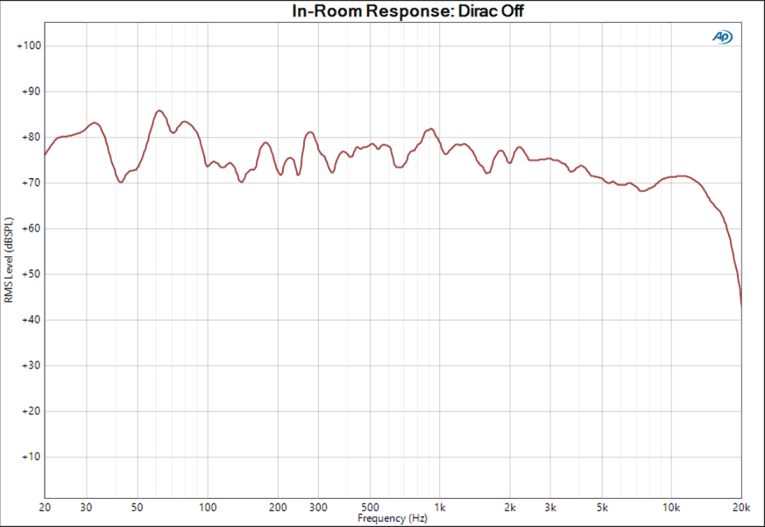
Figure 7 shows the ungated (in room full range) frequency response of my speakers with Dirac turned off, fed a stereo signal. It was taken at the listening position as a power average of nine measurements with the mic moved a few inches horizontally and vertically to achieve a spatial average. The peaks and dips are pretty typical for speakers in an untreated or (in my case) lightly treated room without quasi-anechoic gating.
Figure 7: The ungated full-range frequency response of a mono signal driving both speakers taken at the listening position has typical bumps and dips from room interaction.
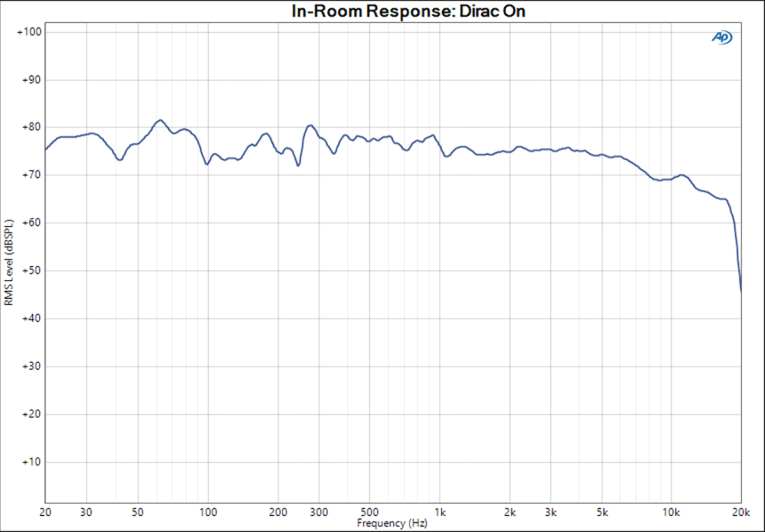
Switching the Dirac on gave me the frequency response shown in Figure 8. This is significantly smoother, and absolutely sounded that way. I noticed during the measurement that the individual responses at different measurement mic positions were nearly coincident, so something was going on beyond mere equalization. And of course, that “something” is the time domain/phase correction.
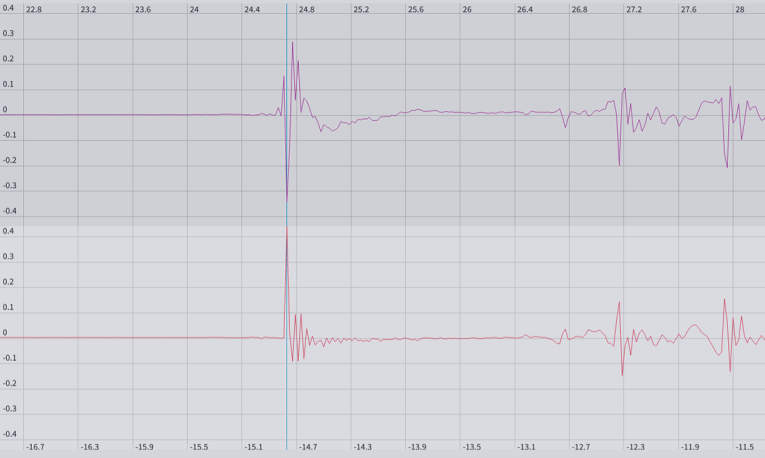
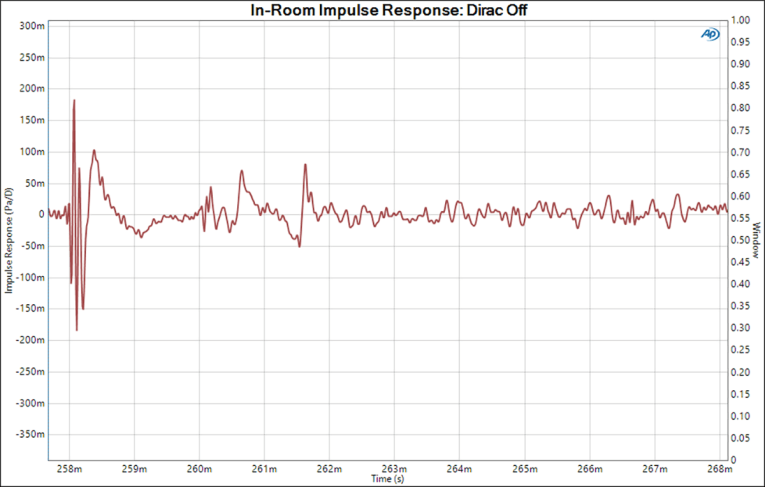
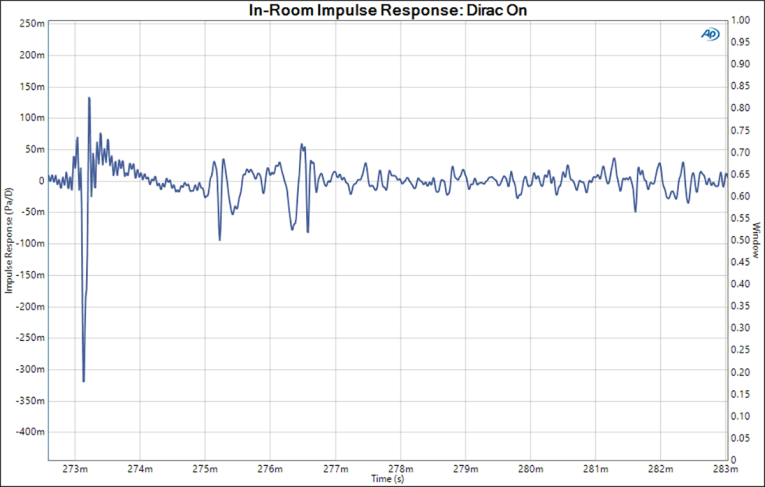
At the listening position with a stereo signal, the measured impulse response is shown in Figure 9, both without (a) and with (b) the Dirac filter turned on. The reflections seen earlier appear in this measurement as well, but it’s very clear that, consistent with the single speaker results from Dirac, the initial impulse for the stereo pair with subwoofers is much sharper and cleaner immediately following the main spike, and even the reflections look more coherent. This is a striking demonstration of the Dirac’s power in the time domain. aX
Figure 8: Taking the same measurement as in Figure 7, but with Dirac Live switched on, shows a significant improvement in the flatness of the response.
Figure 9a: The impulse response of a mono signal driving both speakers taken at the listening position shows a marked increase in coherence. This is the uncorrected response.
Figure 9b: And this is the impulse response of a mono signal driving both speakers taken at the listening position, corrected by Dirac.
This article was originally published in audioXpress, August 2020.
Stuart Yaniger has been designing and building audio equipment for nearly half a century, and currently runs a technology consulting agency in western New York. His professional research interests have spanned theoretical physics, electronics, chemistry, spect... Read more