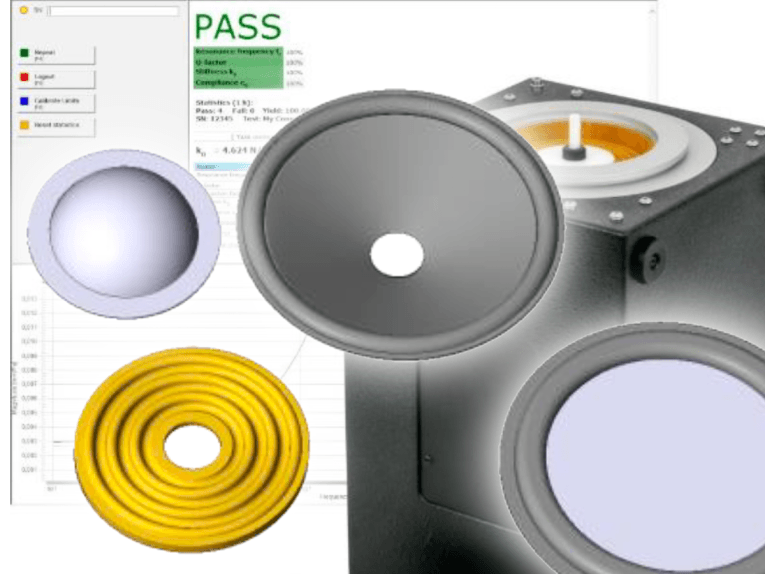
Additionally, the overall yield at the production’s end is maximized to reduce cost and resource usage. Clearly, the loudspeaker’s weakest mechanical part is usually the suspension system, namely the spider and the cone/dome surround (see Photo 1). As the quality may vary remarkably among or even within different batches, the influence on the final driver’s small and large signal behavior can be significant. Even Rub & Buzz defects may occur as a consequence.
This article discusses an approach for time-efficient testing of loudspeaker suspension parts close to their final operating conditions. It refers to the Linear Suspension Test set (LST Lite), a hardware and software add-on for the Klippel QC loudspeaker end-of-line testing system. It is dedicated to fast and simple testing of suspension parts and passive radiators in the linear operation range (i.e., small-signal domain). The system may be applied to 100% of the parts or to a random sample.
Principle
During loudspeaker design, the performance at both small and large excursions is relevant. As the force deflection rises significantly versus displacement, suspension parts are, in general, highly nonlinear. Thus, the k(x) is an important design parameter that determines the system performance at high levels. However, this characteristic is mainly dominated by the geometry and the general material properties. It may not necessarily be checked for quality control as the required clamping effort and measurement time is high.
Therefore, testing the suspension part in the linear range offers several benefits because it provides easily interpretable single-value parameters such as resonance frequency fr and (small signal) stiffness k0 as a quality fingerprint.
Hardware Setup
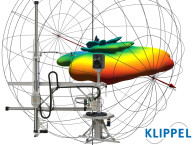
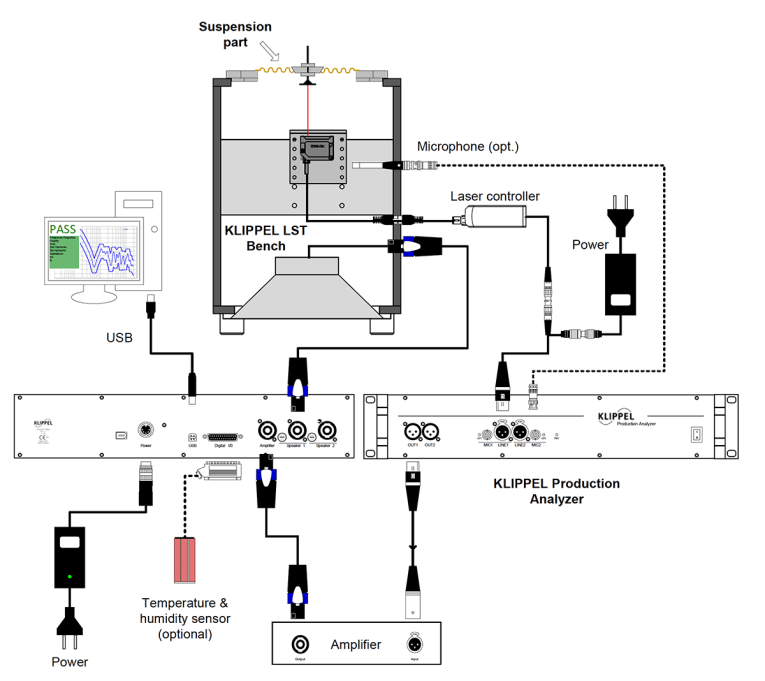
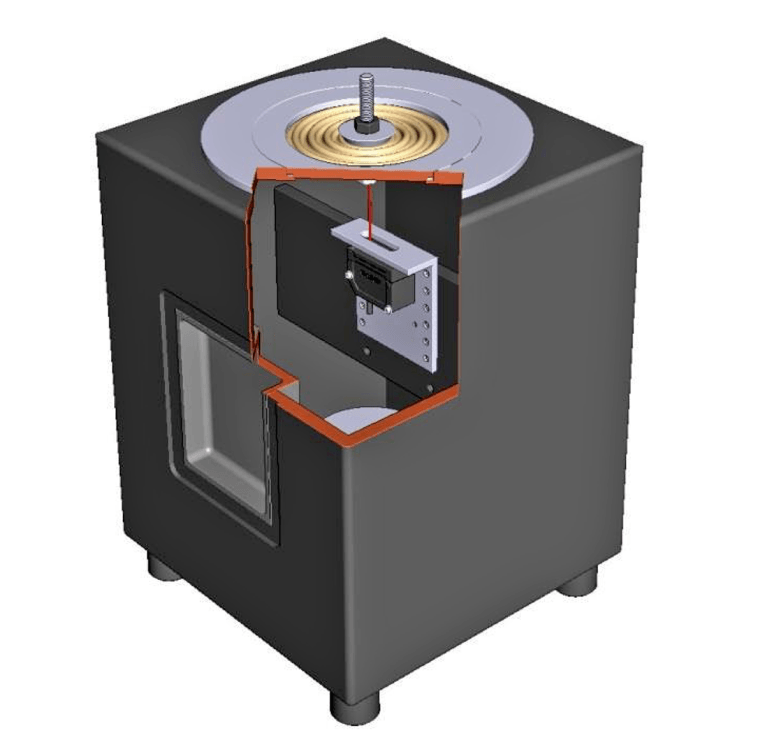
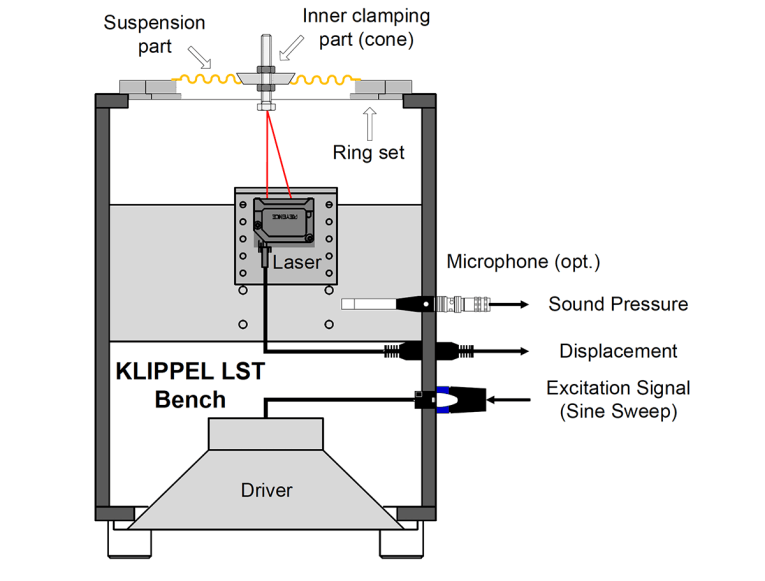
Figure 1 provides an overview of the complete test setup, containing a cross section of the Klippel LST test bench, which is also shown in Photo 2. It comprises a test box with a built-in low-frequency driver, a cost-efficient laser displacement sensor, and a mounting platform with optional components (e.g., ring and cone set). The volume flow generated by the driver provides pneumatic excitation for the device under test (DUT), which may be any kind of suspension part. Generated by the Production Analyzer hardware, the stimulus signal is amplified and fed to the LST Bench. The mounted suspension part’s displacement response is measured by the triangulation laser sensor, which is connected to the Production Analyzer’s signal input. A host PC comprising the QC software and the LST module performs the signal processing and the overall system control.
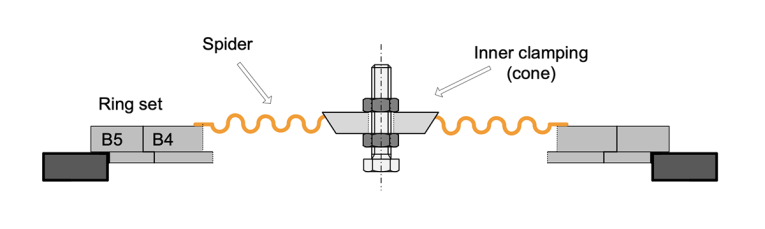
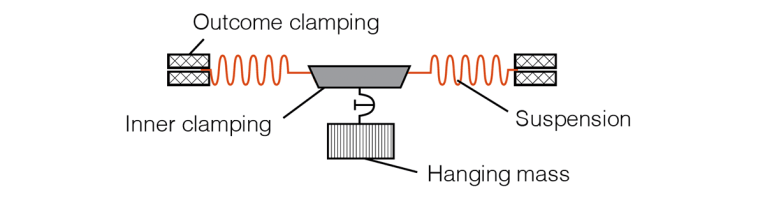
Since the DUT’s target-peak displacement during the measurement is low, the clamping effort can be minimized to ensure fast mounting and, thus, a minimal overall test time. The close-up view shows the DUT is horizontally mounted on top of the test bench (see Figure 2). A variable ring set provides the outer seating while the inner clamping cone fixes the spider by gravity, providing a defined additional moving mass. The bolt attached to the cone acts as handle and a reflective surface for the laser beam with adjustable distance. All the inner clamping’s components are made of lightweight plastics to keep the DUT’s static displacement minimal.
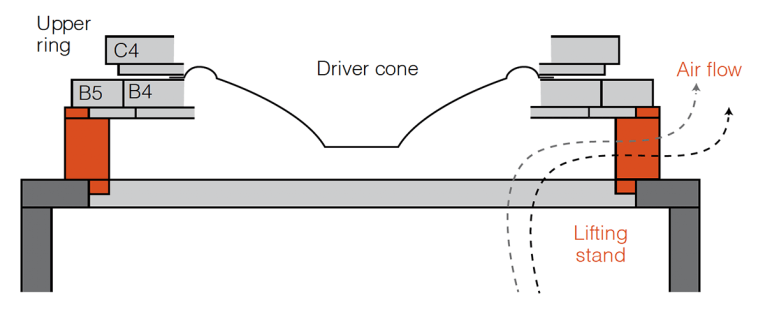
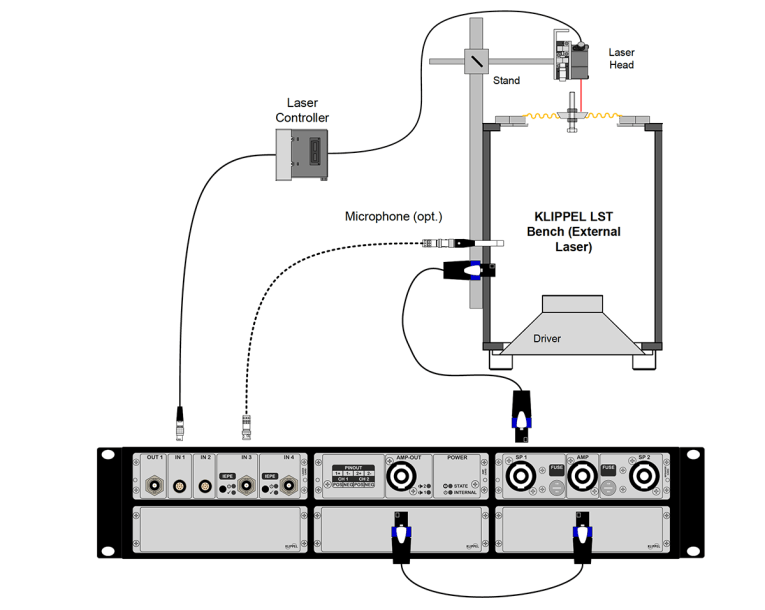
Alternatively, a free-air setup without any additional mass may be applied (see Figure 3). In this case, the DUT equires another matched ring on top the outer rim. The complete platform is lifted by narrow stands to bypass the test box compliance.
Due to the higher mounting effort, the setup is less practical for fast testing, but it provides parameters like the fundamental resonance frequency f0. Additionally, static displacement due to gravity is reduced. This can be beneficial for soft suspensions.
Measurement & Analysis
The total moving mass m consists of the dominant mass of the inner clamping mc and the effective moving mass of the test object ms that may be approximated by its total mass, m – mS + mC.
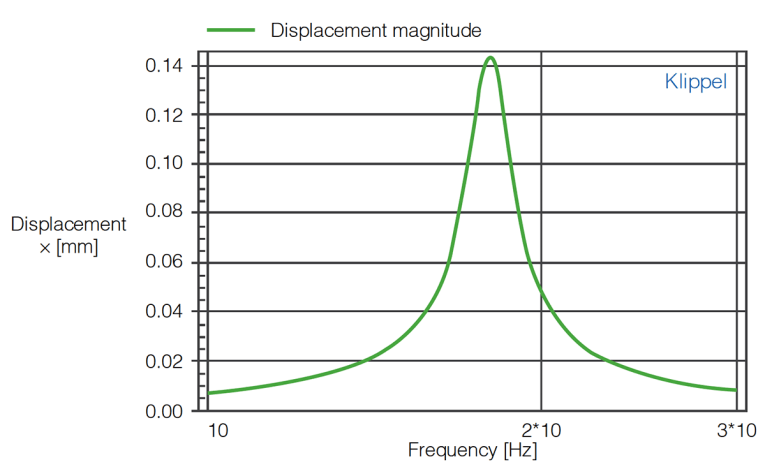
Using a broadband stimulus signal like a sine sweep, resonance will occur at a certain frequency where the suspension part’s restoring force equals the moving mass’s inertia. The resonance frequency is a simple and characteristic parameter. However, since it is determined by stiffness and total moving mass, it is not a universal parameter to characterize a suspension part, unless it was determined without additional mass (fundamental resonance frequency f0). Separating the mass enables me to determine the effective stiffness kEFF which is a more general linear design parameter not related to the attached mass.
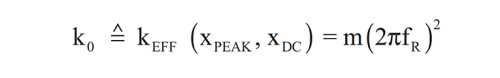
For the added mass setup, the total moving mass is usually dominated by the inner clamping. Thus, the moving mass may be assumed constant for the complete setup among different dust of the same type. Therefore, the stiffness can be derived from the resonance frequency and the moving mass:

Testing Limits
For quality testing, the selected parameter’s tolerance limits (e.g., resonance frequency or stiffness) need to be defined to derive a clear pass/fail verdict. Defining absolute limits is the most basic approach. However, as the results strongly depend on the measurement conditions, deriving relative limits from a set of reference units offers several benefits. Representative reference units may be selected under reference conditions and transferred to the testing line. Performing basic statistical analysis enables me to define relative tolerance limits from the ensemble average using statistical or shift algorithms. Outliers are easily detected.
The limit calibration is a simple and effective means to account for short- and long-term climatic conditions at the testing site or systematic differences between the lab and the production line. Depending on the material used, most suspension parts show significant parameter drift related to the ambient temperature and humidity. Temperature variation considerably influences the compliance, even at typical room temperature variations. This effect is difficult to handle using static testing limits.
During limit calculation, all reference units are statistically analyzed to determine the most average unit with respect to the displacement response. Kept close to the testing site, this so-called “golden DUT” can be used to recalibrate the testing limits. In a special measurement mode, this unit may be measured at any time during a testing session. The deviation to the original response is determined and used to adjust the tolerance limits by removing systematic offsets.
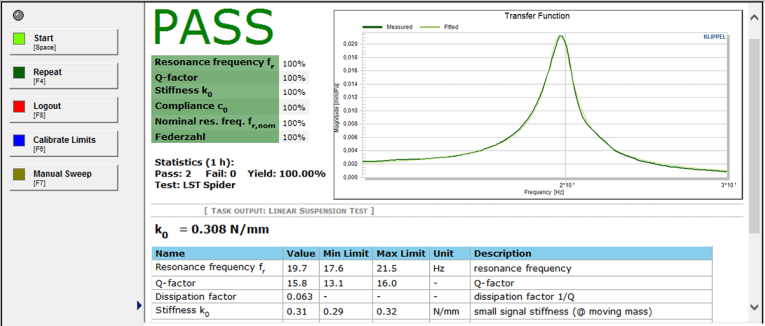
After the tolerance limits are defined, testing can be performed with a simplified user interface for the operator. An example screenshot is shown in Photo 3. The screen consists of three elements: a chart showing the most recent and the golden Dot’s displacement responses, a result window displaying the derived single-value results and limits, the current climatic environmental conditions and the test verdict followed by a single verdict list. A simple control panel offers a reduced set of actions (e.g., test start and limit calibration for the operator).
Comparison of Measurement Techniques
Various measurement techniques have been developed to characterize loudspeaker suspension parts. As the compliance is typically nonlinear versus displacement and time variant due to reversible and irreversible aging effects, the measurement method and conditions have a significant influence on the results. Therefore, it is often difficult to keep results comparable, especially when the boundary conditions are not defined.
IEC standard 62459 introduces several static and dynamic methods for measuring suspension parts under different conditions. I will give a short overview, including a practical example, to interpret and correctly compare the LST results. Additionally, the deviation’s origin is explained.
Static Measurement
A very basic technique is the static measurement method. A defined mass is attached to the suspension part to cause a static displacement (see Figure 5). After a certain settlement time, the static displacement xDC is measured to derive the static stiffness:

Usually, a long settlement time is required due to viscoelastic effects of the material (i.e., creep). This means the displacement increases gradually after the mass is attached until it approaches a final static value.
Dynamic Measurement (Large Signal)
A completely different approach, which is much closer to the final application’s operating conditions, is the dynamic measurement. This method may be performed in both large- and small-signal domains, which again leads to different measurement conditions, signal analysis, and results for the stiffness.
Dynamically driving the suspension part into the large signal domain results in a varying force deflection versus displacement and, thus, a (nonlinear) dynamic stiffness:
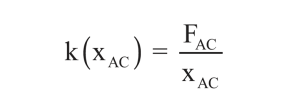
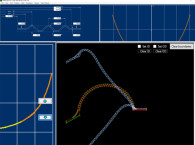
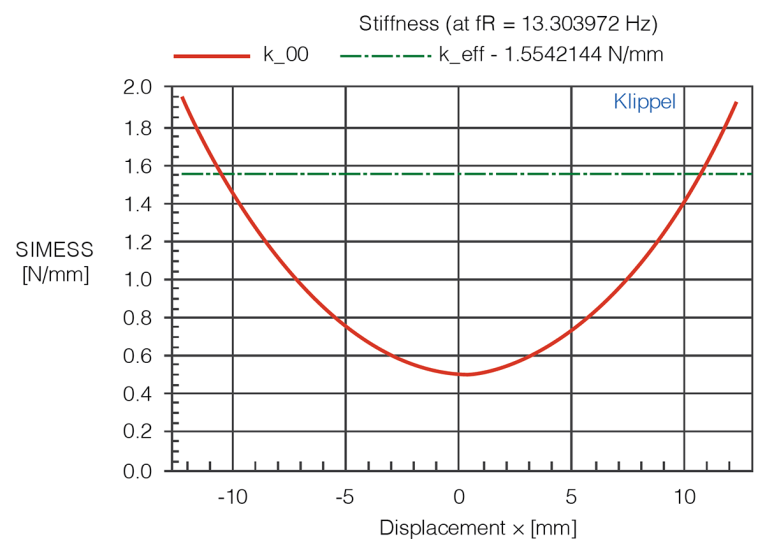
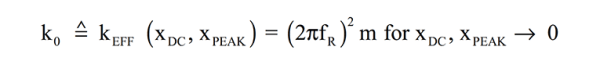
A powerful driver and stable clamping is required to measure at these high-peak displacements. The Klippel Suspension Part Measurement (SPM) set provides an adequate test bench (see Figure 6). The red result curve in Figure 7 shows a resulting example curve (stiffness versus displacement). The spider gets less compliant at higher displacements. Still, a single-value effective stiffness can be derived from the resonance frequency fR at the current AC peak displacement xPEAK:

The dashed line represents kEFF in the measurement example. It may be plotted together with the dynamic stiffness k(xAC) for comparison. Obviously, the effective stiffness value is between the maximal (at xPEAK) and minimal (at x = 0) dynamic stiffness.
Dynamic Measurement (Small Signal)
Performing the dynamic measurement in the small signal domain for small displacements (xPEAK → 0) provides a more universal result for the effective stiffness in the linear range, similar to a complete driver’s small-signal parameters (Thiele-Small).
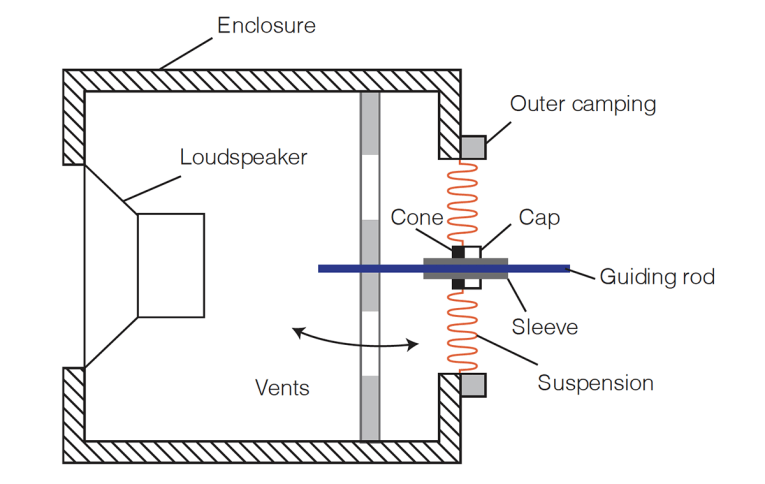
The SPM measurement bench may also be used for a small-signal measurement at low levels as the principle is similar to the LST. However, the DUT is vertically clamped to minimize the gravity’s influence (see Figure 8). The clamping procedure is time consuming. Additional damping is generated by the guiding rod, which may be removed for small signal measurement.
The LST is also focused on the suspension’s dynamic small-signal behavior. However, the DUT is horizontally mounted on the measurement bench to minimize clamping effort. This causes a small static displacement xDC and thus, a small bias of k relative to the rest position:
Comparison
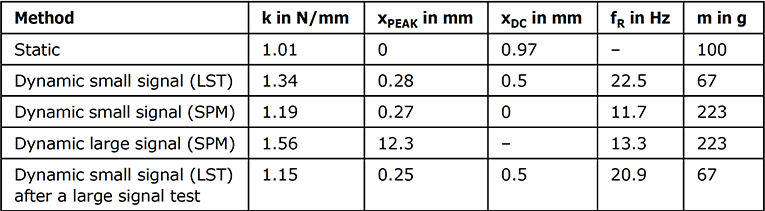
To evaluate systematic differences among the introduced measurement methods, Table 1 shows practical results for a standard 6’’ spider. The small-signal measurement (LST) was performed before and after the large signal test to show the load-induced aging’s influence. The measurement results reveal several tendencies:
• The static stiffness is lower than the effective stiffness due to material creep—the suspension seems to be softer than under real dynamic operation conditions.
• The effective stiffness in the large-signal domain is usually higher than in the small signal due to rising stiffness with displacement (behavior might be different in the transition range!)
• The deviation between small signal results of SPM and LST (less than 10%) is mainly related to the mounted DUT’s orientation. The LST measurement includes a static displacement bias xDC due to the inner clamping’s weight, which results in a slightly higher kEFF.
• The technique results depend on further boundary conditions (e.g., additional moving mass and peak displacement). Therefore, these conditions should always be given along with the measurement results (e.g., kEFF at xPEAK) for proper data exchangeability.
• Material aging due to mechanical stress needs to be considered for comparable testing results.
Interpretable Parameters
This article discussed an effective approach for fast testing of loudspeaker suspension parts for quality control purposes. The dynamical measurement of the displacement response in the linear operation range delivers easy interpretable parameters that are close to design and the final operating conditions. Time efficient and repeatable testing can be performed due to simple clamping and fast measurement using the infrastructure of a loudspeaker-related end-of-line testing system.
This measurement approach is not limited to suspension parts. It is also applicable to passive radiators. However, as the performance is determined by both moving mass and suspension stiffness, both parameters should be independently monitored in this case. Further signal processing implemented in an extended LST version provides mass and stiffness separation for improved diagnostics. VC
This article was originally published in Voice Coil, December 2012 (with some updates introduced from 2019 documents).
Resources
International Electrotechnical Commission (IEC) Standard 62459 “Measurement of Suspension Parts,” 2009.
W. Klippel, “Dynamical Measurement of Loudspeaker Suspension Parts,” presented at the 117th Audio Engineering Society (AES) Convention, 2004.
———, “Mechanical Fatigue and Load-Induced Aging of Loudspeaker Suspension,” presented at the 117th AES Convention, 2011.
www.klippel.de/nc/en/products/qc-system/modules/lst-linear-suspension-test.html
Sources
C2 Suspension Part Measurement Set and C6 QC Linear Suspension Test
Klippel GmbH | www.klippel.de