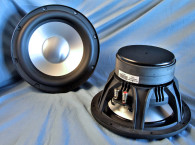
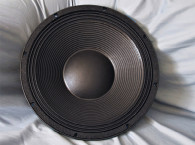
Voice Coil characterizes an 18” pro sound subwoofer from BMS Speakers, a noted German pro sound company. The BMS 18S450 is high power handling woofer rated at 1,200 WRMS, which is the Audio Engineering Society (AES) standard. It weighs a moderate (for an 18”) 32 lb. Features for the 18S450 are rather substantial and include a proprietary eight-spoke cast-aluminum frame that incorporates eight 25-mm × 20-mm vents located below the spider mounting shelf, with a series of six cooling fins for each vent (see Photo 1). Additional convection cooling is provided by a series of eight 5-mm diameter peripheral vents located on the top of the back plate, plus a 35-mm diameter pole vent. The pole vent has a venturi-type flare on both ends.
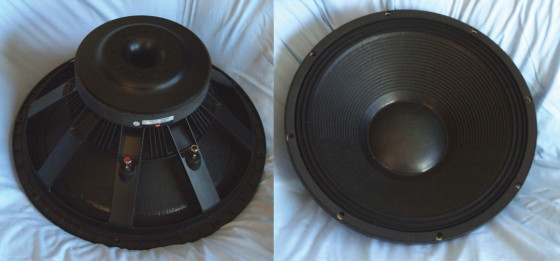
The cone assembly consists of an 18” straight-edged ribbed paper cone with a double-treated waterproof coating and a large 6” diameter hard paper dust cap. Compliance is provided by a three-roll M-shaped coated (sealed) polycotton surround in conjunction with a 6.5” diameter flat treated-cloth spider (damper) with the voice coil lead wires located on one side of the cone. This is driven by a 4” (100 mm) diameter high-temperature low-compression voice coil wound on a copper sandwich former that has conducting and non-conducting layers.
BMS refers to the 18S450 as an “ultra-low-distortion woofer,” which means this driver has three aluminum shorting rings (Faraday shields) located above and below the voice coil. The voice coil is terminated to a pair of color-coded chrome push terminals.
To begin testing, I clamped the driver to a rigid test fixture in free-air at 1, 3, 6, 10, 15, 20, 30, and 40 V. I used the LinearX LMS and VIBox to produce voltage and admittance (current) curves. I use a procedure that attempts to achieve the third time constant on each sweep, such that the LMS oscillator is turned on for a progressively increasing time period between sweeps—generally at a frequency that produces maximum current.
Following the established Test Bench test protocol, I no longer use a single added mass measurement. Instead, I use actual measured cone assembly weight, which BMS provided at my request.
Next, I post-processed the 16 550-point stepped sine wave sweeps for each sample and divided them by the current curves to derive impedance curves, then calculated the phase. (LMS is a single-channel analyzer and does not measure phase, but it does have a highly accurate proprietary phase calculation methodology.) I imported the information, along with the accompanying voltage curves, to the LEAP 5 Enclosure Shop software.
This is a more time consuming process than the usual low-voltage small-signal impedance curve technique used to derive Thiele-Small (T-S) parameters. The reason for this is that the LEAP 5 LTD transducer model methodology results in a more accurate prediction of excursion at high voltage levels.
Because most T-S data provided by OEM manufacturers is produced using either a standard modeling method or the LEAP 4 TSL model, I additionally used the 1-V free-air curves to create a LEAP 4 TSL model. I selected the complete data set, the LTD model’s multiple voltage impedance curves, and the TSL model’s 1-V impedance curves in LEAP 5’s Transducer Derivation menu and created the parameters for the computer enclosure simulations.
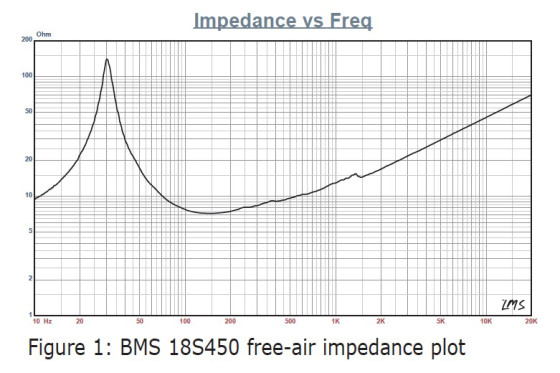
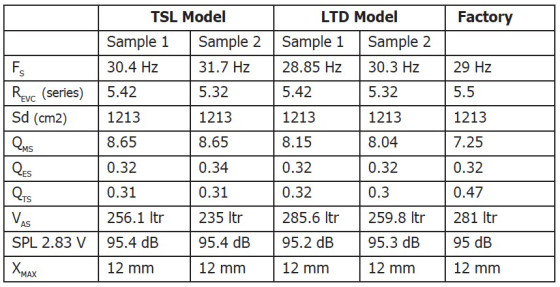
Figure 1 shows the 18S450’s 1-V free-air impedance curve. Table 1 compares the LEAP 5 LTD and TSL data and factory parameters for both 18S450 samples.The 18S450’s parameter measurement results showed a reasonably close agreement with the BMS 18S450’s published factory data. Given this, I used the LEAP LTD parameters to set up two computer enclosure simulations for Sample 1. This included two vented alignments, a 4.94-ft3 enclosure alignment recommended by BMS with 15% fiberglass fill material tuned to 32 Hz, and an Extended Bass Shelf (EBS) alignment in a 5.91-ft3 vented enclosure with 15% fiberglass fill material tuned to 28.8 Hz.
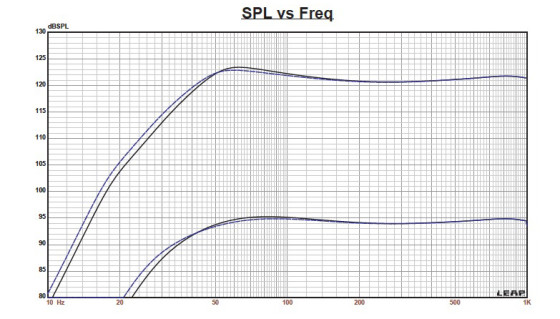
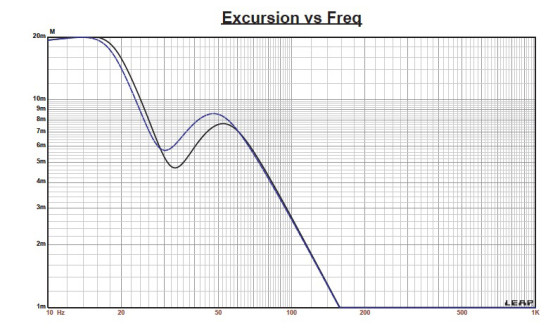
I increased the voltage input to the simulations until the maximum linear cone excursion was reached. This resulted in 124.5 dB at 80 V for the recommended enclosure simulation and 124 dB at the same 80-V input level for the larger vented box. Figure 3 and Figure 4 show the 2.83-V group delay curves and the 80-V excursion curves, respectively. The voltage input was limited to 80 V as the XMAX + 15% number was exceeded at about 20 Hz. With a 20-to-25-Hz high pass, the 18S450 could have been driven several decibels louder using the same criteria.
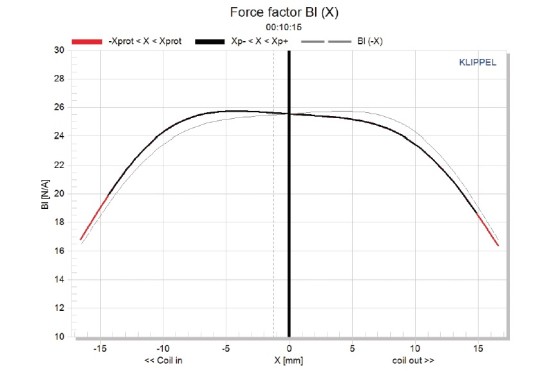
Klippel analysis for the 18S450 produced the Bl(X), KMS(X) and Bl and KMS symmetry range plots shown in Figures 5–8. Our analyzer is provided courtesy of Klippel. Patrick Turnmire of Redrock Acoustics performs the testing.

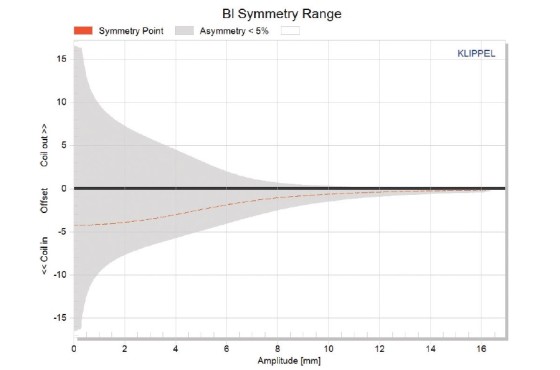
Figure 5 shows the 18S450’s Bl(X) curve, which is nicely broad and symmetrical with a small amount of offset and tilt. Figure 6 shows the 18S450’s Bl symmetry plot, which has a minor 4.2-mm coil-in offset at the rest position. However, this is in the area of greatest analyzer uncertainty and decreases to nearly zero offset at the 18S450’s physical 12-mm XMAX. Figure 7 and Figure 8 depict 18S450’s KMS(X) and KMS symmetry range curves.
The KMS(X) curve is also rather symmetrical but with some obvious forward coil-out offset. Looking at the KMS symmetry range curve, the forward offset is 1.75 mm at rest, which is not a really big number. It decreases throughout the operating range to 0.69 mm at the 18S450’s 12-mm physical XMAX.
The 18S450’s displacement limiting numbers were XBl at 70% (Bl decreasing to 70% of its maximum value) was greater than 14.3 mm. The crossover (XC) at 50% (compliance decreasing to 50% of its maximum value) was 10.5 mm, which was fairly close to the 12-mm physical XMAX. For the 18S450, compliance is the most limiting factor for the 20% prescribed distortion level.
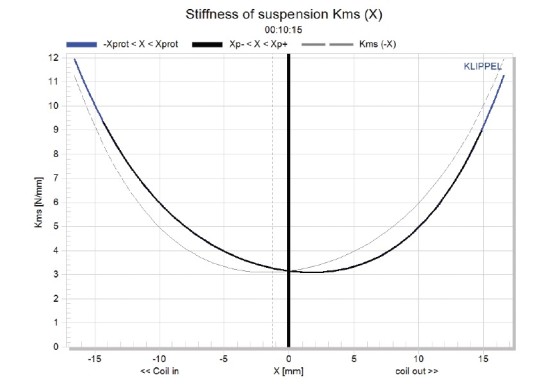
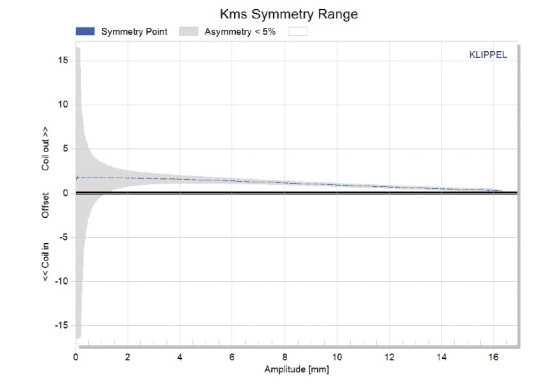

Figure 9 shows the 18S450’s inductance curve L(X). Inductance will typically increase in the rear direction from the zero rest position as the voice coil covers more pole area, unless the driver incorporates a shorting ring. The 18S450 uses three aluminum shorting rings, which yields an inductance variation maximum from both XMAX positions of less than 0.17 mH, which is minimal variation for a subwoofer with this large a motor.
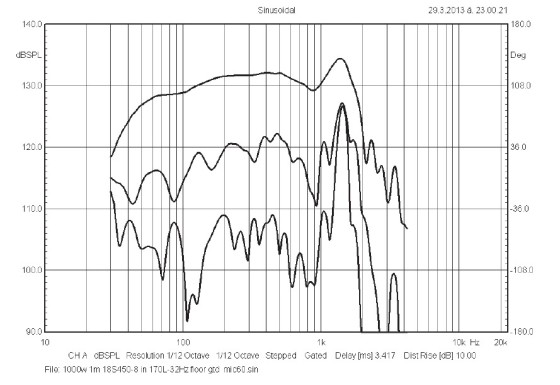
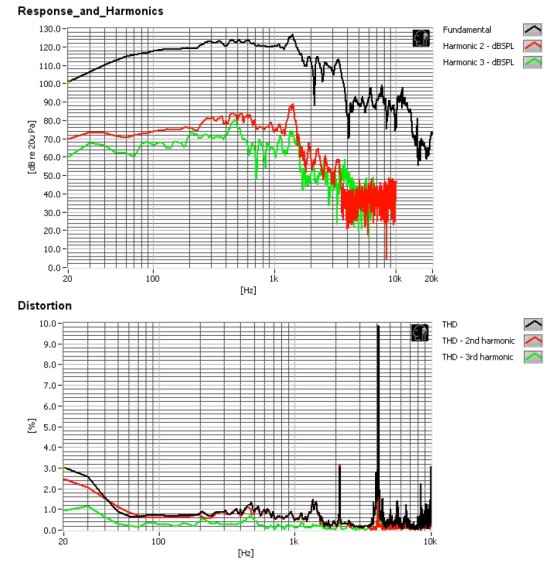
I dispensed with the 18S450’s sound pressure level (SPL) measurements, because I don’t keep 18” or 21” size cabinets in my inventory of test fixtures. However, Figure 10 shows the factory SPL curve. Since I decided not to perform SPL measurements, I moved on to the last group of tests. I used the Listen SoundCheck AmpConnect analyzer, the SC-1 microphone, and the SoundConnect power supply (all courtesy of Listen) to measure distortion.
Because I did not have an enclosure, I did not use Listen’s SoundMap software for time-frequency presentations. To set up for the distortion measurement, I rigidly mounted the 18S450 in free air, and used the noise stimulus to set the SPL to 104 dB at 1 m (6.8 V). (SoundCheck has a software generator and an SPL meter as two of its utilities.) Next, I measured the distortion with the Listen microphone placed 10 cm from the dust cap.
Figure 11 shows the distortion curves. The effectiveness of the triple aluminum shorting ring configuration is pretty obvious. BMS has designed an excellent performing 18” driver design with several unique and substantial proprietary features, which make it an extremely robust pro sound subwoofer for PA applications.
www.bmsspeakers.com