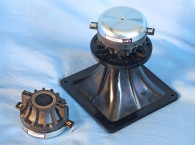

The horn supplied for use with the DE350-8 by B&C Speakers was the ME10v2. This Hyperbolic Cosine flare horn has a 1” exit bolt on type made from injection-molded ABS and provides a 90°×60° coverage pattern and a 1500Hz cut-off frequency, making it a reasonable match for the DE350-8 compression driver.
Figure 1 and Figure 2 show the horizontal and vertical directivity maps for the ME10v2. Figure 3 and Figure 4 illustrate the horizontal and vertical polar plots for this horn. However, it should be noted that the bolt pattern of the ME10v2 does not fit the DE350 and must be modified with new bolt holes drilled into the mounting plate (yes, I got my hand drill out and added two more holes). Nevertheless, if you are buying OEM quantities of the DE350/ME10v2, I’m quite certain B&C Speakers can address this issue.


I began testing using the LinearX LMS analyzer to produce the 300-point stepped sine wave impedance plot that is shown in Figure 5, with the solid black curve representing the B&C Speakers DE350-8 mounted on the ME10v2 horn, and the dashed blue curve representing the compression driver without the horn. With a 6.52Ω DCR (Re), the minimum impedance of the DE350/ME10v2 was 7.5Ω and at 5.43kHz.

Next, I free-air mounted the B&C Speakers DE350/ME10v2 combination without an enclosure and measured both the horizontal and vertical on- and off-axis at 2V/0.5m (normalized to 2.83V/1m) from 0° on-axis to 60° off-axis using the Loudsoft FINE R+D analyzer and the GRAS 46BE microphone (supplied courtesy of Loudsoft and GRAS Sound & Vibration). Figure 6 displays the on-axis frequency response of the DE350/ME10v2 combination, which is ±3.5dB with no major anomalies from the 1kHz recommended crossover frequency to about 10kHz, beginning its second-order low-pass roll-off at 20.5kHz, requiring the usual horn equalization.

Figure 7 shows the horizontal SPL data from 0° on-axis to 60° off-axis, with the normalized version depicted in Figure 8. Note, since B&C Speakers supplied the horizontal and vertical directivity maps and polar plots for the ME10v2, I chose not to do the vertical SPL measurements, or the horizontal and vertical polar plots using the CLIO Pocket Analyzer. However, Figure 9 illustrates the two-sample SPL comparison showing the two compression driver samples to be very closely matched, ≤1.0dB throughout the operating range of the transducer.


For the remaining tests, I set up the Listen AudioConnect analyzer, SoundCheck 21 software, and the Listen 1/4” SCM microphone to measure distortion and generate time-frequency plots. For the distortion measurement, the DE350/ME10v2 combination was again mounted in free-air in the same manner as was used for the frequency response measurements, and the SPL was set to 104dB at 1m (2V determined by using a pink noise stimulus generator and internal SLM in the SC21 software).
I then measured the distortion with the Listen 1/4” measurement microphone located 10cm from the mouth of the horn. This produced the distortion curves shown in Figure 10 (red curve=second harmonic, blue curve= third harmonic).

I then set up SoundCheck 21 to generate a 2.83V/1m impulse response and imported the data into Listen’s SoundMap Time/Frequency software. Figure 11 shows the resulting cumulative spectral decay (CSD) waterfall plot. Figure 12 shows the Short Time Fourier Transform (STFT) plot.


Based on these measurements, the extremely compact DE350-8 displays excellent performance and fairly high power handling for such a small package. It is a nice addition to B&C Speakers’ extensive line-up of neo motor 1” compression drivers. For more information, contact B&C Speakers at www.bcspeakers.com. VC
This article was originally published in Voice Coil, January 2024


