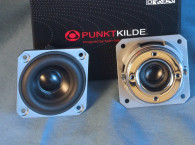


Eastech sent Voice Coil its recently released Punktkilde tweeter, the FSA044010-0802. Features for this transducer include a 1” damped titanium dome diaphragm, dual magnet neodymium motor (I assume the second magnet is a bucking magnet to concentrate more flux in the gap), a cast-aluminum anodized red (other colors are available) faceplate, and an 8 Ω voice coil. As you can see from Photo 1, this is a very cosmetically attractive tweeter with a polished return cup with a metalized stick on the back.
Testing commenced using the LinearX LMS analyzer to produce the 300-point impedance sweep illustrated in Figure 1. The magnetic fluid damped resonance occurs at a moderately 2.1 kHz. With a 7.35 Ω DCR (Re), the minimum impedance for this tweeter is 8.1 Ω at 5.74 kHz. Following the impedance test, I recess-mounted the Punktkilde tweeter in an enclosure that had a baffle area of 12” × 8” and measured the on- and off-axis frequency response again using the Loudsoft FINE R+D analyzer (courtesy of Loudsoft) and GRAS 46BE 1/4" microphone (graciously provided by GRAS Sound & Vibration). The instruments were set up to measure the 200 Hz to 40 kHz frequency response (using a 192 kHz sampling rate) at 2 V/0.5 m normalized to 2.83 V/1 m. Data was then acquired with sweeps at 0°, 15°, 30° and 45°. Figure 2 shows the on-axis response of the FSA044010-0802, which measured ±3 dB from 3 kHz to 20 kHz, with the titanium break-up mode peaking at about 23.5 kHz.


Figure 3 gives the on- and off-axis response of the FSA044010-0802. Figure 4 shows the off-axis curves normalized to the on-axis response. Figure 5 shows the CLIO 180° polar plot (measured in 10° increments with 1/3 octave smoothing). Figure 6 shows the two-sample SPL comparison, indicating the two samples were closely matched to within less than 1 dB throughout its operating range.
For the last test procedure, I again initialized the Listen SoundCheck AudioConnect analyzer along with the Listen SCM-2 1/4” microphone (provided courtesy of Listen, Inc.) to measure the impulse response with the tweeter recess mounted on the same test baffle. Importing this data into the Listen SoundMap software produced the CSD plot (usually referred to as a “waterfall” plot) given in Figure 7.
Figure 8 shows a Short Time Fourier Transform (STFT) displayed as a surface plot. For the last SoundCheck test protocol, I set the 1 m SPL to 94 dB (6.28 V) using a noise stimulus and built in SLM, and measured the second and third harmonic distortion with the microphone placed 10 cm from the dome diaphragm (see Figure 9).
For more information, visit www.eastech.com/punktkilde. VC


