Today, Radian, based in Orange, CA, is well known in the OEM loudspeaker component business, the sound contractor/fixed installation market, and the portable/touring sound industry. With more than two decades of success under its belt, Radian is now entering its third decade as a professional sound manufacturer.

Radian sent the 950PB and the 760NEOPB, two of the company’s flagship compression drivers, for this month’s Test Bench reviews. I chose these two mostly because these Radian transducers have a reputation among recording and touring experts as having a high degree of musicality. The 950PB and the 760NEOPB share several features. They are both 2” 10 kHz. The 950PB and the 760NEOPB use neodymium motor structures and pure aluminum diaphragms with a proprietary mylar suspension that greatly reduces second- and third-order harmonic distortion, which we will validate later using the SoundCheck distortion analyzer.
The two transducers mainly differ with regard to their voice coil diameters. The 760NEOPB has a 3” voice coil diameter with a three-slit phase plug. The 950PB has a 4” diameter voice coil with a four-slit phase plug, which translates into higher power handling. The 950PB is rated at 125 W AES (Audio Engineering Society standard). The 760NEOPB is rated at 105 W AES.
The 760NEOPB
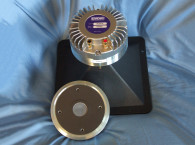
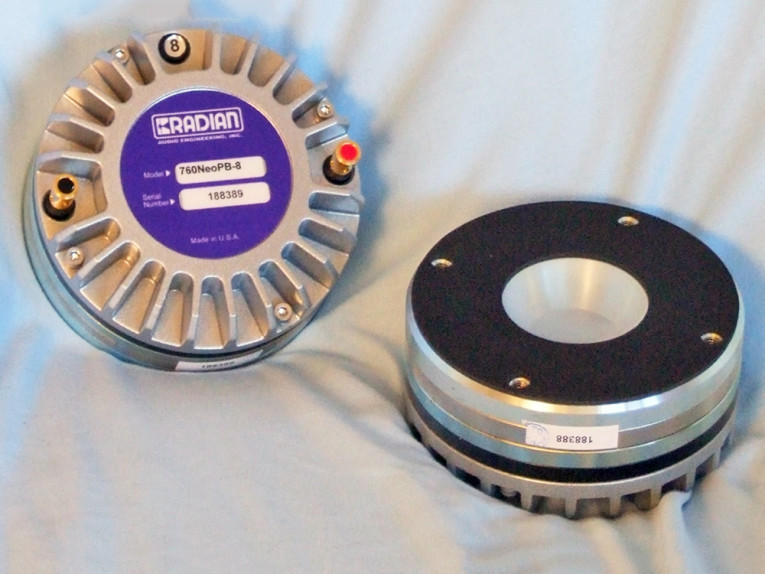
First, I decided to test the 760NEOPB (see Photo 1). However, Radian does not manufacture horns so I used 18 Sound’s Model XR2064, which is a 60° × 40° aluminum horn with a 2” throat entry, for all the sound pressure level (SPL) measurements.
I used the LinearX LMS analyzer to produce the 300-point sine wave impedance plot shown in Figure 1. The solid black curve represents the 760NEOPB mounted on the XR2064 horn. The dashed blue curve represents the compression driver without the horn. With a 5.95-Ω DC resistance (DCR), the minimum impedance above the resonance frequency of the 760NEOPB mounted on the XR2064 horn is 8.07 Ω at 1.76 kHz.
For the next frequency-response tests, I recess mounted the 760NEOPB and the XR2064 horn in an enclosure with a 15” × 10” baffle. Then, I used a 100-point gated sine wave sweep to measure the horizontal on- and off-axis from 0° to 60° at 2.83 V/1 m. Since Radian did not manufacture the horn, I didn’t bother with the vertical-axis measurements.
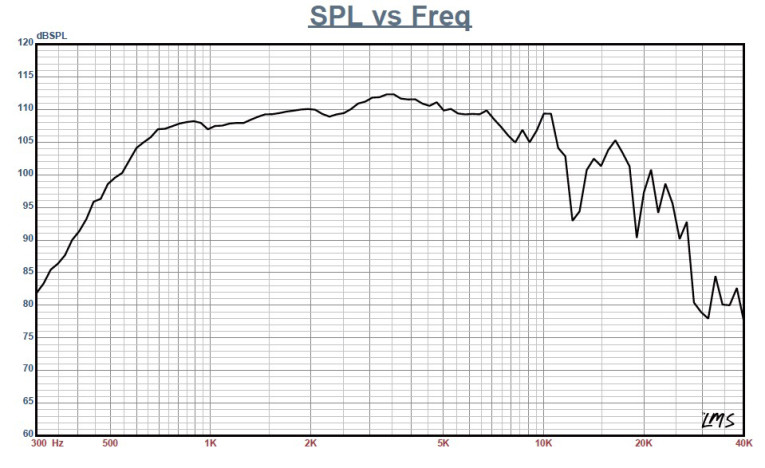
Figure 2 displays the compression driver/horn combination’s on-axis measurement, which is a smooth ±3.6 dB with no major anomalies from 800 Hz out to 12 kHz. It also showed a declining response as frequency increases, with the usual aluminum break-up mode close to 20 kHz.
Note that the 760NEOPB’s upper frequency response at 10 kHz and above is actually quite good for a 2” compression driver. The 760NEOPB would probably be good in a two-way format without the addition of a separate upper frequency transducer and maybe some minor EQ. Radian’s recommended crossover frequency for the 760NEOPB is between 900 Hz to 2 kHz with a second-order or higher slope.
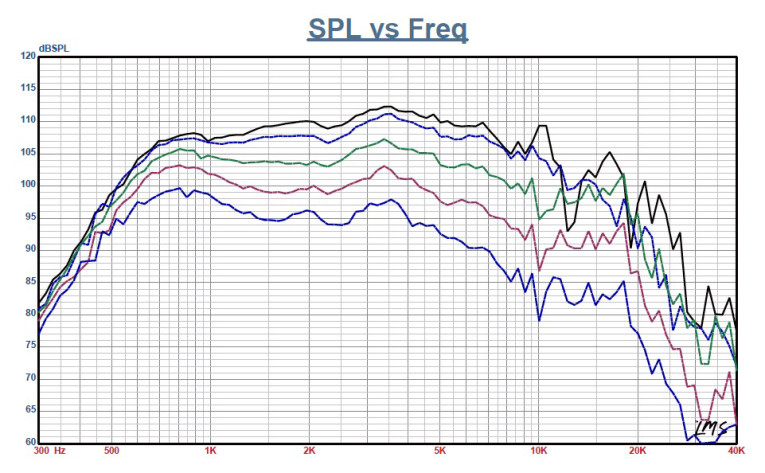
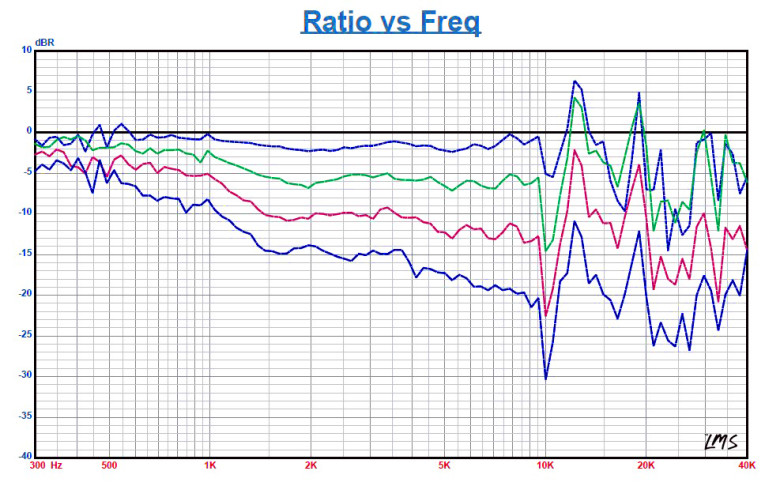
Figure 3 shows the on- and off-axis response in the horizontal plane. Figure 4 shows the normalized version of the horizontal plane response. Figure 5 provides the two-sample SPL comparison. The two 760NEOPB compression driver samples are very closely matched.
For the remaining series of tests, I used the Listen AmpConnect ISC analyzer, the 0.25” SCM microphone, and the power supply to measure distortion and generate the time-frequency plots. For the distortion measurement, the 760NEOPB/horn combination was mounted with the same baffle used for the frequency response
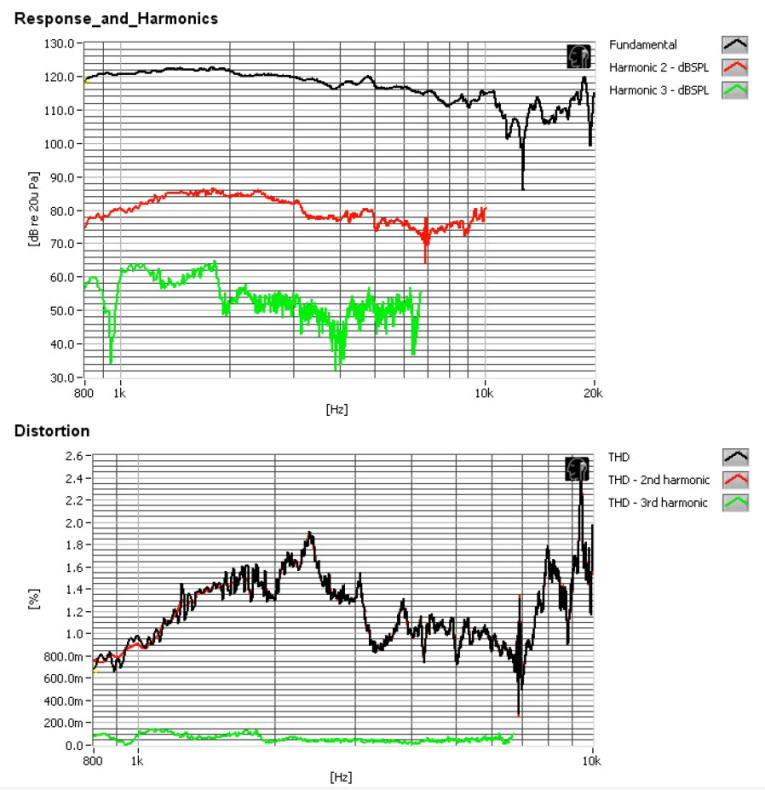
measurements. I set the SPL to 104 dB at 1 m (2.22 V, which I determined using a pink noise stimulus and the internal SLM in the SC13 software).
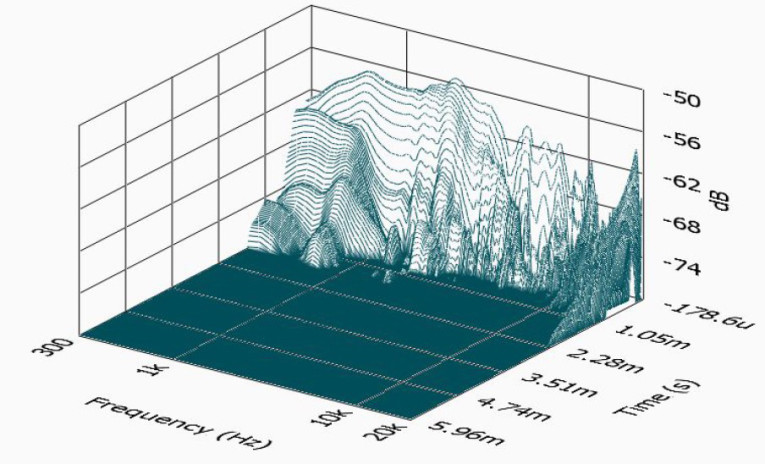
Then, I placed the Listen microphone 10 cm from the horn’s mouth to measure distortion. Figure 6 shows the distortion curves. From the results, Radian’s claim of very low distortion, especially third-harmonic distortion, appears to be accurate. I set up SoundCheck 13 to generate a 2.83 V/1 m impulse response curve for the 760NEOPB and imported the data into Listen’s SoundMap time/frequency software. Figure 7 shows the resulting cumulative spectral decay (CSD) waterfall plot. Figure 8 shows the short-time Fourier transform (STFT) plot.
The 950PB
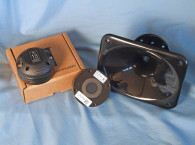
For the 950PB, I used the same setup, baffle, and horn, and went through the same series of measurements (see Photo 2). Again, I used the LinearX LMS analyzer to generate the 300-point sine wave impedance plot depicted in Figure 9. The solid black curve represents the 950PB mounted on the XR2064 horn. The dashed blue curve represents the 950PB compression driver without the horn. With a 4.74 Ω DCR, the 950PB’s minimum impedance above resonance, mounted on the 60° × 40° horn is 5.97 Ω at 3.28 kHz.
For the frequency response testing, I recess mounted the 950PB and horn in the same enclosure that I used for the 760NEOPB’s tests. Then, I used a 100-point gated sine wave sweep to measure the horizontal on- and off-axis from 0° to 60° at 2.83 V/1 m.


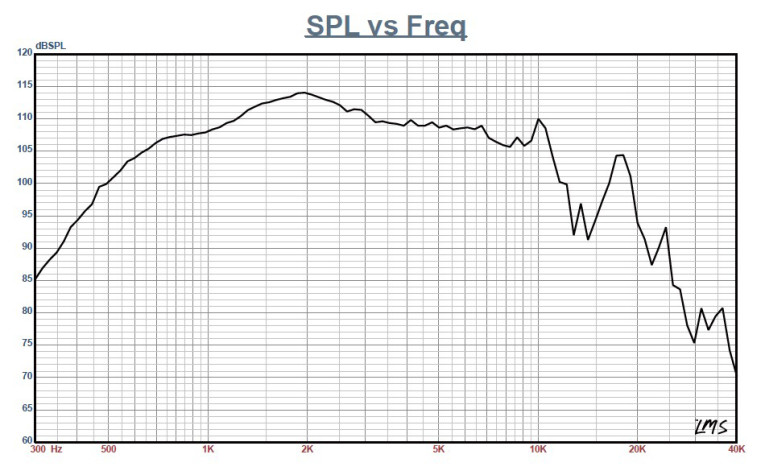
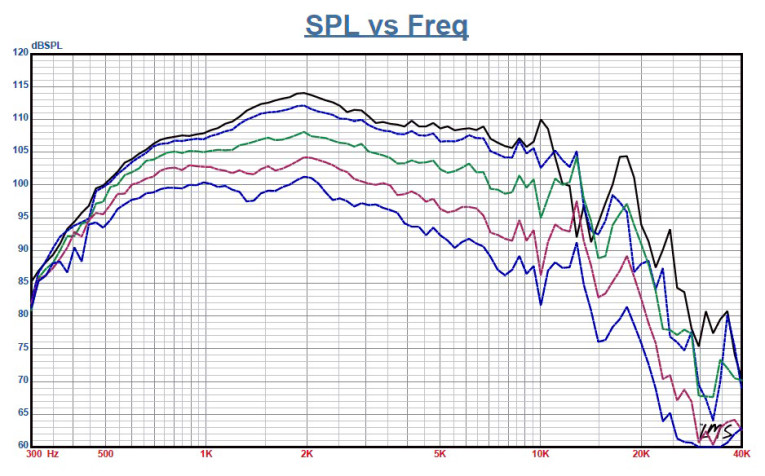
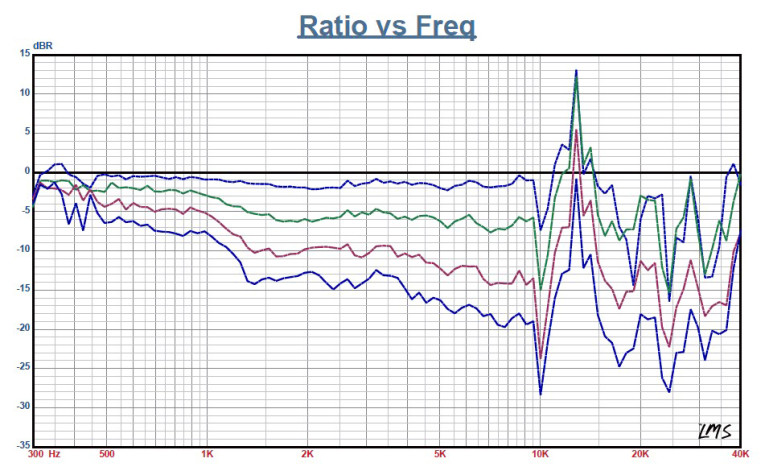
Figure 10 shows the 950PB compression driver/horn combination on axis. The measurement is a smooth ±4.2 dB with no major anomalies from 675 Hz out to 12 kHz. There is a declining response as frequency increases along with some aluminum break-up mode at 19 kHz, before the driver’s low-pass roll-off. Radian’s recommended crossover frequency for the 950PB is 800 Hz with at least a second-order high-pass filter.
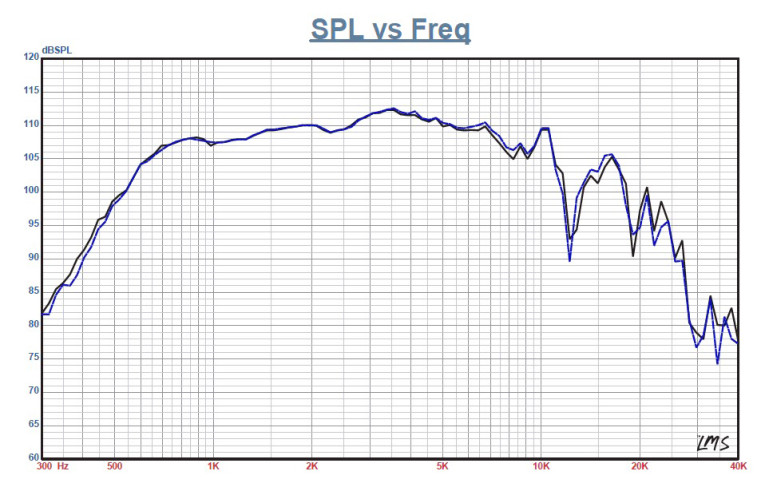
Figure 11 provides the on- and off-axis response in the horizontal plane. Figure 12 shows the normalized version of the horizontal plane response. Figure 13 depicts the two-sample SPL comparison showing the two Radian 950PB compression driver samples to be quite closely matched.
Moving on to the distortion and time-domain testing, I used the Listen AmpConnect ISC analyzer and 0.25” SCM microphone to measure distortion and generate time-frequency plots. For the distortion measurement, I mounted the 950PB/horn combination with the same baffle used for the frequency response measurements.


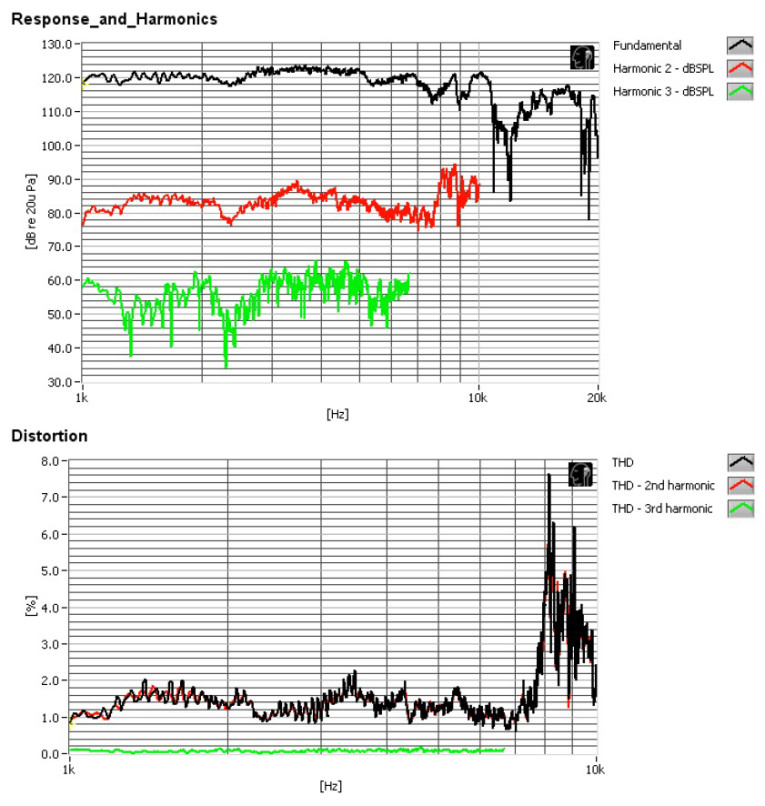
I set the SPL to 104 dB at 1 m (2.09 V, which I determined by using a pink noise stimulus and the internal SLM in the SC13 software). Then, I placed the Listen microphone 10 cm from the horn’s mouth to measure the distortion. Figure 14 shows the resulting distortion curves, which again validates Radian’s claim of “ultra-low distortion.”
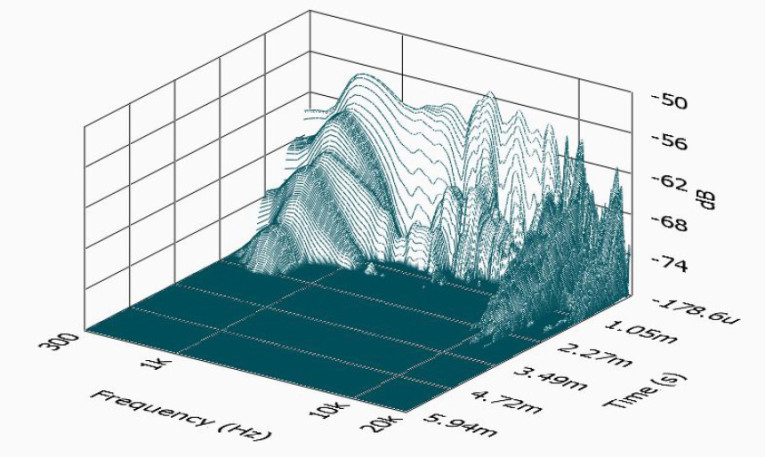
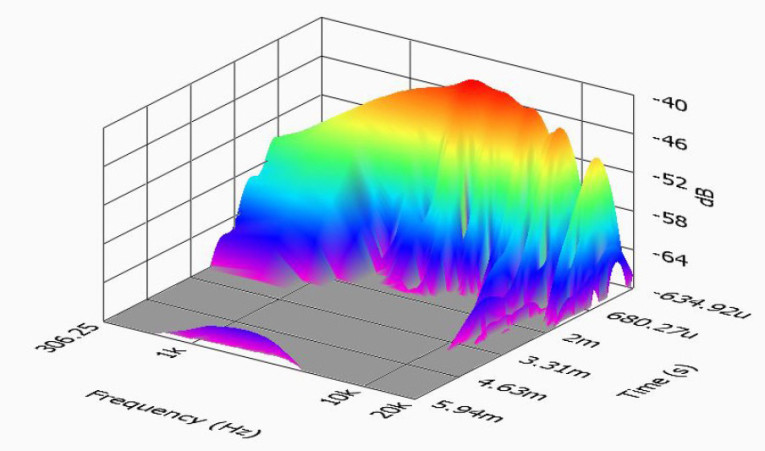
I set up SoundCheck 13 to generate a 2.83 V/1 m impulse response curve for the 950PB. I imported the data into Listen’s SoundMap time/frequency software. Figure 15 shows the resulting CSD waterfall plot. Figure 16 shows the STFT plot.
Both of these Radian Audio Engineering compression drivers, the 950PB and the 760NEOPB, had “ultra-low distortion” performance and displayed good high-frequency extension for 2” compression drivers. Factoring in the very nice build quality, it’s obvious Radian’s engineering is quite good. For more information, visit www.radianaudio.com.
This article was originally published in Voice Coil, November 2014.