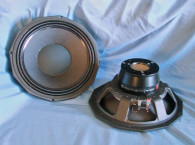
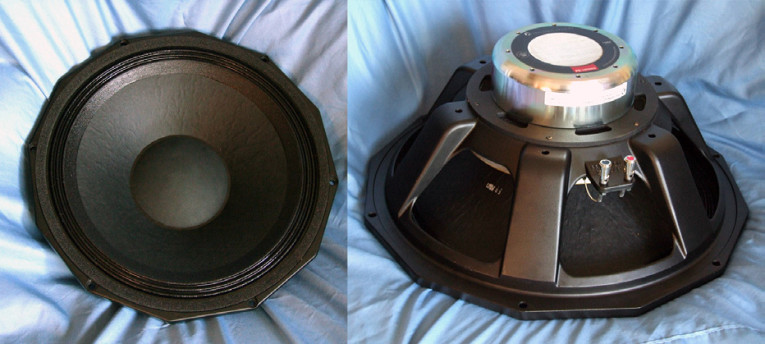
Designated as a woofer/subwoofer, the Precision Devices PD.185N02 is a rather high power handling woofer rated at 1,100 WRMS (AES Standard) with a peak power handling (6 dB crest factor) rated at 4,400 WRMS (also AES Standard). The PD.185N02 weighs in at a modest (for an 18” woofer!) 24.8 lb. The PD.185N02’s feature set includes a proprietary six-spoke cast aluminum frame (see Photo 2).
However, the approach Precision Devices has taken on this model does not include venting below the spider mounting shelf at the top of the front plate, which is a common feature built into high power handling woofer frames. Instead, Precision Devices uses a series of six 40 mm × 14 mm vents located on the top of the mounting plate for the neodymium motor. The cone assembly consists of an 18” UK manufactured paper cone and a large 6” diameter paper dust cap. Suspension is provided by a two-roll M-shaped coated (sealed) cloth surround in conjunction with two 8” diameter flat treated cloth spiders (dampers), which I would assume are mounted back-to-back to cancel out odd-order nonlinearity.
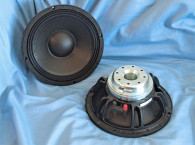
All this is driven by a 5” (127 mm) diameter high-temperature nonconducting glass fiber voice coil former wound (in house) with a round copper wire winding. The voice coil is terminated to a pair of color-coded chrome push terminals. Overall, the PD.185N02’s build quality is excellent.
The PD.185N02 woofer has a relatively compact finite element analysis (FEA) optimized neodymium motor assembly that features eight 5-mm diameter peripheral vents in the back return cup, plus a 60-mm diameter vent that looks like a pole vent, but it just goes straight through to the back of the dust cap. I used the LinearX LMS and the VIBox to produce the voltage and the admittance (current) curves with the driver clamped to a rigid test fixture in free air at 0.3, 1, 3, 6, 10, 15, 20, 30, and 40 V. Also, note that I use a procedure that attempts to achieve the third time constant on each sweep, such that the LMS oscillator is turned on for a progressively increasing time period between sweeps.


Following the established Test Bench test protocol, I no longer use a single added mass measurement. Instead, I used actual measured cone assembly weight provided by Precision Devices at my request. Next, I post-processed the 18 550-point stepped sine wave sweeps for each sample and divided the voltage curves by the current curves to derive impedance curves. Then, I calculated the phase (LMS is a single-channel analyzer and does not measure phase, but it does have a highly accurate proprietary phase-calculation methodology).
I imported the data, along with the accompanying voltage curves, to the LEAP 5 Enclosure Shop software. Obviously, this is a more time-consuming process than the usual low-voltage small signal impedance curve technique used to derive Thiele-Small (T-S) parameters. The reason for this is that the LEAP 5 LTD transducer model methodology results in a more accurate prediction of excursion at high voltage levels, one of the LEAP 5 software’s real fortes.
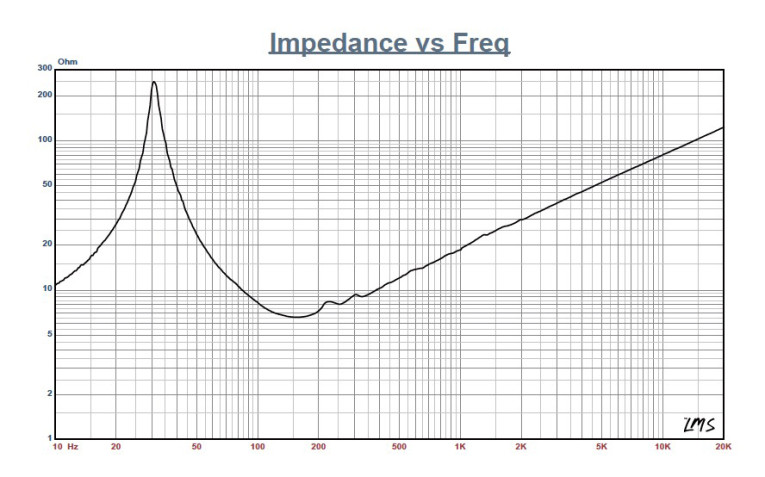
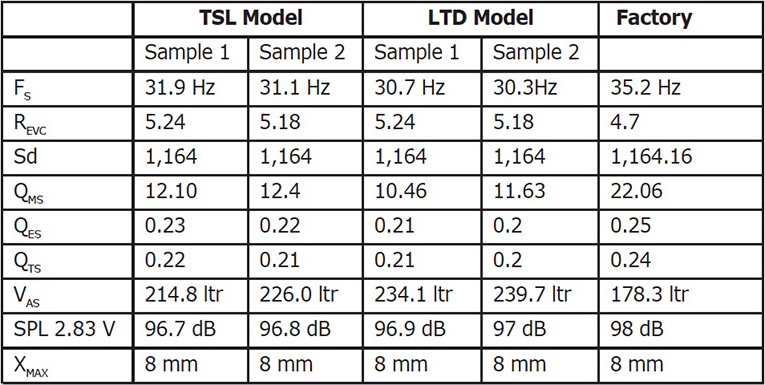
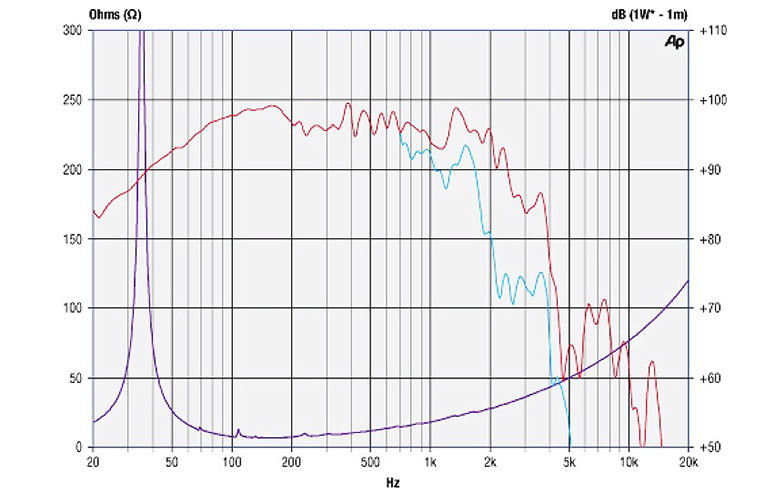
Because most T-S data provided by OEM manufacturers is produced using either a standard modeling method or the older LEAP 4 TSL model, I used the 1 V free-air curves to additionally create a LEAP 4 TSL model. I selected the complete data set, the multiple voltage impedance curves for the LTD model, and the 1 V impedance curves for the TSL model in the Transducer Derivation menu in LEAP 5, and created the parameters for the computer enclosure simulations. Figure 1 shows the PD.185N02’s 1 V free-air impedance curve. Table 1 compares the LEAP 5 LTD and TSL data and Precision Devices’ factory parameters for both PD.185N02 samples.
Comparing my results against the factory numbers shows a fairly good correlation. The RE I measured was nearly 0.5 Ω greater, which is a significant difference. However, my experience is that several initial product sheets tend to be put together using initial prototype data and may settle down a bit when the driver gets into production, which is normal.
Given this, I proceeded to set up two computer enclosure simulations using the LEAP LTD parameters for Sample 1. Precision Devices suggests that the PD.185N02 works well in both vented and horn enclosures, and that it is suitable for sealed box design. I programmed a single-vented alignment — a 3.4-ft3 Extended Bass Shelf (EBS) box alignment with 15% fiberglass fill material tuned to 31 Hz with a 6” diameter vent tube and a 1.5-ft3 sealed box with 50% fill material. I chose 1.5 ft3 as it is about the minimum volume that the woofer would fit into given the diameter and the depth.
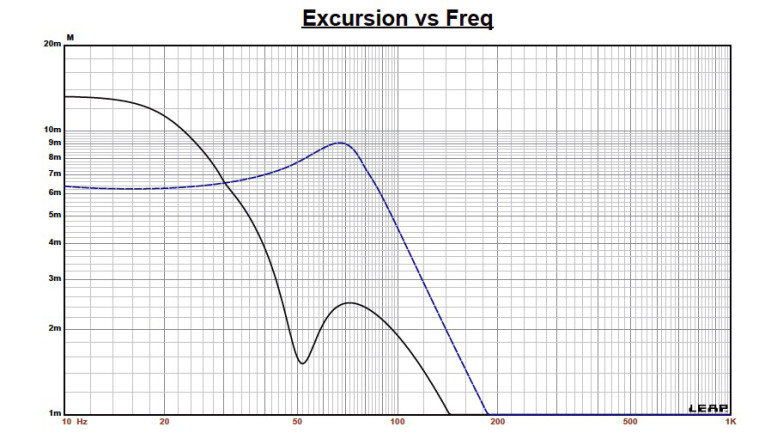
Figure 2 illustrates the PD.185N02’s enclosure simulation results in the EBS vented box and the small sealed enclosure at 2.83 V and at a voltage level sufficiently high enough to increase cone excursion to 9.2 mm (XMAX + 15%). This produced a –3 dB frequency of 46.5 Hz (–6 dB = 42 Hz) for the 3.4-ft3 EBS enclosure and F3 = 86.7 Hz (F6 = 67.5 Hz) for the 1.5-ft3 closed box simulation. Increasing the voltage input to the simulations until the maximum linear cone excursion was reached resulted in 120 dB at 40 V for the EBS enclosure simulation and 125 dB for a 120 V input level for sealed box.
Figure 3 shows the 2.83 V group delay curves. Figure 4 shows the 40 V/120 V excursion curves. Note that the voltage input for the vented simulation was limited to 40 V as the XMAX + 15% number was being exceeded at about 27 Hz. With a 30 Hz highpass, this woofer could easily have been driven several decibels louder for the same criteria. Klippel analysis for the PD.185N02 produced the Bl(X), KMS(X), and Bl and KMS symmetry range plots shown in Figures 5–8. (Our analyzer is provided courtesy of Klippel GmbH. Patrick Turnmire, of Redrock Acoustics, performs the testing.)


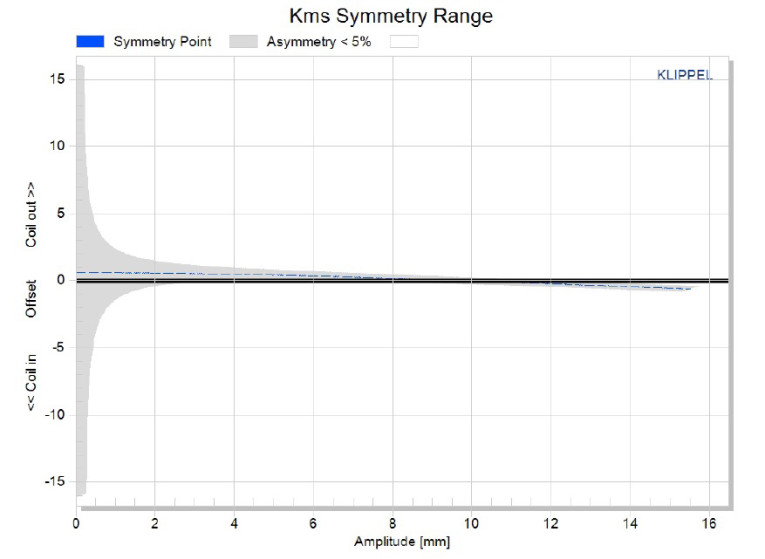
PD.185N02’s Bl(X) curve is nicely broad and very symmetrical (see Figure 5). The Bl symmetry plot shows less than 1 mm coil-in offset at 5 mm excursion (where the grey uncertainty curve starts to diminish) and remains nearly constant out to the PD.185N02’s physical XMAX, which is quite good (see Figure 6). Figure 7 shows the KMS(X) symmetry range curve. Figure 8 depicts the KMS symmetry range curve. The KMS(X) curve is rather symmetrical but with a small amount forward coil-out offset beginning at 6 mm and greater excursion.
Looking at the KMS symmetry range curve, the forward offset is only 0.18 mm at the PD.185N02’s physical XMAX, which is negligible. The PD.185N02’s displacement limiting numbers, calculated by the Klippel analyzer, were XBl at 70% (Bl decreasing to 70% of its maximum value) was greater than 10.4 mm (2.4 mm greater than the physical XMAX) and for crossover (XC) at 50% (compliance decreasing to 50% of its maximum value) was 11.5 mm (also well beyond the physical XMAX), which means the Bl is the most limiting factor for prescribed distortion level of 20% (the criteria for subwoofers).
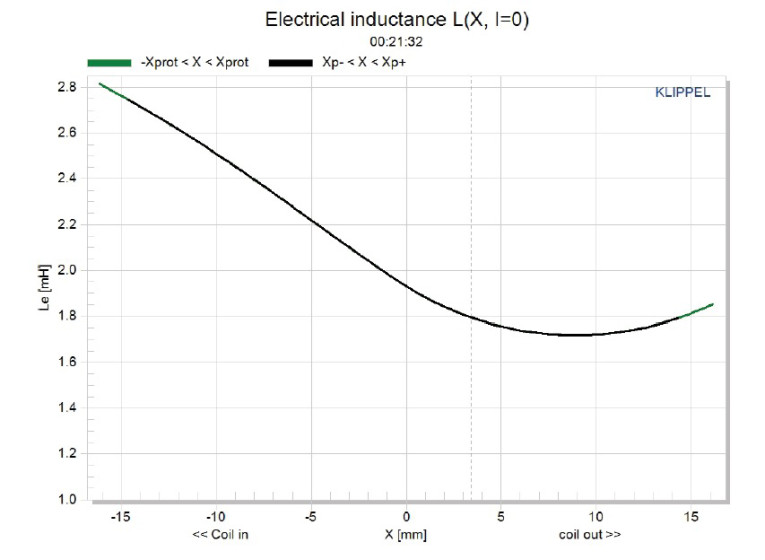
Figure 9 shows the PD.185N02’s inductance curve L(X). Inductance will typically increase in the rear direction from the zero rest position as the voice coil covers more pole area, or in this case, the return cup—unless the driver incorporates a shorting ring. The PD.185N02 does not incorporate a shorting ring. However, given that, the inductive swing is not bad. From rest to the coil - in XMAX position is about 0.46 mH, and from rest to the coil-out XMAX position is 0.21 mH.
I did not do sound pressure level (SPL) or time frequency measurements for the PD.185N02, mostly because I don’t keep 18” or 21” size cabinets in my inventory of test boxes. However, Figure 10 depicts the factory SPL curve. I then moved on to the distortion test, which was performed using the Listen AmpConnect analyzer, the SC-1 microphone, and SoundCheck 14 software, all courtesy of Listen, Inc.
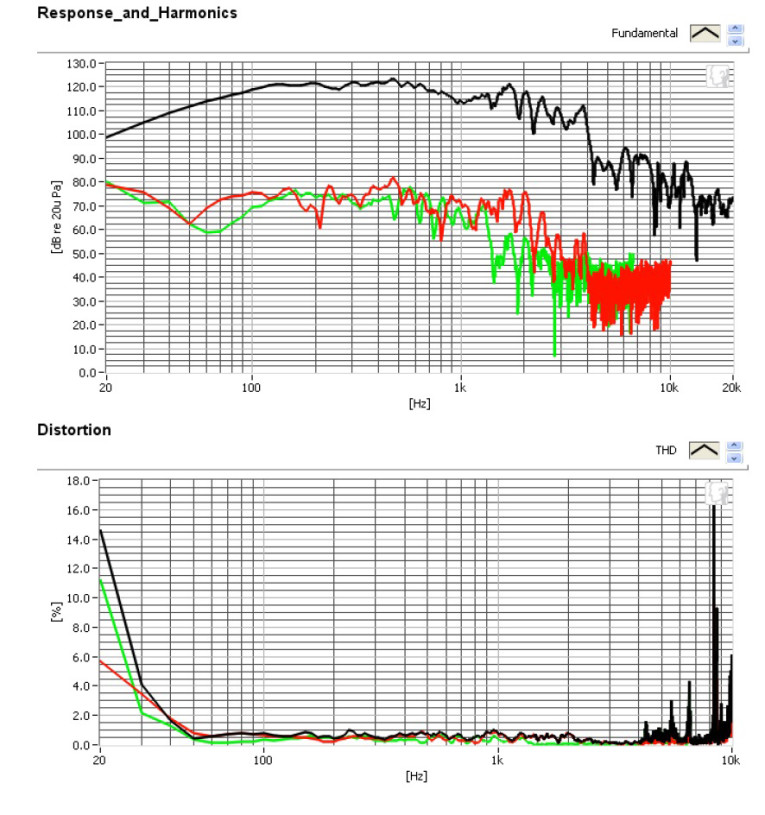
To set up for the distortion measurement, I rigidly mounted the woofer in free air and set the SPL to 104 dB at 1 m using a noise stimulus (SoundCheck has a software generator and SPL meter as two of its utilities) to establish the required voltage (7.6 V for the PD.185N02). Then, I measured the distortion with the Listen microphone placed 10 cm from the dust cap. Figure 11 shows the PD.185N02’s distortion curves.
Since this is my first “experience” characterizing a Precision Devices product, I will have to say I’m impressed. Professionally engineered and beautifully crafted are certainly words that come to mind.
www.precision-devices.com
This article was originally published in Voice Coil, October 2015.