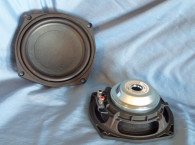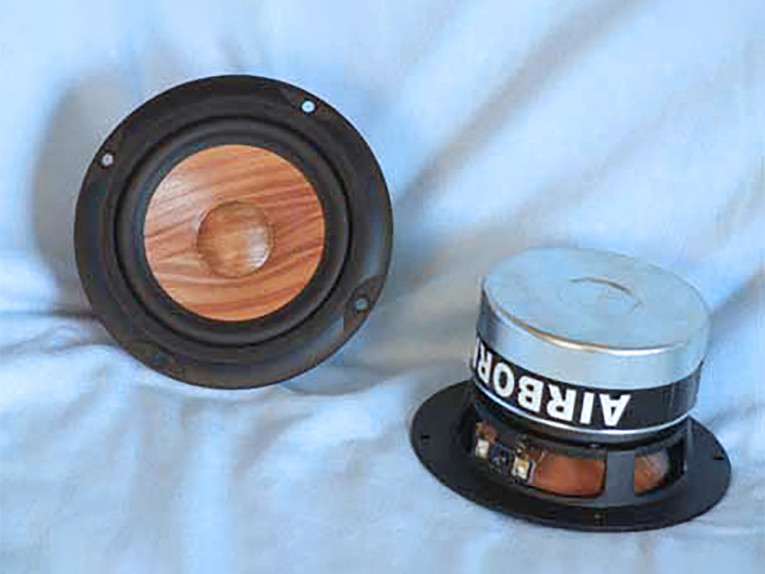

The motor is shielded for use near CRT’s and has the typical bucking magnet and cup configuration. Lead wires are terminated to a pair of gold-plated terminals. While I think the wood cones have a very unconventional appearance, I have heard them incorporated into a two-way speaker and their subjective sound quality was very nice.
As usual, I began testing the Airborne midrange using the LMS analyzer and VIBox to produce both voltage and admittance (current) curves with the driver clamped to a rigid test fixture in free-air at 0.3V, 1V, 3V, and 6V. I post-processed the eight 550 point stepped sine wave sweeps for each of the HR124 midrange samples and divided the voltage curves by the current curves (admittance) to produce impedance curves, phase added using the LMS calculation method, and along with the accompanying voltage curves, uploaded to the LEAP 5 Enclosure Shop software. In addition to the LEAP 5 LTD model results, I also produced a LEAP 4 TSL model set of parameters using just the 1V free-air curves.
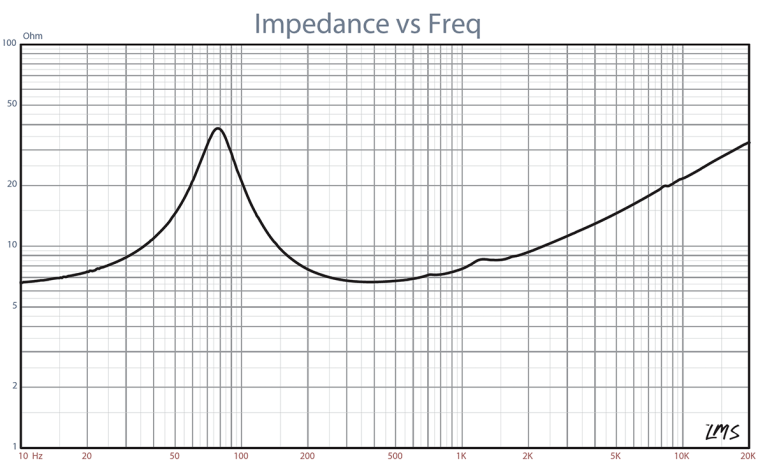
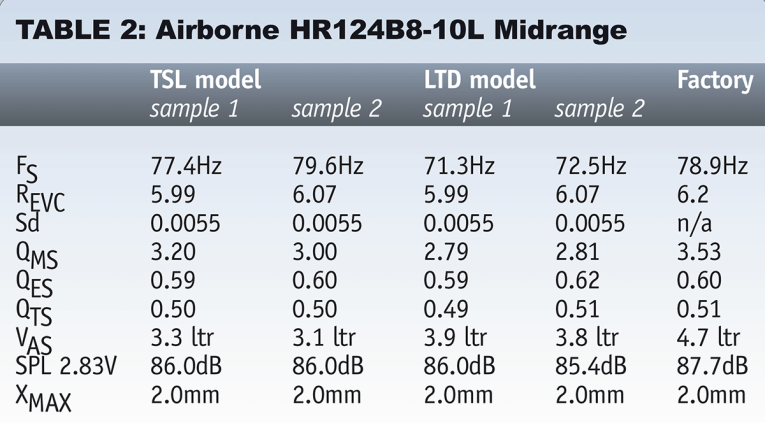
I selected the final data set, which includes the multiple voltage impedance curves for the LTD model (see Fig. 1 for the 1V free-air impedance curve) and the 1V impedance curve for the TSL model, and produced the parameters in order to perform the computer box simulations. Table 1 compares the LEAP 5 LTD and TSL data and factory parameters for both Airborne 4.5" samples. LEAP parameter calculation results for the Airborne 4.5" woofer was reasonably close to the Airborne factory data.
Given this, I set up computer enclosure simulations using the LEAP LTD parameters for Sample 1. This included two box simulations, both sealed. For the first closed box simulation I used a 169 in3 enclosure with 50% fiberglass fill material, and for the second sealed box, a 100 in3 enclosure also with 50% fiberglass fill material.
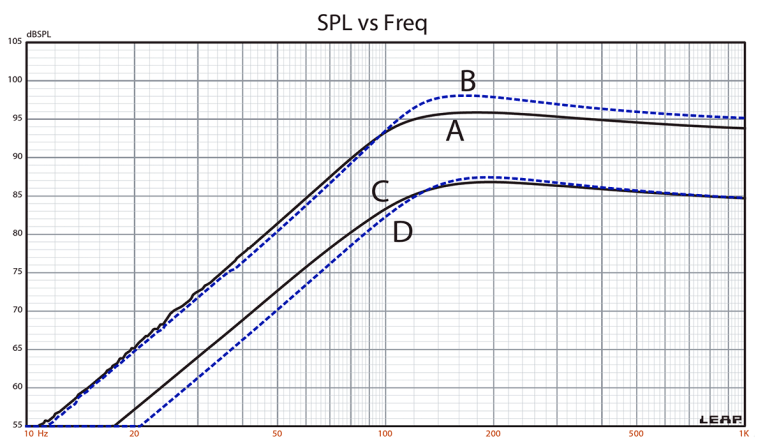
Figure 2 displays the results for the HR124B8-10L in the two sealed boxes at 2.83V and at a voltage level high enough to increase cone excursion to Xmax + 15% (2.3mm). This resulted in a F3 = 104Hz with a box/driver Qtc of 0.69 for the 169 in3 sealed enclosure and a -3dB = 115Hz and a box/driver Qtc of 0.80 for the 100 in3 simulation.
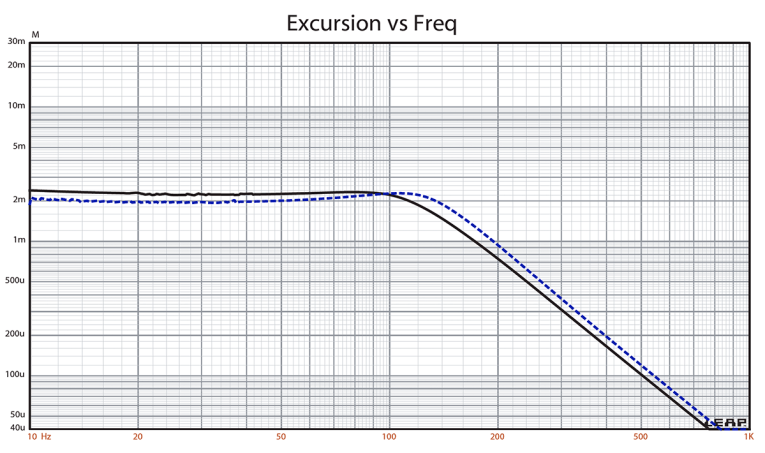
Increasing the voltage input to the two box simulations until the maximum linear cone excursion was reached resulted in 96dB at 9V for the first sealed enclosure simulation and 98dB with an 11V input level for the smaller sealed box (see Figs. 2 and 3 for the 2.83V group delay curves and the 9/11V excursion curves). Obviously, this is a midrange driver that is expected to have a high-pass filter placed somewhere between probably 400Hz-800Hz, so these output numbers would be considerably higher, but for a 4.5" driver with only 2mm Xmax, not so bad.
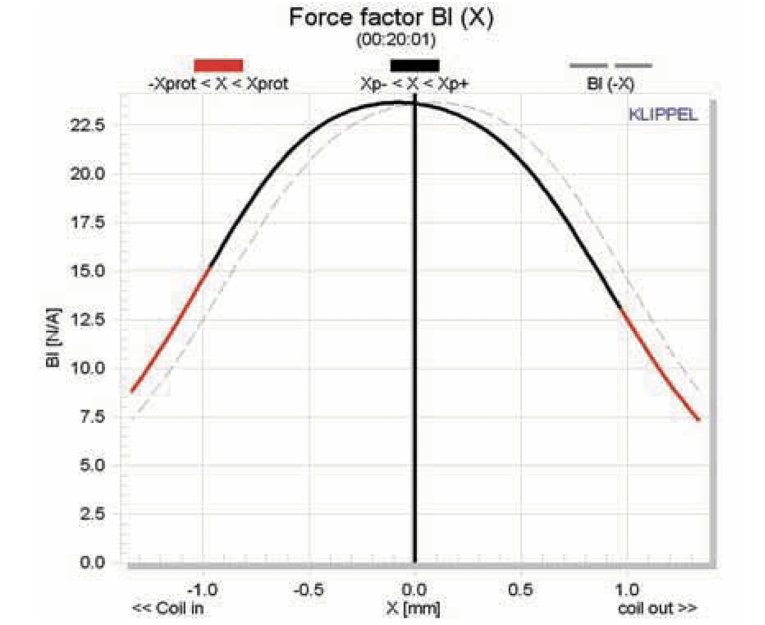
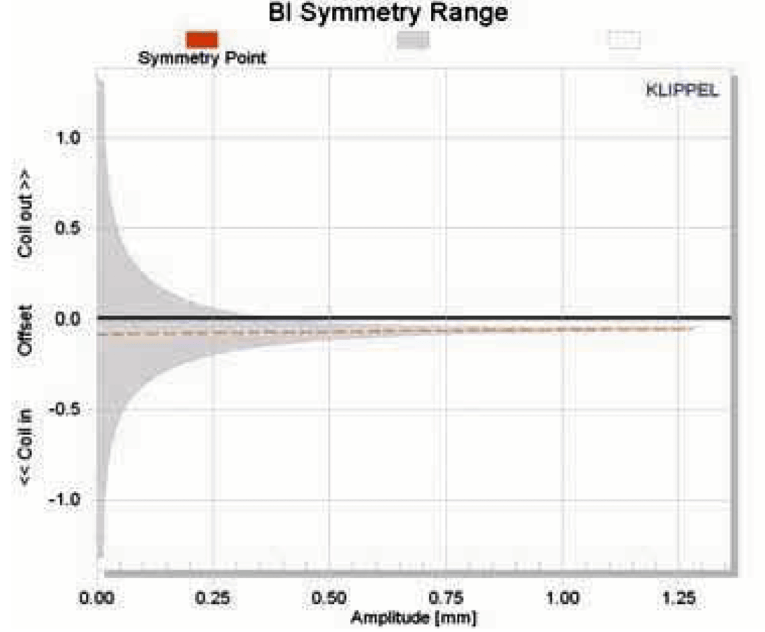
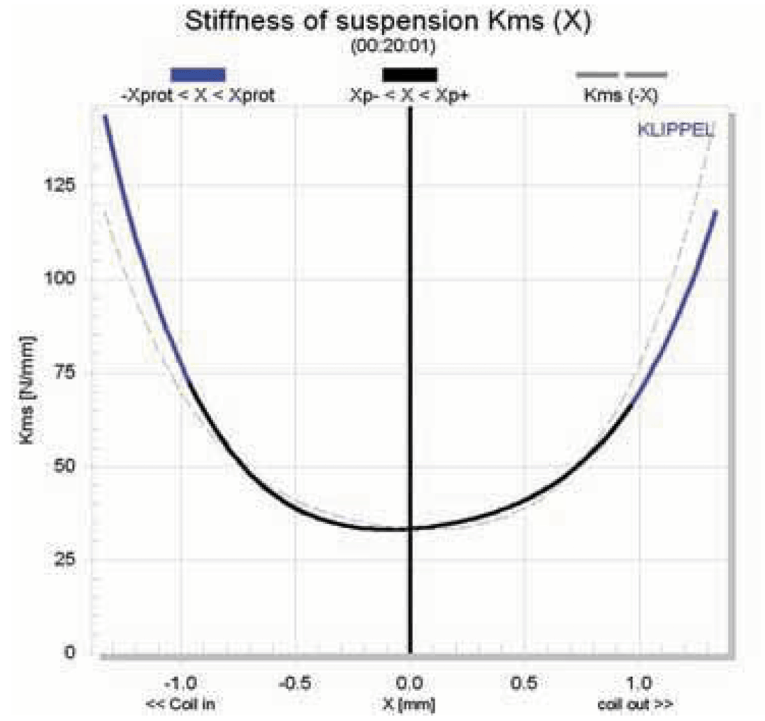

Klippel analysis for the Airborne woofer produced the Bl(X), Kms(X), and Bl and Kms symmetry range plots given in Figs. 5-8. The Bl(X) curve for the HR124 (Fig. 5) is very symmetrical and narrow as you would expect for a short Xmax driver. This is accompanied by a small amount of coil-in offset of 0.08mm at rest (see the Bl symmetry range plot in Fig. 6) that remains fairly constant throughout the operating range of the midrange. Figures 7 and 8 give the Kms(X) and Kms symmetry range curves. The Kms(X) curve has good symmetry, but also with a small 0.08mm rearward coil-in offset that transitions to a likewise trivial coil-out offset above 0.75mm of excursion.
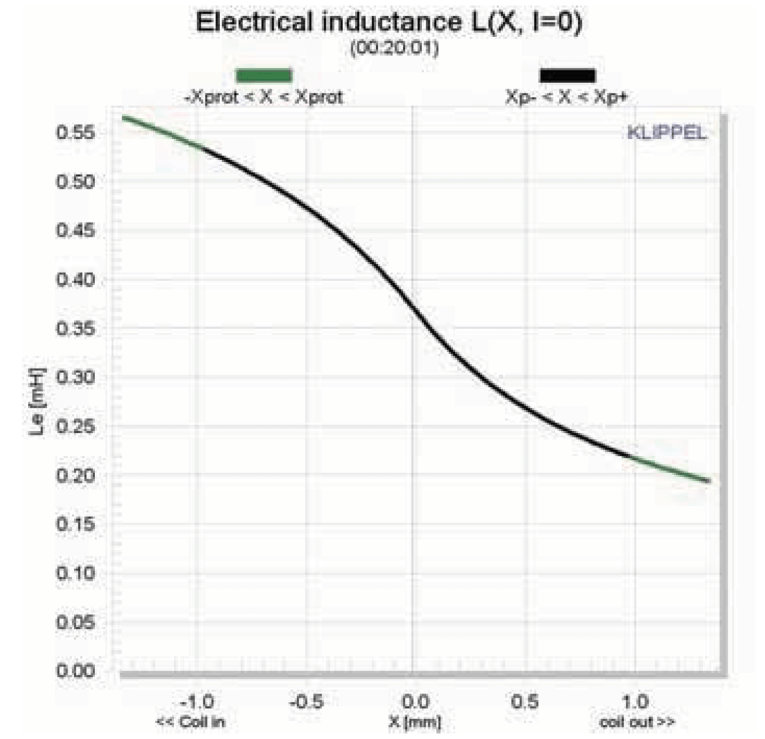
Displacement limiting numbers calculated by the Klippel analyzer for the Airborne woofer were XBl at 82% Bl = 0.6mm and for XC at 75% Cms minimum was 0.6mm, which means that for this 4.5" midrange, both factors were equal contributors to the 10% distortion level provided this driver were operating full-range, but being a midrange using a high-pass filter, this data is only for reference. Figure 9 gives the inductance curves Le(X) for the Airborne FR148 which shows the typical increase in inductance as the voice coil covers more of the pole piece.
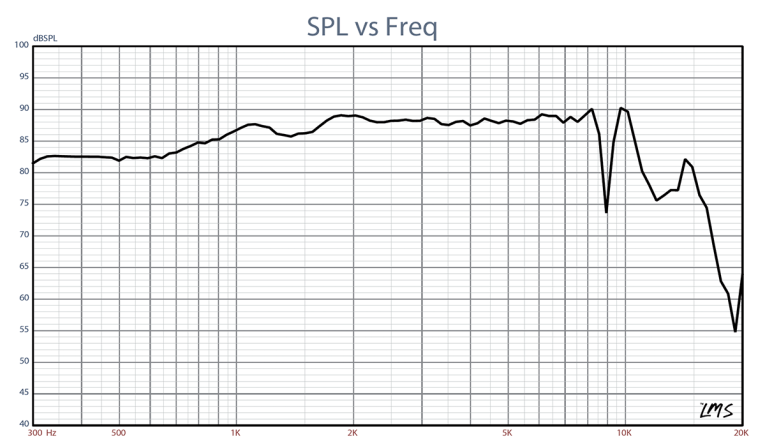

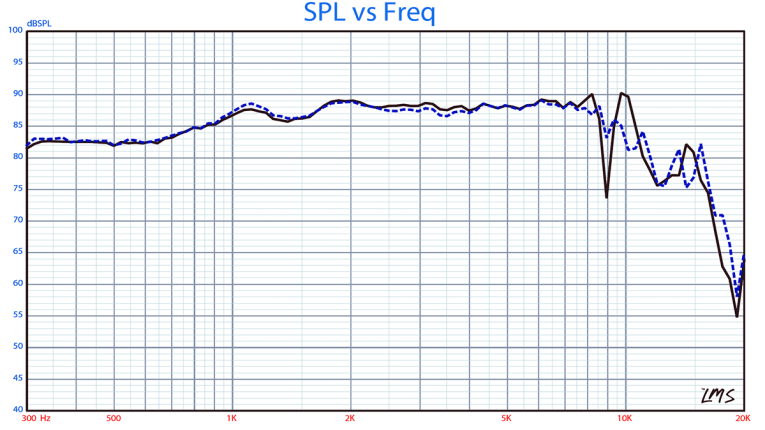
Following the Klippel testing, I mounted the HR124 midrange driver in an enclosure which had a 12" x 5" baffle that was filled with foam damping material and then measured the driver both on- and off-axis from 300Hz to 20kHz frequency response at 2.83V/1m using a 100 point gated sine wave sweep. Figure 10 depicts the on-axis response displaying a very smooth rising response to about 8.2kHz, followed by an out-of-phase dip in the response. Figure 11 gives the on- and off-axis frequency response at 0, 15, 30, and 45º. -3dB at 30º with respect to the on-axis curve occurs at 3.8kHz, so a 4kHz crossover frequency would be appropriate for this driver. And finally, Fig. 12 gives the two-sample SPL comparisons for the 4.5" Airborne midrange driver, showing a good match with some minor less than 1dB variations.


For the remaining testing on the Airborne HR124, I again fired up the Listen Inc. SoundCheck analyzer and SCM microphone and power supply to measure distortion and generate time frequency plots. Setting up for the distortion measurement again consisted of mounting the woofer rigidly in free-air, setting the SPL to 94dB at 1m (9.1V) using a noise stimulus (SoundCheck has a software generator and SPL meter as two of its utilities), and then measuring the distortion with the SCM microphone placed 10cm from the phase plug.
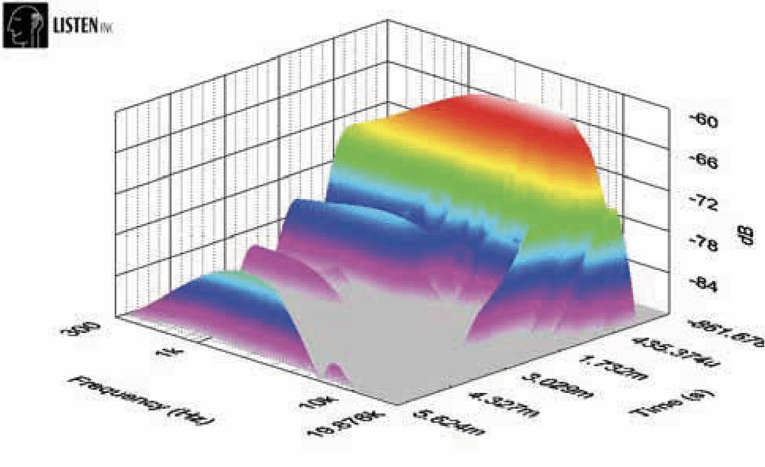
This produced the distortion curves shown in Fig. 13. For the last test on the Airborne HR124B8-10L, I used the SoundCheck analyzer to get a 2.83V/1m impulse response for this driver and imported the data into Listen Inc.’s SoundMap Time/Frequency software. The resulting CSD waterfall plot is given in Fig. 14 and the Wigner-Ville (for its better low-frequency performance) plot in Fig. 15. For more information on this and other Airborne woofers and tweeters, visit the Solen website www.solen.ca. VC
This article was originally published in Voice Coil, August 2010.