Test Bench: A Redesigned DE990TN-8 1.4” Compression Driver from B&C Speakers
June 28 2017, 10:00
The compression driver/horn that I received for testing in this edition of Test Bench was the redesigned B&C Speakers DE990TN-8, a 1.4” neodymium motor compression driver with a titanium diaphragm coupled with the ME90 horn. This article was originally published in Voice Coil, September 2016.
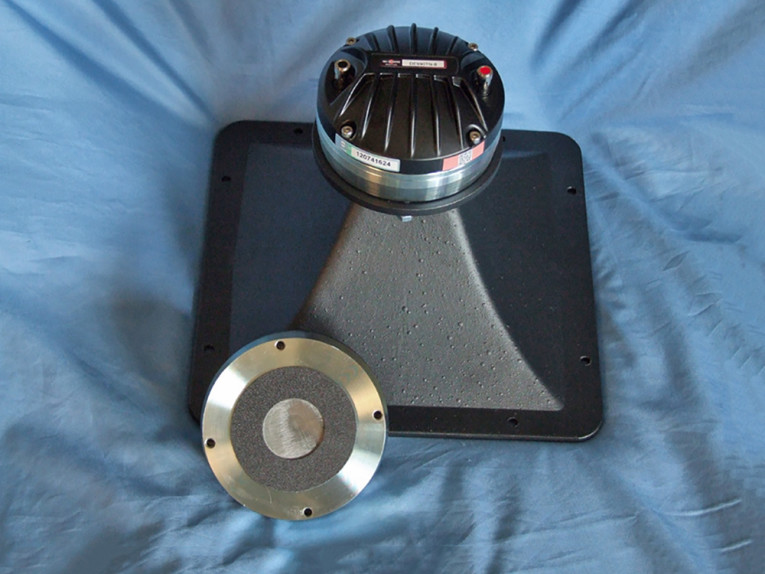
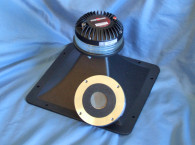
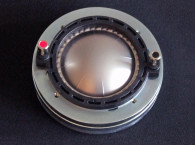
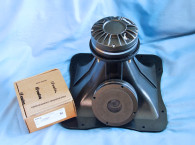
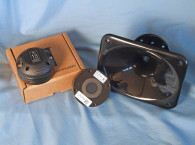
The driver I examined this month was the newly redesigned DE990TN-8 compression driver coupled with B&C Speakers’ ME90 constant directivity horn (see Photo 1). This compression driver is fairly compact with a 115 mm package diameter, achieved by using a specially milled inside ring neodymium magnet. The new DE990TN-8 was updated with a completely redesigned diaphragm that incorporates a bent edge voice coil former, a new dome and surrounds geometry, and an optimized phase plug. These modifications combine to better control diaphragm displacement and deformations, resulting in lower distortion and a smoother higher frequency response above 10 kHz.
Photo 1: The new DE990TN-8 compression driver is coupled with B&C Speakers’ ME90 constant directivity horn.
The redesigned DE990TN-8 joins B&C Speakers’ series of 1.4” throat compression drivers, at this time numbering 14 models (seven ferrite motor compression drivers and seven neodymium motor compression drivers). However, the new DE990TN-8 is the second highest power handling (100 W) model in the line. The DE990TN-8 has a 36 mm (1.4”) throat diameter. It is driven by a titanium diaphragm with an 86 mm (3.4”) diameter voice coil wound with copper-clad aluminum wire (CCAW). Other features include a neodymium ring magnet motor structure, nominal 100 W rated power handling (200 W continuous), an injection-molded aluminum black heatsink, and color-coded chrome push terminals. The horn supplied with the DE990TN-8 is B&C Speakers’ 1.4” throat 80°H × 60°V constant directivity cast-aluminum ME90 horn with a 0.9 kHz cutoff frequency. B&C Speakers recommends a minimum 1 kHz crossover frequency (with at least a second-order high-pass active or passive filter) with a published 500-Hz-to-18-kHz frequency range.
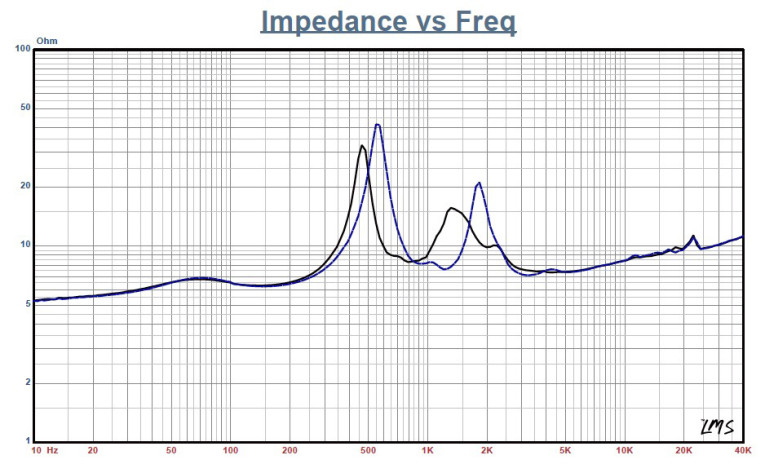
Figure 1: B&C DE990TN-8 free-air impedance plot.
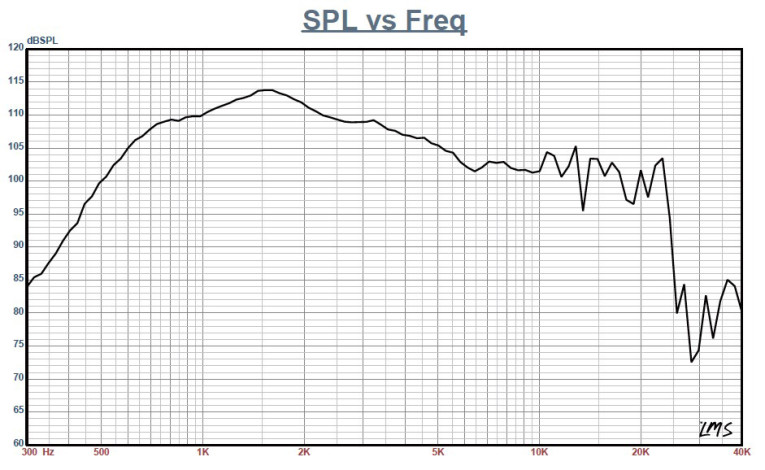
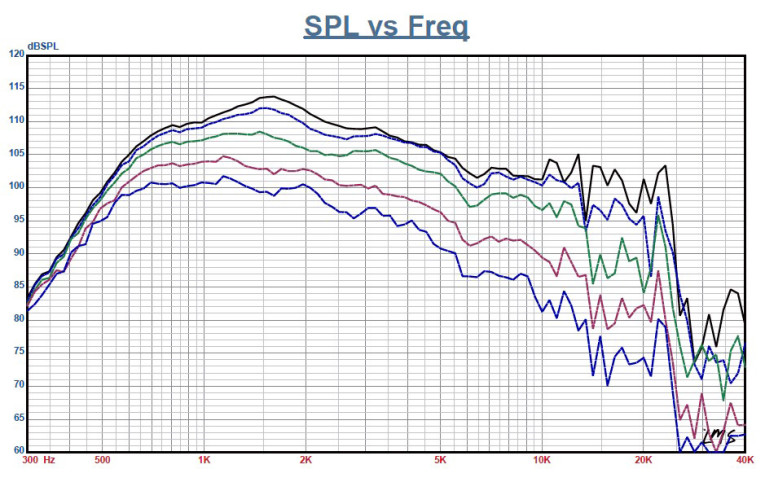
Figure 2: B&C DE990TN-8 on-axis frequency response.
I used the LinearX LMS analyzer to produce the 300-point stepped sine wave impedance plot shown in Figure 1. The solid black curve represents the DE990TN-8 mounted on the ME90 horn. The dashed blue curve represents the compression driver without the horn. With a 5.94 Ω DCR, the minimum impedance of the DE990TN-8/ME90 was 7.35 Ω and at 4.2 kHz.
Next, I free-air mounted the DE990TN-8/ME90 on my manual turntable without an enclosure and measured both the horizontal and vertical on and off axis at 2.83 V/1 m using a 100-point gated sine wave sweep from 0° on axis to 60° off axis. Figure 2 shows the on-axis frequency response, which is smooth with no major anomalies. It has a declining response from 1.5 to 10 kHz with the frequency response extending all the way to 23.2 kHz before beginning its low-pass roll-off.
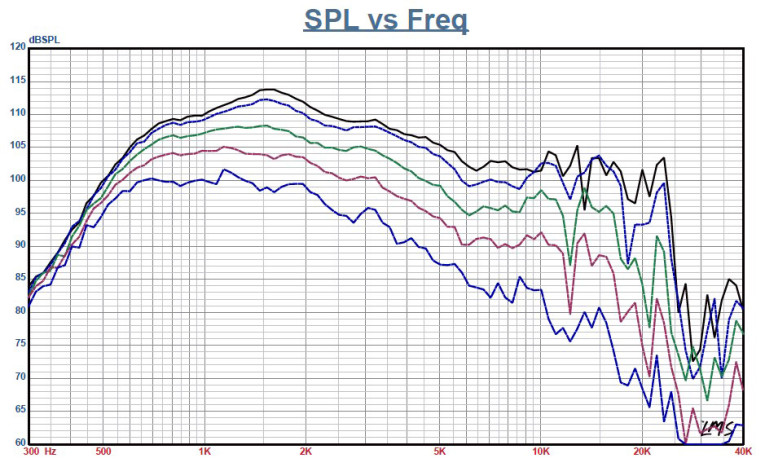
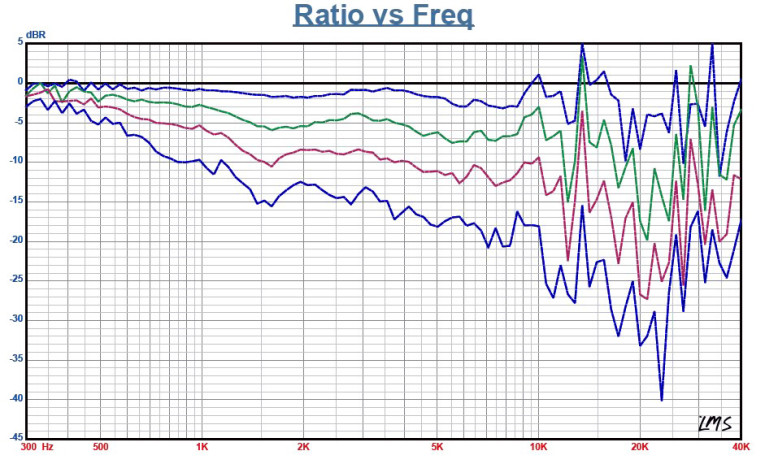
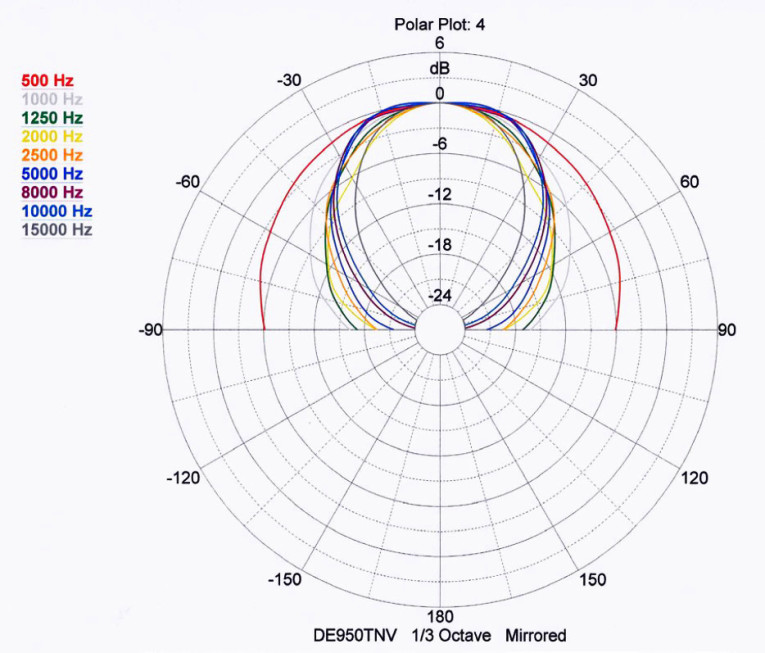
Figure 3 gives the on- and off-axis response in the horizontal plane. Figure 4 shows the normalized horizontal plane response. Figure 5 shows the CLIO Pocket generated horizontal polar plot (with 1/3 octave smoothing applied). Figure 6 gives the on- and off-axis response in the vertical plane. Figure 7 depicts the normalized vertical plane response. Figure 8 shows the CLIO Pocket generated vertical axis polar plot (also with 1/3 octave smoothing applied). Figure 9 has the two sample SPL comparison showing the two DE990TN-8 compression driver samples to be closely matched within less than 1 dB.
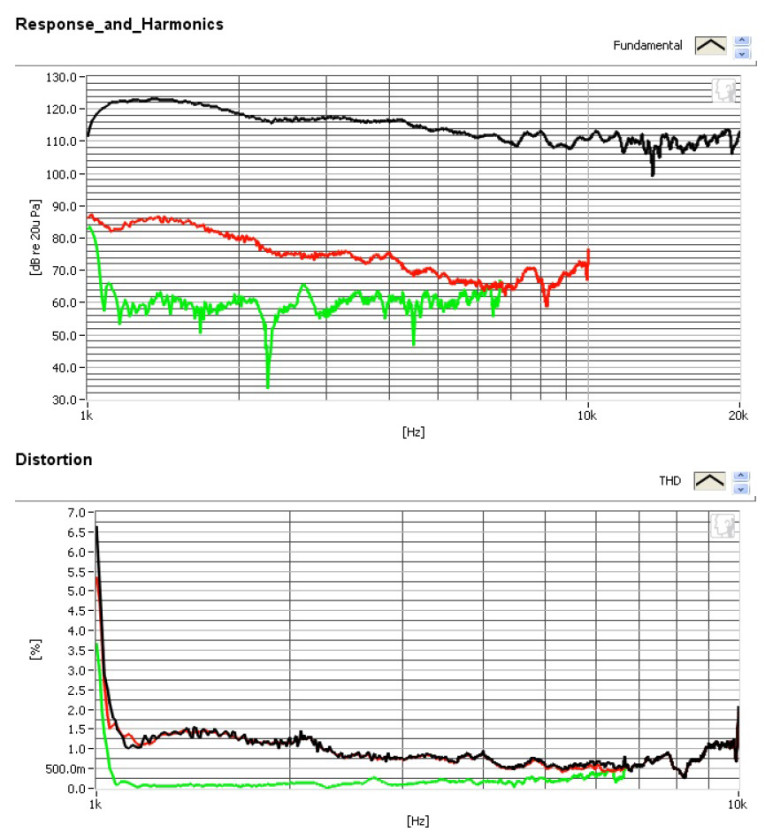
For the remaining tests, I set up the Listen, Inc. AmpConnect ISC analyzer and 0.25” SCM microphone and power supply to measure distortion and generate time-frequency plots. For the distortion measurement, I mounted the DE990TN-8/ME90 combination in free air and set the SPL to 104 dB at 1 m (2.08 V, which I determined using a pink noise stimulus generator and internal SLM in the SoundCheck 14 software). I measured the distortion with the Listen microphone placed 10 cm from the mouth of the horn. This produced the distortion curves shown in Figure 10.
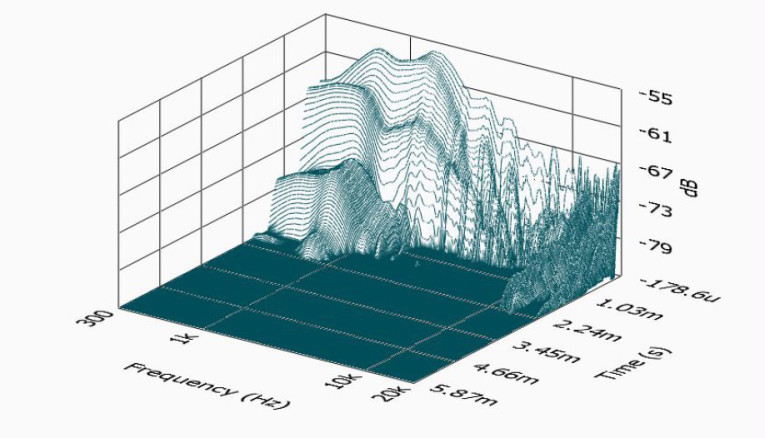
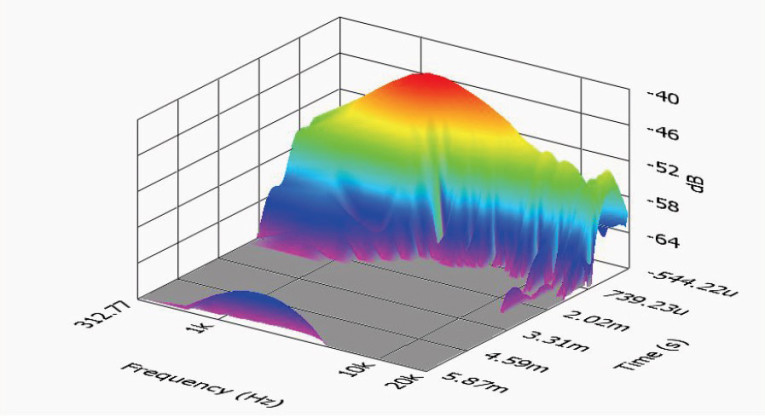
I set up SoundCheck 14 to generate a 2.83 V/1 m impulse response curve. Next, I imported the data into Listen’s SoundMap Time/Frequency software. Figure 11 shows the cumulative spectral decay (CSD) waterfall plot. Figure 12 shows the Short Time Fourier Transform (STFT) plot.
Figure 12: B&C DE990TN-8 SoundCheck Short Time Fourier Transform (STFT) plot.
Italian pro sound B&C Speakers is a consistent OEM, with great build quality, performance, and engineering, and the new DE990TN-8, like last month’s DE1090TN, falls into that category.
For more information, visit www.bcspeakers.com.
This article was originally published in Voice Coil, September 2016.
About Vance Dickason
Vance Dickason has been working as a professional in the loudspeaker industry since 1974. A contributing editor to Speaker Builder magazine (now audioXpress) since 1986, in November 1987 he became editor of Voice Coil, the monthly Periodical for the Loudspeake... Read more