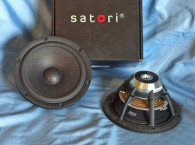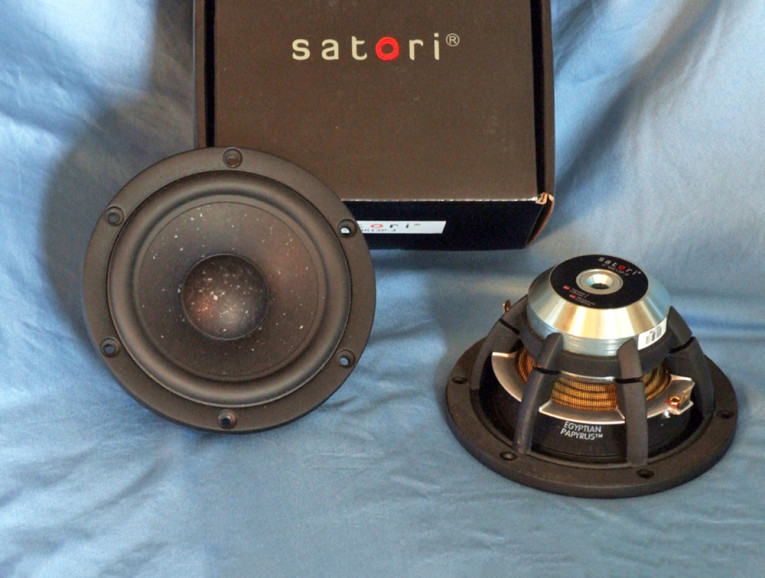
The feature set for the MR13P-4 is similar to the original Satori MW13P. The MR13P-4 is built on the same cosmetically attractive six-spoke frame that has a minimal reflective footprint behind the cone to reduce reflections and a completely open area beneath the spider mounting shelf for enhanced cooling— both highly desirable attributes. Additional cooling is provided by venting the voice coil former and a 12 mm diameter pole vent. The spider mounting shelf itself is pinned to the frame to limit vibration transfer from the frame to this part of the suspension system. The neodymium motor cup attaches to the bottom of the frame and has a separate cosmetic/heatsink part that looks like the continuation of the frame attached to the peripheral of the motor.
The motor is comprised of a neodymium ring magnet and the cup that completes the field and forms the gap area. There is an overhung copper sleeve shorting ring to reduce distortion. The device uses a 30.5 mm (1.2”) diameter voice coil with a nonconducting fiberglass former wound with round copper-clad aluminum wire (CCAW), and terminated to a pair of gold-plated terminals located on opposite sides of the frame to minimize rocking modes.
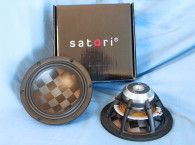
The cone and dust cap material are also unique and composed of 60% pure Egyptian papyrus parchment fibers, an expensive, but light and stiff material. Suspension is provided by a nitrile butadiene rubber (NBR) surround that uses a special vertical and horizontal attachment process, along with a Dr. Kurt Muller Bimax spider. Bimax is purported to have less twisting tendencies compared to other cloth spider materials and is shaped with a durometer resin.
I began testing the MR13P-4 using the LinearX LMS analyzer and VIBox to create voltage and admittance (current) curves with the driver clamped to a rigid test fixture in free air at 0.3, 1, 3, and 6 V. Since the MR13P-4 has a 3 mm Xmax, like the average 5.25” woofer, it stayed linear enough for LEAP 5 to get a good curve fit on the 6 V sweep. It should also be noted that this multi-voltage parameter test procedure includes heating the voice coil between sweeps for progressively longer periods to simulate operating temperatures at that voltage level to raise the winding temperature to the third time constant.
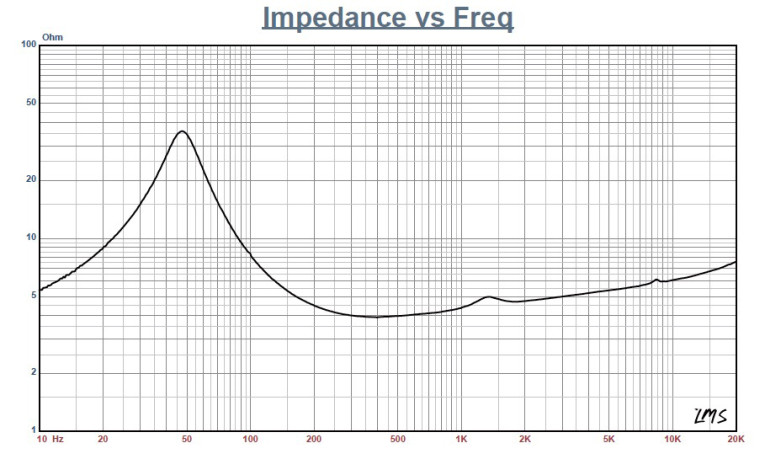
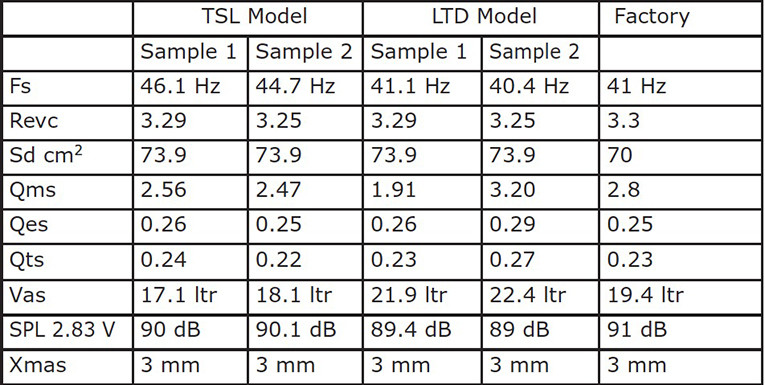
I post-processed the ten 550-point stepped sine wave sweeps for each MR13P-4 sample and divided the voltage curves by the current curves (admittance) to create the impedance curves, phase added using LMS calculation method. I uploaded the data, along with the accompanying voltage curves, to the LEAP 5 Enclosure Shop software. Besides the LEAP 5 LTD model results, I additionally created a LEAP 4 TSL model set of parameters using just the 1 V free-air curves. I selected the final data, which includes the multiple voltage impedance curves for the LTD model and the 1 V impedance curve for the TSL model, and created the parameters to perform the computer box simulations. Figure 1 shows the 1 V free-air impedance curve. Table 1 compares the LEAP 5 LTD and TSL data and for both MR13P-4 samples, as well as the factory parameters.
LEAP parameter calculation results for the MR13P-4 correlated well with the SB Acoustics factory parameters, which always make me “smile.” As with any midrange explication, it is obvious that a midrange driver such as the MR13P-4 will never get used in its piston range and probably crossed over between 200 to 300 Hz or higher, octaves higher in frequency than its piston range performance.
The reason I go through the box simulation exercise is to get an idea of the frequency and Q of the impedance resonance, as this information is useful if you are designing a passive high-pass section of a passive band-pass network. Given this, I set up computer enclosure simulations using the LEAP LTD parameters for Sample 1. I set up two box simulations—one sealed Butterworth (Qtc = 0.7) alignment and another vented box QB3 alignment.
For the Butterworth closed-box simulation, I used a 125 in3 enclosure with 50% fiberglass fill material. For the QB3 box simulation, I used a 208 in3 box with 15% fiberglass fill material and tuned to 67 Hz. You don’t see a vented midrange enclosures that often, but the Focal Trio6 Be studio monitor is a good example of this application. Sometimes, a vented enclosure can produce a lower frequency impedance peak that makes a passive network easier to realize, or the ability to lower the high-pass crossover frequency on the midrange.
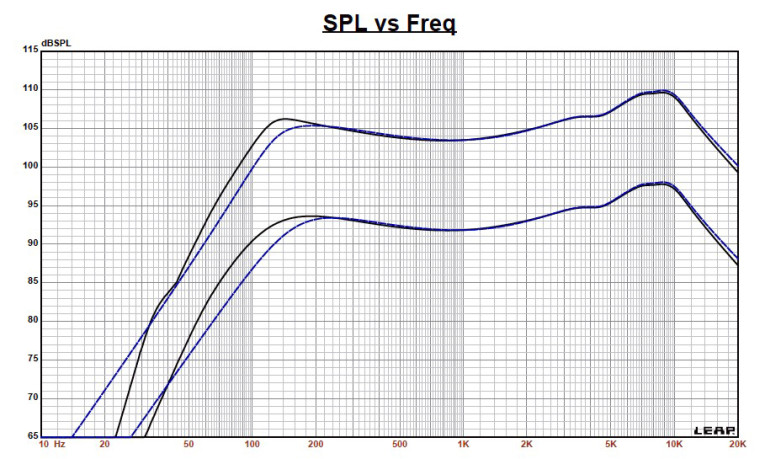
Figure 2 illustrates the results for the MR13P-4 in the sealed and vented enclosures at 2.83 V and at a voltage level sufficiently high enough to increase cone excursion to 3.45 mm (Xmax + 15%). This yielded a F3 = 131 Hz (F6 = 104 Hz) with a box/driver Qtc of 0.67 for the 125 in3 sealed enclosure and a –3 dB = 101 Hz (-6 dB =82 Hz) 209 in3 vented box simulation. Increasing the voltage input to the simulations until the maximum linear cone excursion was reached resulted in 105.5 dB at 12.5 V for the sealed enclosure simulation and 106 dB with at the same 12.5 V input level for the vented box.
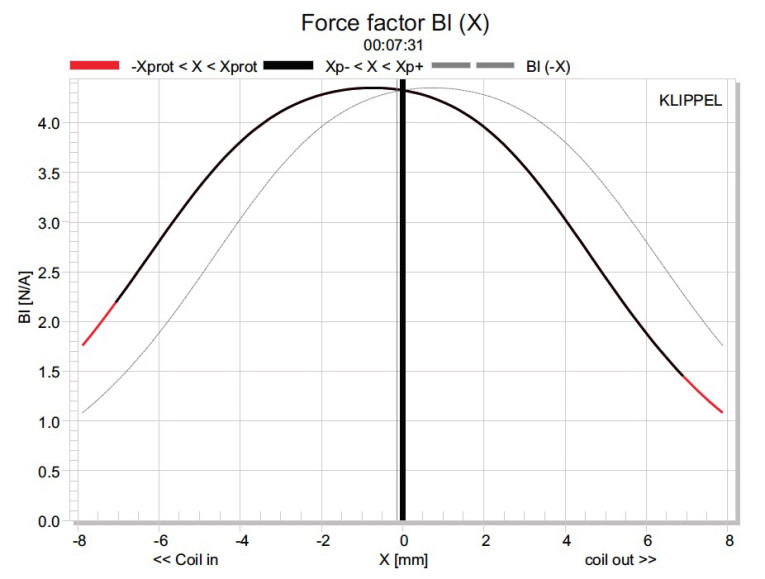


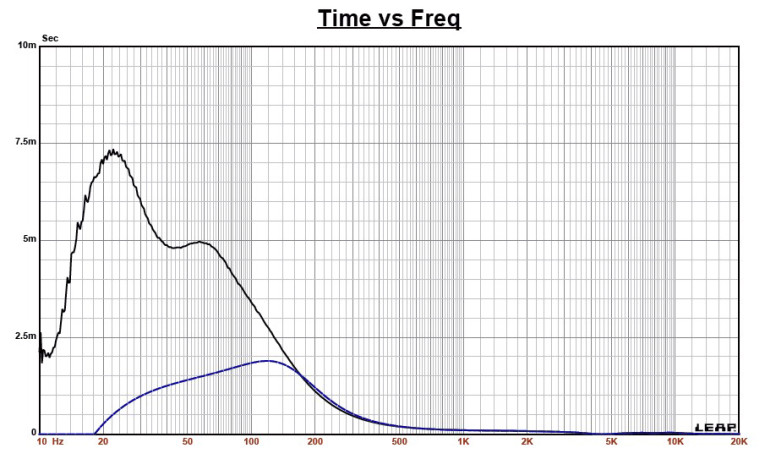
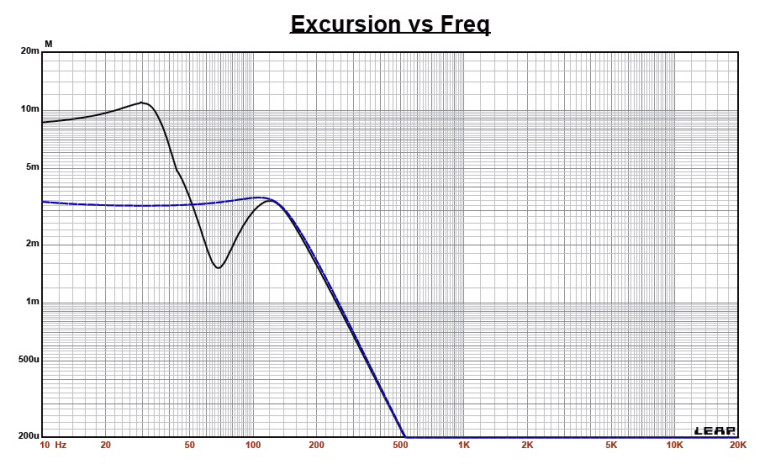
Figure 3 shows the 2.83 V group delay curves. Figure 4 shows the 12.5 V excursion curves. Since the MR13P-4 will likely high-pass above 200 Hz, the maximum sound pressure level (SPL) will be several decibels higher that its maximum piston range SPL. Klippel analysis on a midrange isn’t really necessary, as the driver is not expected to operate in this range. However, I think it’s good to look at the data just to see how well balanced the device is. That said, Klippel analysis for the MR13P-4 produced the Bl(X), Kms(X), and Bl and Kms symmetry range plots given in Figures 5–8. The Bl(X) curve (see Figure 5) is fairly symmetrical with some obvious coil-in offset.
Looking at the Bl symmetry plot (see Figure 6), this curve shows a minor coil rearward (coil in) offset at the 2 mm position (a point of reasonable certainty) of 0.76 mm that is fairly constant out to the MR13P-4’s physical Xmax, so its likely just a small coil in offset, that easily could be deliberate. Note that the data at rest has a fair degree of uncertainty (the expanding grey area indicates the level of uncertainty of the graph), but a high degree of certainty at the 3 mm position.
Figure 7 and Figure 8 show the Kms(X) and Kms symmetry range curves for the SB MR13P-4. The Kms(X) curve looks rather symmetrical in both directions with some minor offsets in the coil position as reflected in the Kms symmetry range curve. The coil-in offset displayed in the Kms symmetry range curve is 0.26 mm at the MR13P-4’s physical Xmax, so both Bl and compliance are well balanced even if this was a woofer operating in its piston range. Displacement limiting numbers calculated by the Klippel analyzer for the MR13P-4 were XBl @ 82% Bl = 3mm and for XC at 75% Cms minimum greater than 4 mm, which means that for the MR13P-4, if the driver was operating in the piston range, which it will likely not be, the Bl was the limiting factor for a distortion level of 10%, and it was equal to the driver’s physical Xmax.
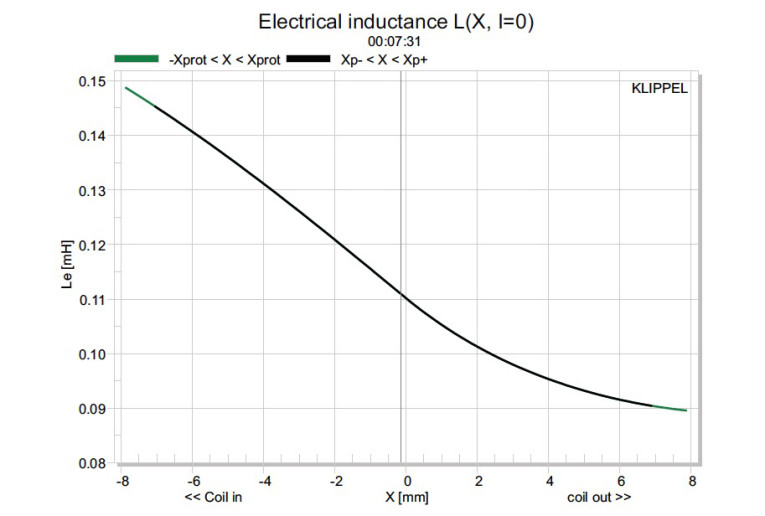
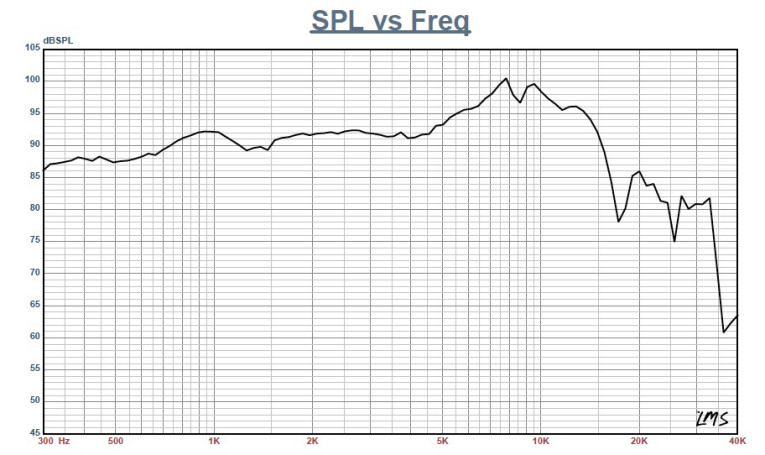
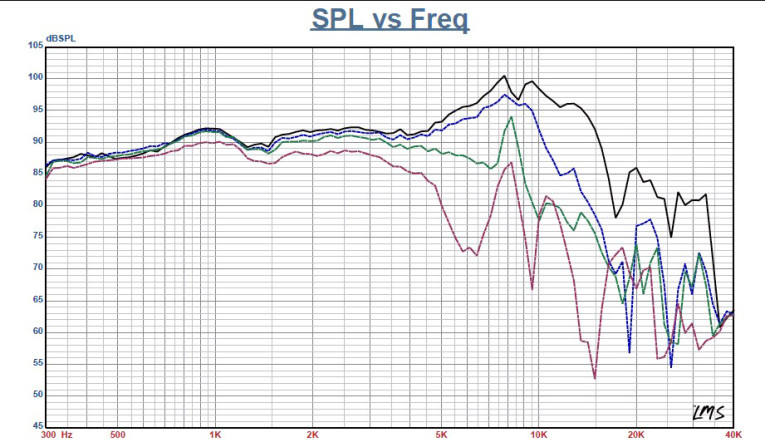
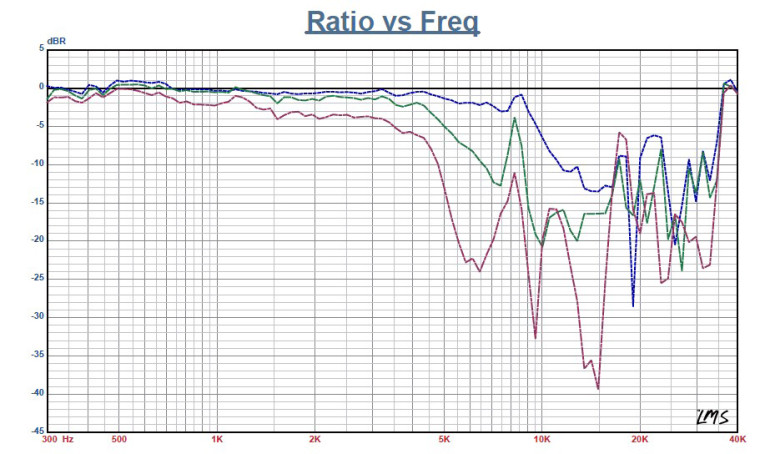
Figure 9 gives the MR13P-4’s inductance curves L(X). The curve indicates an increasing inductance as the coil moves inward, however, there is only a minor change in inductance throughout the MR13P-4’s operating range—a key to its low distortion performance is the motor’s copper shorting ring (Faraday shield). Inductance change from the rest position to the Xmax coil-out position was 0.012 mH, and 0.016 mH to the Xmax coil-in position — which is excellent performance if it were a woofer, which it’s not.
Next, I mounted the MR13P-4 in an enclosure that had a 13” × 6” baffle and was filled with damping material (foam). Then, I measured the device under test (DUT) on and off axis from a 300 Hz to 40 kHz frequency response at 2.83 V/1 m using a 100-point gated sine wave sweep. Figure 10 gives the MR13P-4’s on-axis response displaying a smooth rising response to about 5 kHz with some minor peaking at 7.8 kHz, followed by a nominal second-order low-pass roll off above 10 kHz.
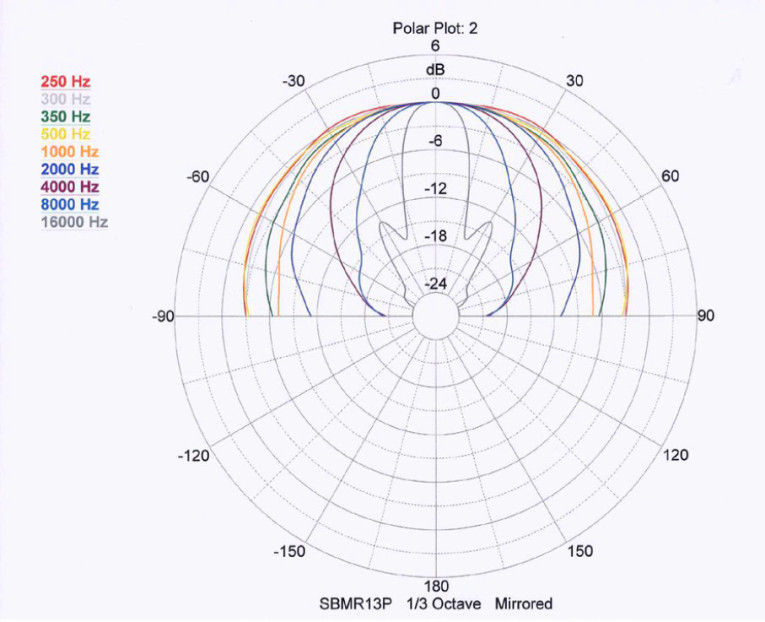
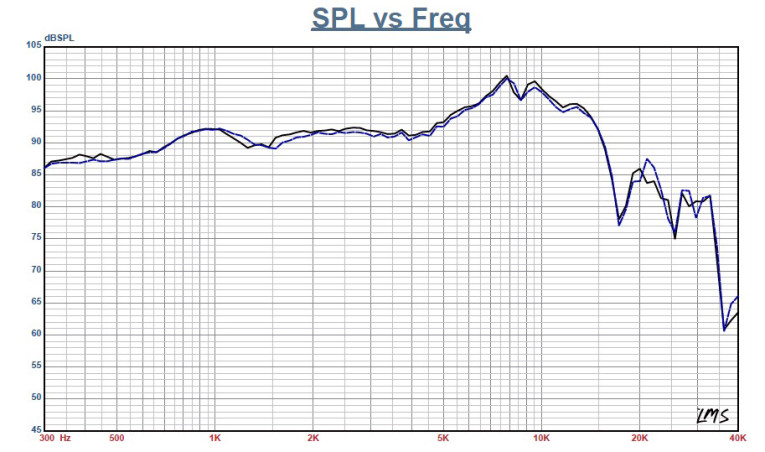
Figure 11 depicts the on- and off-axis frequency response at 0°, 15°, 30°, and 45° with the normalized view shown in Figure 12 and the associated CLIO polar plot shown in Figure 13. The -3 dB at 30°, with respect to the on-axis curve shown in Figure 11, occurs at 4.5 kHz, so a cross point in that vicinity should be adequate to achieve reasonable power response. Figure 14 shows the last SPL measurement and gives the two-sample SPL comparisons, showing a close match over the MR13P-4’s operating range.
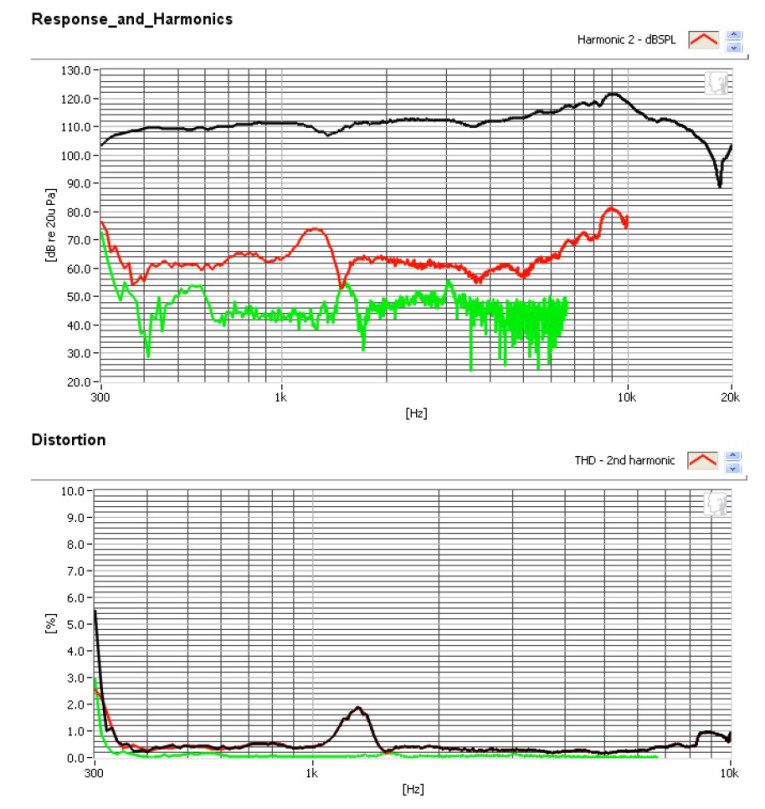
For the last group of tests, I employed the Listen SoundConnect analyzer and the SCM-2 microphone (courtesy of Listen, Inc.) to measure distortion and generate time-frequency plots. Set up for the distortion measurement consisted of mounting the woofer rigidly in free air and setting the SPL to 94 dB at 1 m (3.06 V), using a noise stimulus. (SoundCheck 14 has a software generator and SPL meter as two of its utilities.) Next, I measured the distortion with the Listen microphone placed 10 cm from the dust cap. This produced the distortion curves (now being displayed on a log scale) shown in Figure 15.
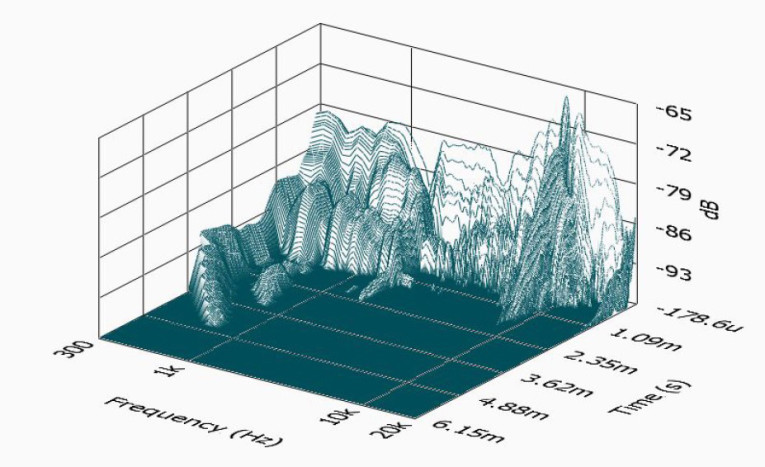
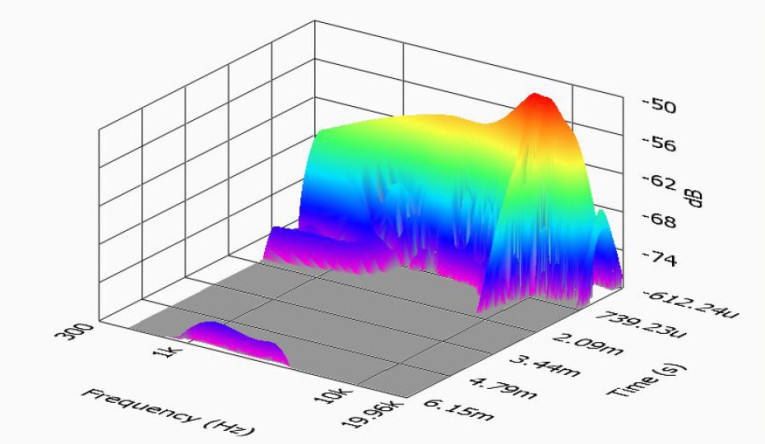
Last, I employed the SoundCheck analyzer to get a 2.83 V/1 m impulse response and imported the data into Listen’s SoundMap Time/Frequency software. Figure 16 shows the resulting cumulative spectral decay (CSD) waterfall plot. Figure 17 shows the Wigner-Ville logarithmic surface map plot (used for its better low-frequency performance). After reviewing all the data collected for this transducer, I would conclude that this is a very well-designed midrange, especially given the fact that the design comes from the very capable engineers at Danesian Audio!
www.sbacoustics.com. VC
This article was originally published in Voice Coil, February 2017.