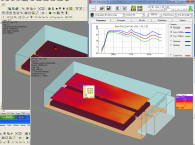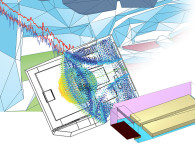
In 1989, Odeon introduced hybrid models, combining cuboid-net-method ray tracing with image source methods (applied differently for early and late reflections) for more reliable results and faster calculation. In 1991, Odeon officially released ODEON V. 1.0, along with a comparison against data measured at the Royal Festival Hall in London. Improved calculation methods and analysis capabilities, as well as auralization, were added to ODEON during the early 1990s. Version 12, explored in this article, incorporates an impulse response measurement system integrated in the software enabling easy comparison of calculated and measured responses. This addition to the software eases tuning models of real spaces to match their actual performance.

The application allows drawing 2-D surfaces on a selected plane that can be extruded to provide a 3-D geometry directly recognized in ODEON. The application supports layers. When different extrusion planes are required for a complex model, the user can create a different file — one for each extrusion plane — and combine them into a single one. ODEON can also import model geometry from dxf, 3ds, and SketchUp files. Alternatively, a model can be entirely built using the geometric modeling commands available in the ODEON editor.
After the model has been entered, it will appear on the screen in a wireframe view. Material for the surfaces in the model can be chosen via a Materials List screen (see Photo 1). ODEON includes a fairly comprehensive materials list, cataloged by type: simple absorbers, brick, ceramic tiles, wood, audiences, and so forth. The user can also create and use custom materials or material libraries.
The scattering coefficients for all materials are also available on the Material List, but only the midband scattering (average of 500 Hz and 1 kHz bands) is entered. ODEON calculates scattering in the other bands, weighting low-frequency values lower than high frequency values. Scattering is applied by the surface, not by the material.

With the materials entered, the user can view the open graphics library (OGL) rendering of the model. Colors are derived according to the average reflectance of materials, following this RGB color model throughout the audible frequency range: red for low frequencies, green for mid frequencies, and blue for high frequencies, corresponding to the type of frequency range of light. Each color family is varied from black to white for 0% to 100% reflectance, respectively. High absorption at high frequencies leads to “warm” colors, while high absorption at low
frequencies leads to “cool” colors.
This article was originally published in audioXpress, July 2014.
Read the complete article now available here.


