In 2017, the US Congress directed the US Food and Drug Administration (FDA) to develop regulations for over-the-counter hearing aids that could be sold without consultation from an audiologist. Although the FDA didn’t release these regulations until 2022, many manufacturers jumped the gun by launching “hearables” — products that weren’t sold as hearing aids, but nonetheless were intended to enhance hearing.
Products such as the NuHeara IQbuds2 Max (reviewed in the July 2021 audioXpress) were, in essence, true wireless earphones with hearing-assistance features built in. Apple added hearing-assistance functions to its hyper-popular AirPods Pro earphones, and later added a hearing-protection function — a hear-through mode intended to limit any sound reaching the eardrums to 85dB, a level generally accepted to be safe for eight hours of exposure.
Now let’s get to the pandemic. Millions of office workers were forced to work from home, where their attempts to focus on spreadsheets or make Zoom calls were often disrupted by noise from other family members. Interest in noise-cancelling headphones rose fast, even though most headphone noise-cancelling systems are designed primarily to reduce airplane cabin noise, not voices or blaring TV sets.
Adaptive noise cancelling — launched most prominently in the Apple AirPods Pro in 2019, and now available in countless headphones and earphones—promised to tune the function of noise-cancelling systems to better suit other environments in addition to airplanes, in some cases blocking low-frequency noise while allowing speech in.
Because of these developments, high-end wireless headphones and earphones have evolved from being mere playback devices into products that promise total control over what enters your ears — reducing unwanted noise and blocking dangerously loud sounds, while enhancing the sounds you do want to hear, such as conversations.
The Challenge
For engineers and reviewers, though, these new functions present considerable difficulties when it comes time to evaluate their efficacy. The standard method for measuring isolation provided by headphones and earphones — whether through active noise cancelling (ANC) or passive noise blocking—is described in the IEC 60628-7 standard. It employs uncorrelated pink noise played from eight sources surrounding a measurement fixture, such as an ear/cheek simulator or head-and-torso simulator (HATS). The headphones or earphones are placed on the test fixture, and a spectrum analysis is performed to show how and at what frequencies the headphones or earphones reduce the level of sound reaching the fixture’s test microphone.
This method worked well in the days when ANC was a simple “on/off” feature. But because the method presents only one stimulus at a fixed level, it offers no way of evaluating how well an adaptive noise cancelling system adjusts itself to optimize performance in different environments. And while this method is somewhat useful in evaluating transparency (or hear-through), voice-enhancement and environmental noise functions, the results are difficult to interpret and not particularly reflective of real-world situations.
“Pink noise is great as a development tool, but it’s not realistic,” Jacob Soendergaard, account manager at HEAD acoustics, said. “It doesn’t simulate user situations, and it doesn’t stress the DSP in a realistic way.”
I had made some efforts to characterize these functions in my work for Wirecutter, a product-recommendation site, resorting to such seat-of-the-pants techniques as flanking my GRAS 43AG ear-cheek simulator with a pair of PA speakers playing a simulated music clip (crafted to sound like music but produce a pink noise-like spectrum and level consistency) at 105dBA. After seeing a video I made about my testing, Soendergaard told me that HEAD acoustics had worked out a much more formalized version of what I was attempting, and asked if I’d like to visit the company’s US headquarters in Brighton, MI, to see what they’re doing.
Quantifying the Previously Unquantifiable
Soendergaard explained that in keeping with HEAD acoustics’ preference for relying on existing standards, the company based its work on measurement techniques outlined in ETSI TS103 224. The goal was to simulate environments that a consumer might typically encounter when using headphones and earphones equipped with various hearing enhancement and protection features. These can include any combination of ANC (or passive noise blocking), a hear-through function, voice enhancement, and hearing protection. They can also be used to evaluate earplugs and active hearing protection products.
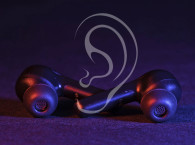
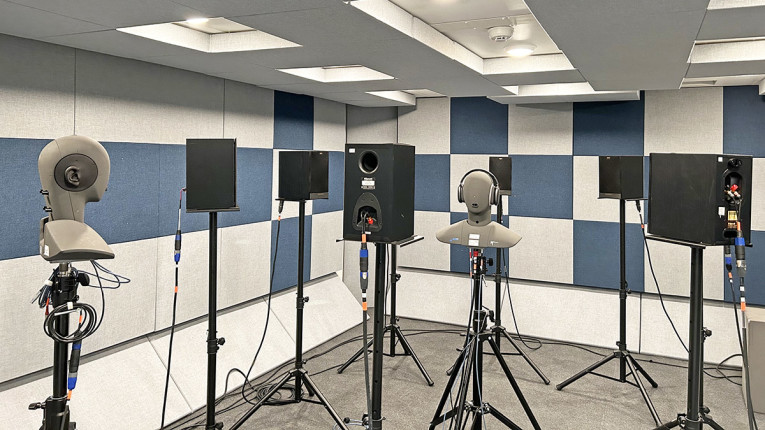
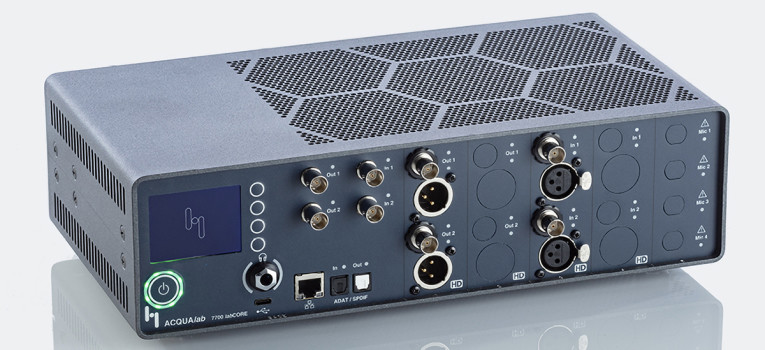
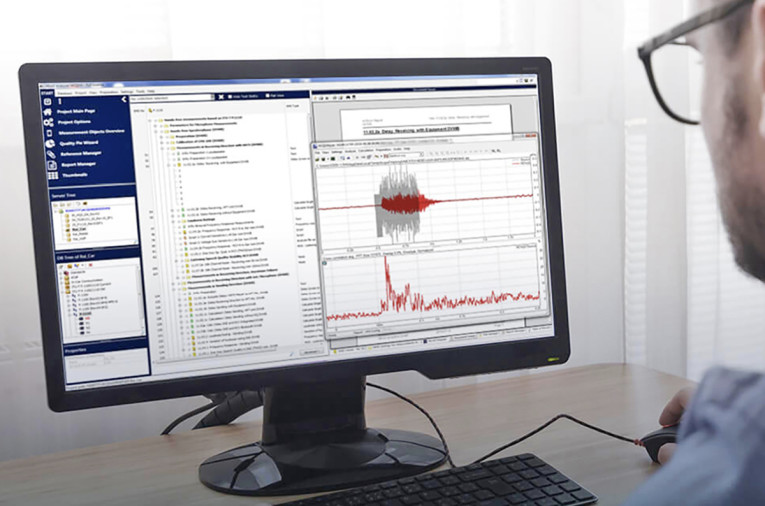
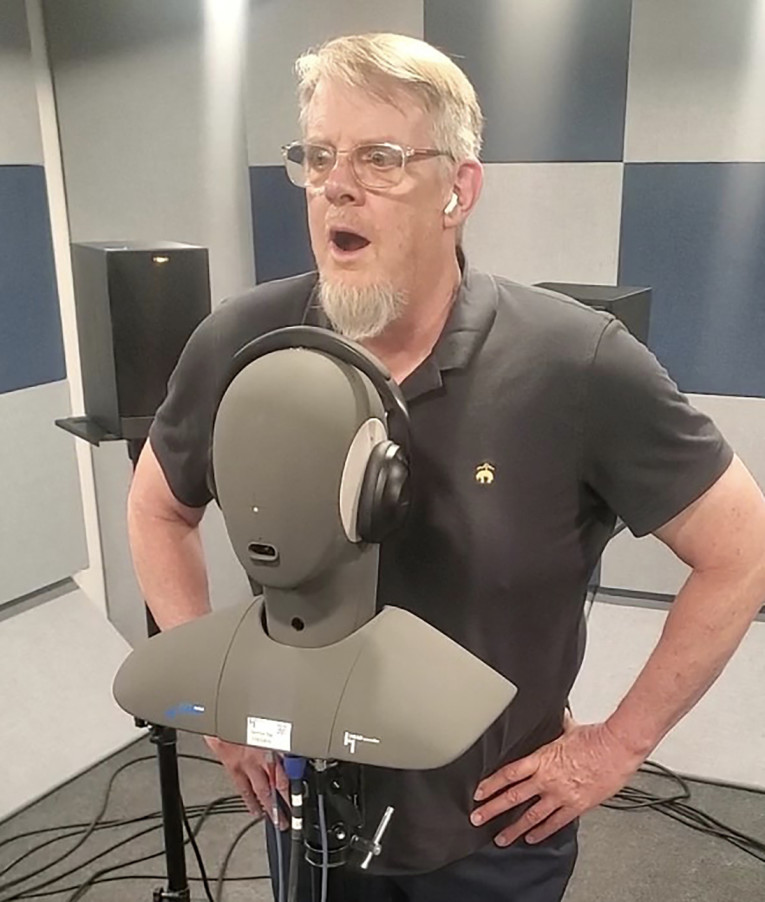
HEAD acoustics recorded five different sound environments using an eight-microphone array, with the intent that these signals be played back on an eight-speaker system in a controlled environment (i.e., a largely absorptive room, but not necessarily an anechoic chamber), with a HEAD acoustics HATS (Photo 1) positioned in the middle of the speaker array, and the headphones, earphones or earplugs placed on the HATS. By recording and analyzing the signals coming through the microphones in the HATS, using a HEAD acoustics LabCore hardware interface (Photo 2) and ACQUA analysis software (Photo 3), the company (and its customers) can gauge how effectively headphones and earphones deal with these sonic environments.
- Electric leaf blower (96.13dBA)
- Riding lawnmower (95.90dBA)
- Woodshop with miter and table saws (98.23dBA)
- Music venue, electronic dance music (91.45dBA)
- Airplane cabin (82.15 dBA)
To gauge how well headphones and earphones allow voices to pass through — so they can be heard when the products are worn, even in noisy environments — HEAD acoustics adds a mouth simulator positioned between two of the front test-signal speakers.
In this case, the mouth simulator is a tiny transducer that reproduces a human voice, with a dispersion pattern and acoustic response that mimic the characteristics of a human mouth. The mouth simulator was built into a HEAD acoustics HATS.
The signals arriving at the test fixture microphones — after being emitted from the eight-speaker array, then filtered through the headphones or earphones — are captured, then analyzed through HEAD acoustics ACQUA software.
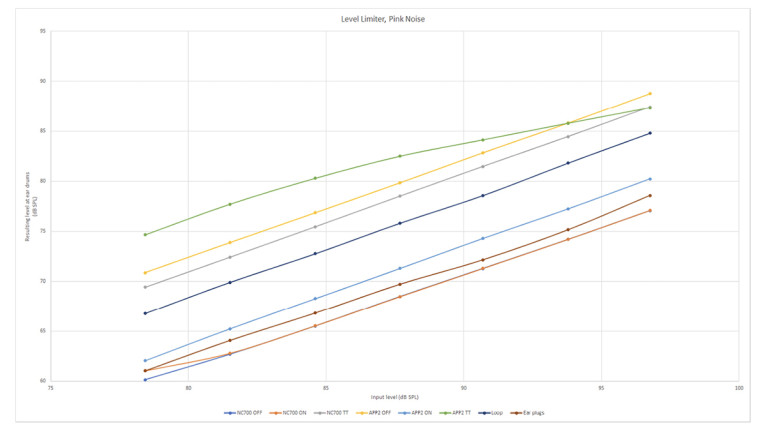
The entire process is automated, and typically takes about 2 ½ hours. That’s 90 minutes for signal acquisition — including 30 minutes for transparency mode, 30 minutes for noise cancelling on, and 30 minutes for noise cancelling off — followed by 60 minutes for processing. “You wouldn’t do this for every iteration of a product design, just for major evaluation steps,” Soendergaard said.
The processing computes the performance of the device under test (DUT) for several benchmarks.
Overall attenuation in decibels: a single, unweighted number to show how much the product attenuates the sound level at the eardrum, versus having no headset in place. This is the most basic measurement of headphone and earphone isolation, but because it doesn’t take psychoacoustics or the content of environmental noise into consideration, it doesn’t accurately reflect the level of attenuation that listeners will perceive.
Spectrum of attenuation: a plot to show the attenuation at different frequencies. This is the graph that most of the reviewers who measure headphone and earphone isolation (including me) usually present. If you have some knowledge of psychoacoustics and the spectrum of common types of environmental noise, you can use these charts to get a rough idea of how much isolation listeners will experience when they use the product, but the result won’t allow quick, easy comparison of the perceptual performance of two devices under test, or two iterations of DSP.
Attenuation vs. time: measurement shows device performance over time to track attack times. This is useful for testing adaptive noise cancelling functions, to see how quickly and effectively they respond to changing circumstances.
LAeq: A-weighted noise level over a certain span of time, a measure commonly used by regulatory agencies (such as US Occupational Safety and Health Administration, or OSHA) to gauge noise exposure in workplaces, concerts, and more.
Loudness level reduction: applies psychoacoustic principles to noise levels at the ears to gauge the subjective noise reduction experience the DUT will produce. It’s the same as overall attenuation in decibels but weighted on a subjective scale and expressed in phons. For example, a 20dB reduction in noise at 1kHz will be much more noticeable than the same reduction at 40Hz or 18kHz, because the ear is less sensitive at those frequencies.
Speech Intelligibility Index (SII): analyzes the noise arriving at the eardrum to estimate how difficult it would be to understand voices in a specific environment while using the DUT. The result in this test is the estimated percentage of speech that will be intelligible—100 being perfect intelligibility, 0 being a complete inability to understand speech. SII is especially appropriate for measuring the efficacy of the transparency (or hear-through) modes found in many noise-cancelling headphones and earphones, which are intended to allow the wearer to participate in a conversation without removing their headphones. However, SII wasn’t designed to measure speech intelligibility in a noisy environment.
Listening effort: similar to SII, this test (which HEAD acoustics developed, and is now standardized as ETSI TS103 558) analyzes the speech signal arriving at the eardrum to estimate how difficult it would be to understand speech in specific situations while using the DUT. Like SII, this test is especially valuable in evaluating the efficacy of transparency modes. But it’s specifically designed for measuring speech intelligibility in a noisy environment. A rating of 5 indicates no effort, similar to conversing with someone at a range of 1 meter in a quiet environment, while a rating of 1 indicates a total inability to comprehend speech in a given situation.
The Results
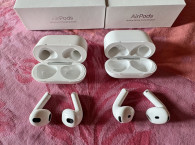
During my visit, we measured four products, a process that consumed the better part of a day. The products were the Bose Noise Cancelling Headphones 700 (which include noise cancelling and transparency modes); Apple AirPods Pro 2 (which include both modes and a hearing protection function); the Loop Experience earplugs; and a generic set of foam earplugs.
To get an impression of what was going on in the tests, and what the program material sounded like, I entered the sealed test chamber wearing the Apple AirPods Pro 2 earphones (Photo 4) set to the transparency mode, which would, in theory, limit the sound reaching my ears to 85dB SPL, even though some of the test material reached levels as high as 98dB SPL. Although the loud volumes weren’t pleasant, I was delighted to hear, when I removed the earphones, how natural the simulations sounded from the eight-speaker array when I was standing directly behind the HATS.
Soendergaard later provided me with a document showing the results of all the tests we’d done. The results included a matrix chart of single-number ratings for each DUT in specific conditions, and charts Soendergaard put together comparing the performance of the devices at different audio frequencies, time windows, noise levels, etc.
Just a glance at the matrix chart made it easy to see the differences in performance among these products in the various test settings. For example, in the overall attenuation test, the foam earplugs easily beat the Bose headphones, Apple earphones, and Loop earplugs in the leaf blower and workshop simulations. In the leaf blower test, for instance, they reduced outside noise by 41.57dB, while the other products achieved at best a 32.72dB reduction (for the Bose headphones).
Yet in tests where the environmental noise had more low-frequency content (e.g., airplane cabin noise and a music venue), the noise-cancelling-equipped Bose and Apple products did far better — because passive devices such as the foam plugs generally do a poor job of blocking low frequencies. The Apple AirPods Pro 2 performed best on both tests, achieving a noise reduction of about 25dB, while the foam plugs reduced the noise by only about 11dB. Having tested many earplugs and noise-cancelling headphones, these results didn’t surprise me.
What was more interesting to me, though, was the listening effort tests, particularly in the case of the Apple and Bose products. In this case, the listening effort in the presence of noise with no headphone or earphone installed on the HATS was rated at 2.5 on a scale of 1 to 5 — 1 representing total inability to comprehend speech, and 5 effectively representing no listening effort. In noise cancelling mode, the AirPods Pro 2 did not lessen listening effort, but neither did they make it worse: the result was still 2.5. However, in transparency mode, which is intended to reduce listening effort by allowing the voice to “leak through” the earphones, the result was 2.3 — slightly worse than achieved with noise cancelling, and more importantly, worse even than with the earphones removed. The results with the Bose NC700 were 2.1 with noise cancelling on, 2.4 in transparency mode, so with the Bose product, the transparency mode does seem to work as intended, although the result in transparency mode still isn’t as good as the result with no headphones at all.
These results show how valuable this type of testing is. Transparency modes are intended to make speech at least as intelligible as it would be with no headphones or earphones on. Given the amount of DSP in noise-cancelling headphones and earphones, it seems that transparency modes might even be able to enhance speech relative to the results with an unoccluded ear canal. If speech intelligibility in transparency mode is worse than it would be when no headphones or earphones are used, it’s likely that consumers will take off the products while they’re conversing with others, thus negating the benefit of a transparency mode.
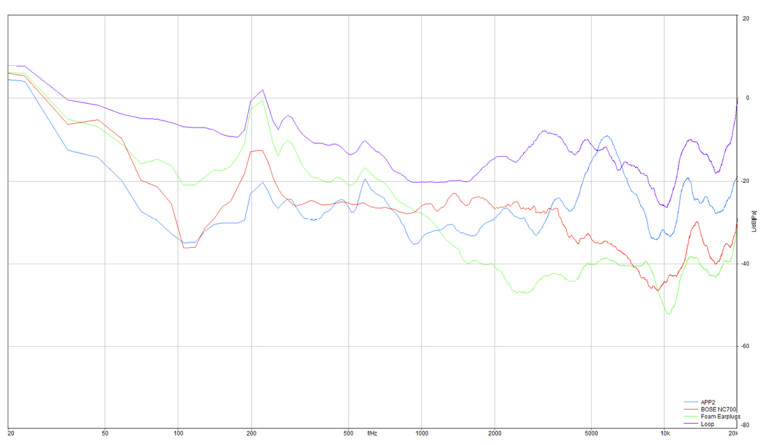
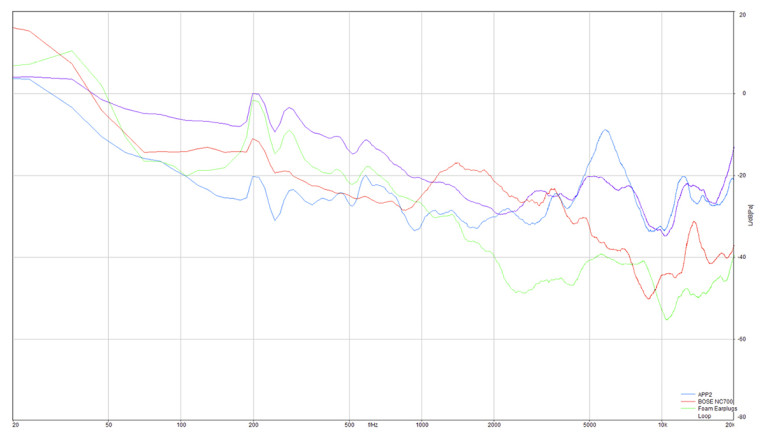
The charts allowed more analysis that shows the “why” that explains the numerical results. In the chart showing the noise reduction in the presence of simulated airplane cabin noise (Figure 1), for instance, we can see that the noise-cancelling products — the Apple AirPods Pro 2 and the Bose NC700 — provide excellent noise cancelling at low frequencies (where the rumbling drone of jet engine noise occurs). The foam earplugs do the best job of blocking high-frequency sounds (e.g., the hiss of airplane HVAC systems), but the Bose NC700’s excellent passive isolation gets the headphones pretty close to the high-frequency isolation of the earplugs.
The next chart (Figure 2) shows the results of the same test with the simulated noise from an electric leaf blower. Here the noise is dominated by high frequencies, and the foam earplugs clearly work best, followed by the Bose NC700 headphones.
The growth of adaptive noise cancelling systems, which automatically adjust their function to suit different sonic environments, has proved particularly challenging for those of us doing headphone measurements, because we must guess what environmental characteristics the headphone designers anticipated, and guess again at how best to simulate them. Thus, I was especially curious about the HEAD acoustics system’s ability to do dynamic measurements — testing a headphone’s isolation in changing conditions.
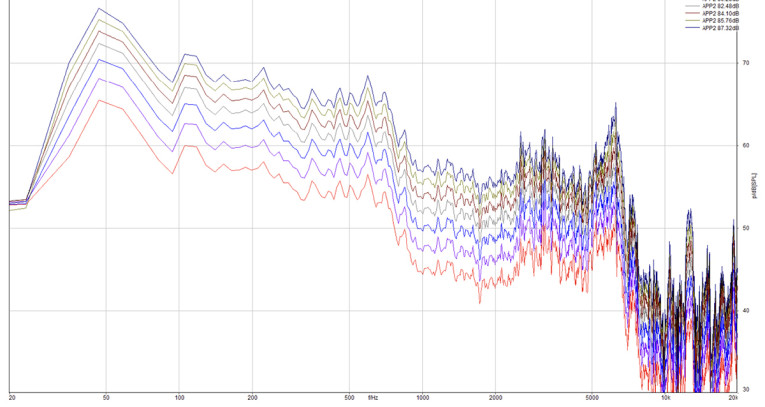
You can see some of the results in the third chart (Figure 3), which shows the measured level of the DUTs at the eardrum (or measurement microphone) in various levels of simulated live-concert sound. Except for the Apple AirPods Pro 2, all the devices respond in a linear fashion—the level at the eardrum increases directly with the level of the outside noise. With the AirPods Pro 2, set for transparency mode, there’s a decreasing rise of level at the eardrum as the external noise rises above about 85dB SPL. Apple has stated that the transparency mode limits the level at the eardrum to 85dB SPL; this test suggests that the transparency mode is working in a manner similar to what Apple has described, although the level did rise to about 87.5dB once the external sound level rose to 97dB. Interestingly, the AirPods Pro 2 reduced the level at the eardrum much more in noise cancelling mode, but the reduction is linear and does not change as the external sound level increases.
The final chart (Figure 4) extends this dynamic measurement concept by examining the spectrum of the AirPods Pro 2’s noise cancelling and reduction in different levels of external sound. As you can see, the isolation provided by the earphones remains consistent at all frequencies no matter how loud the external sound gets. This suggests that the adaptive function of the AirPods Pro 2’s adaptive noise cancelling adjusts only the level of the noise cancelling, not the frequency profile. (Although who knows what new functions will arrive in Apple’s next update?)
Conclusion
Although we spent nearly an entire day doing measurements, I feel like we just scratched the surface of what the HEAD acoustics measurement system can do. Of course, I’m not sure what kinds of functions headphone manufacturers will add to their products in the coming years, or how their designers will employ DSP to add new adaptive functions to these products, but I’m pretty confident that this system, and the measurement standards it’s based on, will be a big help in creating and optimizing new smart and adaptive functions in headphones, earphones, hearing aids, and hearing protectors. aX
HEAD acoustics MDAQS - A More Comprehensive Concept for Audio Measurement
In my audio product consulting work, many clients have asked me to create a testing protocol that would give them clear, straightforward sound quality ratings of their products — ratings that would tell them how they stack up against the competition, whether an engineering change produced a notable improvement, and whether a cost-reducing alteration had a perceptible effect on performance.
Although I was able to steer them toward some useful measurements, I always recommended they assemble listening panels that could provide a more comprehensive assessment of a product’s sound quality — especially in the case of low-cost active products, which often employ dynamic processing and frequency response shaping to wring every last bit of performance out of their tiny drivers and inexpensive monolithic amplifiers, and thus can’t be fully evaluated through conventional frequency response measurements.
"Frequency response measurements are a little bit like zero to 60 times for a vehicle," HEAD acoustics’ Jacob Soendergaard told me. "They’ll tell you something about the performance but will not provide a holistic perspective on the quality of the vehicle."
However, assembling listening panels is time-consuming, and finding people who want to sit through frequent, extensive, and tedious testing sessions is difficult. None of my clients ended up taking my advice, preferring instead to trust a limited series of measurements plus my opinions and perhaps the opinions of an in-house expert or two. Sometimes this method worked, sometimes it didn’t, but it always took a lot of time and produced imprecise results.
To make sound quality assessments faster, more precise and more liable, HEAD acoustics created the Multi-Dimensional Audio Quality Score (MDAQS). It’s an effort to provide a technically exhaustive yet easy-to-grasp assessment of the quality of practically any audio playback system, be it a wireless speaker, a set of headphones or even a car audio system.
MDAQS is an optional feature in HEAD acoustics ACQUA audio analyzer software, activated through the purchase of the ACOPT 36 extension. Surprisingly — but conveniently — it uses the same measurement hardware and software for all applications, based around a HEAD acoustics head-and-torso simulator (HATS). The advantage of using the HATS is that it provides binaural results that can be used to gauge stereo immersion, something not possible with a standard measurement microphone.
The basis of MDAQS is a series of tests HEAD acoustics conducted with more than 200 participants, who performed an extensive series of blind A/B preference comparisons between audio signals that had been processed in different ways, using a quality scale of 1 to 5. The tests revealed that characterizing timbre, distortion, and immersiveness could provide a simple, comprehensive, and accurate assessment of an audio system’s
subjective quality.
HEAD acoustics’ engineers then developed a set of measurements that could evaluate DUTs on the basis of these three parameters. The measurements employ a combination of music clips and swept tones, and they’re part of an automated routine that runs on the ACQUA system.
For every product tested, the end result is a series of four mean opinion score (MOS) ratings for a product: MOST (for timbre), MOSD (for distortion), MOSI (for immersion), and MOSO (for overall). All these scores are expressed as a single number extended to one decimal point, with 1.0 being bad and 5.0 being excellent. By looking at these four numbers — rather than a chart full of numbers — engineers can easily compare different iterations of a product, compare past products to new designs, benchmark their products against competitors, and figure out which of a products’ different parameters they need to adjust to get better results. Although I haven’t used MDAQS, and thus can’t confirm its efficacy and accuracy, it does seem to be the sort of “measurement holy grail” that many audio manufacturers have been seeking. aX
This article was originally published in audioXpress, December 2023