The measurement is CTA-2010 (formerly CEA-2010 — the title was changed when the Consumer Electronics Association changed its name to the Consumer Technology Association). Rather than measuring frequency response at a low sound pressure level (the most common method of measuring subwoofers), CTA-2010 measures usable output at 1/3-octave intervals within the subwoofer’s operational range. It functions as a dead-lift does in weight lifting: It’s a pure test of strength on which there’s no way to cheat.
I’ll describe the technique shortly, but first, I’d like to share an anecdote that shows the value of this measurement. In 1998, I conducted a blind subwoofer test for Home Theater magazine. The winner was a big subwoofer with a 15” driver, which the panelists praised for its deep-bass power. But when I measured the subwoofers, by summing near-field sweeps of the various radiating elements at low SPL, the subwoofer with the deepest measured response (-3dB at 18Hz) was a thin model with two unimpressive 8” drivers. Yet the listeners criticized this subwoofer for producing the weakest deep bass. Clearly it had been EQ’ed to deliver subsonic performance at low SPL; essentially cheating to get a better spec, but the device was not able to reproduce those frequencies at loud listening levels without substantial distortion and/or compression.
After much experimentation, I found a measurement that correlated with listener impressions: an SPL vs. distortion sweep at 20Hz. In this measurement, the 15” subwoofer could reproduce 20Hz at over 100dB, while the dual-8” model choked above about 85dB. This awakened me to the need for subwoofer output measurements, but fortunately, the work that evolved into CTA-2010 was already under way.
“CTA-2010 puts everyone on a level playing field,” according to Audioholics founder Gene DellaSala, one of the first review publications to incorporate CEA-2010 subwoofer measurements. “It’s a set of tests that everyone can reproduce if they have a proper ground plane environment. By making certain assumptions, you can take that data and translate it to how loud a sub will play in a room. This way, I know what subwoofers can hit reference levels in a 2000- or 3000-cubic-foot room.”
The History
In 1987, the paper “Subwoofer Performance for Accurate Reproduction of Music,” by Louis Fielder and Eric Benjamin (Journal of the Audio Engineering Society (JAES), Volume 36, Issue 6, page 443-456; June 1988), explored the audibility of distortion in subwoofers, and characterized the ability of loud fundamental tones to mask lower-order distortion harmonics.
In the late 1990s, Tom Nousaine, reviewing in Sound & Vision magazine, started publishing maximum output measurements of subwoofers by playing 6.5-cycle burst tones (originally developed by Don Keele and Siegfried Linkwitz) at 20Hz to 63Hz in 1/3-octave steps, raising the level to the point where total harmonic distortion (THD) reached 10%, then backing down on the level slightly and noting the RMS level of the fundamental tone. If the subwoofer couldn’t be turned up loud enough to reach the THD threshold, Nousaine would note the maximum level. The measurement was done using the ground plane technique, with the microphone 2 meters from the subwoofer. Unfortunately, Nousaine’s measurements were done indoors with no compensation for room acoustics, which made them impractical to replicate. However, the results made it easy for his readers to compare the performance of subwoofers.
CTA-2010 codifies that methodology, although it differs somewhat Nousaine’s methodology. Most notably, instead of a simple 10% THD threshold, CEA-2010 has different thresholds for the various distortion harmonics, to accommodate for the increasing audibility of the higher harmonics, as seen in Figure 1. The thresholds are:
2nd harmonic: -10dB
3rd harmonic: -15dB
4th and 5th harmonics: -20dB
6th, 7th, and 8th harmonics: -30dB
9th and higher harmonics: -40dB
3rd harmonic: -15dB
4th and 5th harmonics: -20dB
6th, 7th, and 8th harmonics: -30dB
9th and higher harmonics: -40dB
This is more forgiving than Nousaine’s method, in that when subwoofers exceed one of the distortion thresholds, they’re typically around 30% THD. Although this may seem too forgiving, Fielder and Benjamin’s paper points out that the human ear is much less sensitive to harmonic distortion at low frequencies, and the high-level fundamental tones tend to partially mask low-order distortion harmonics.
In the latest revision, CTA-2010-B-2014 (ANSI), the thresholds become less forgiving as the test frequencies increase, to account for increasing audibility of distortion at higher frequencies. However, to my knowledge, none of the manufacturers or reviewers doing CTA-2010-A-2012 (ANSI) has adopted this practice. CTA-2010 also differs from Nousaine’s method in that no matter what the measurement distance, it mandates scaling the result to a 1-meter equivalent. It also reports peak, rather than RMS, output.
The Setup
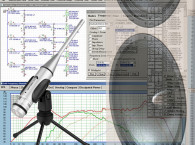
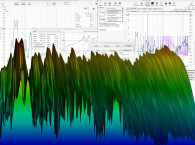
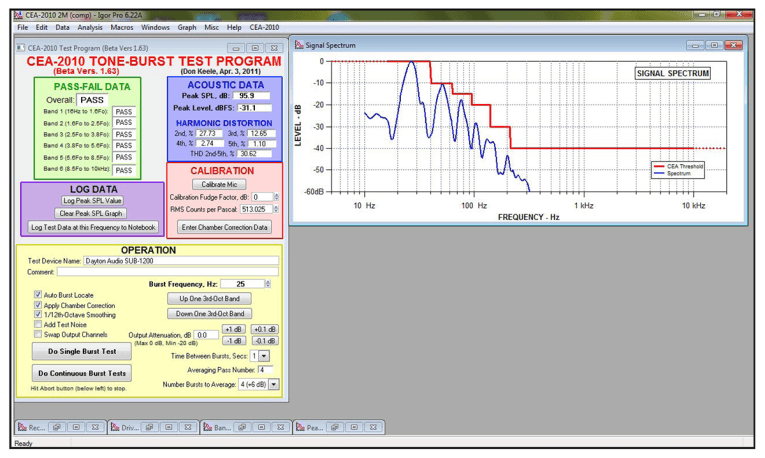
CTA-2010-A-2012 (ANSI) requires just a measurement microphone, a USB audio interface, and a laptop. There are no particular requirements for this hardware, although it’s a good idea to use a microphone capable of handling at least 130dB. While CTA-2010 can be done using an ordinary audio spectrum analyzer application and a source to play the required 6.5-cycle burst tones, it’s much easier to use an audio analyzer application that includes a CTA-2010 routine.
The CEA-2010 pioneers used a freeware app written by Don Keele, running on the Wave metrics IGOR Pro data analysis software. CTA-2010 measurement routines are available in the freeware Room EQ Wizard app, depicted in Figure 2, as well as the Audiomatica CLIO 12 and CLIO Pocket analyzers, and the Klippel KA3 analyzer. Having used all of these options except the Klippel, I see no reason not to use Room EQ Wizard as the software has all the needed features, it’s easy to use, and it’s free. (Editor’s Note: REW is indeed free, but given the outstanding work done by its author, John Mulcahy, and the utility of this software, a generous donation would be easy to justify.)

Most technicians doing CTA-2010 place the microphone 2 meters from the subwoofer, although the latest revision, CTA-2010-B-2014 (ANSI), mandates a 3-meter distance, in order to better incorporate all radiating elements into the measurement. The shorter the distance, the better the signal-to-noise ratio (SNR) of the measurement, so with smaller devices, for example, a soundbar subwoofer with a single 6.5” driver, it may be more appropriate to use a 1-meter distance.
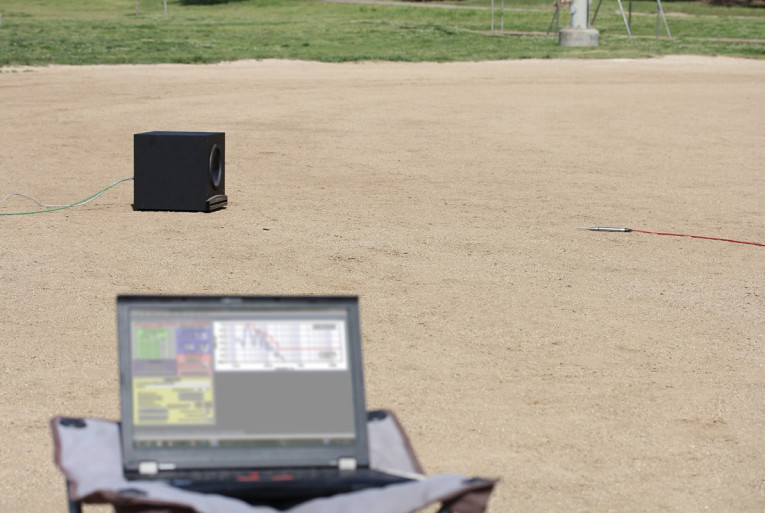
CTA-2010 is usually done outdoors. The minimum distance from the microphone and subwoofer to the nearest reflecting object is 0.75 times the wavelength of the minimum measurement frequency; for 20Hz, this is 11.8 meters or 38.7’. Assuming a 2-meter mic-to-subwoofer distance, this means a cleared circle 26 meters or 84’ in diameter. A good potential location would be a local ballpark. Because a softball diamond’s bases are 60’ apart, putting the subwoofer on second base will put it well away from any obstacles (Figure 3).
Of course, it may be difficult to find such a large area with access to AC power for the subwoofer. However, CTA-2010 allows the creation of a compensation curve for doing the measurement in smaller spaces. The curve is created by measuring a sealed reference subwoofer in a large, open space or in a calibrated anechoic chamber, measuring the same subwoofer in your test environment, and dividing the two measurements to create the correction curve. I use this method for doing CTA-2010 in my backyard.
The subwoofer should be positioned so that the microphone is equidistant from all radiating surfaces. For example, a subwoofer with a rear port would be turned 90 degrees to the microphone, and a subwoofer with a front port would be laid on its side. However, with some subwoofers’ transducer layouts, technicians must trust their best judgment in subwoofer placement.
Thanks to behind-the-scenes cooperation among the various people doing CTA-2010, results are typically consistent enough that manufacturers and reviewers tend to trust each other’s numbers — something that rarely happens with other speaker measurements. “It depends on the test environment and the test rig as to how consistent the data is going to be from person to person,” according to Ed Mullen, SVS director of technology and customer service. “For us, the gold standard is outdoors, at a 2-meter test distance, with the same test rig every time and no nearby obstructions. And we try to do it under consistent atmospheric conditions; you will see slightly lower results if you get thermal compression from the driver on a hot day. If others are within 1dB to 1.5dB of our results, we call that good.”
Reporting
Originally, CEA-2010 measurements were performed at 63Hz, 50Hz, 40Hz, 31.5Hz, 25Hz, and 20Hz, although some practitioners add measurements at lower and higher frequencies. The standard includes the presentation of average Ultra-Low Bass (20Hz to 31.5Hz) and Low Bass (40Hz to 63Hz) figures. These are especially useful for consumers who are shopping for subwoofers — because two numbers per subwoofer are much easier to get your head around than six. Originally, the averages were calculated using decibel figures, but later revisions mandate converting the logarithmic decibel figures to Pascals, averaging in Pascals, and then converting the average back to decibels. (The CTA-2010 manual on my website, brentbutterworth.com, has an Excel sheet that does the calculation for you.)
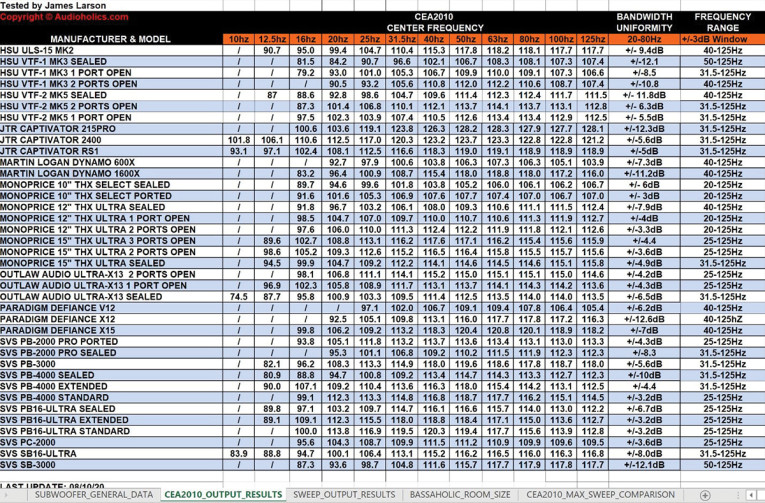
Some confusion occurred early on, as most manufacturers and reviewers who first adopted CEA-2010 continued Nousaine’s practice of reporting RMS output at 2 meters. “There was so much data out before CEA-2010, so it seemed best to stick with 2 meters RMS,” again quoting DellaSala. You’ll still see results reported both ways; fortunately, the 2-meter RMS figures can be converted to 1-meter peak figures simply by adding 9dB. Figure 4 illustrates a list of historic CEA-2010 subwoofer measurement data on a number of commercial hi-fi subwoofers accumulated by Audioholics online publication.
The Results
CTA-2010 seems to have had an impact in subwoofer design. Many manufacturers that use it, such as Hsu Research, Power Sound Audio, and SVS, have over the last decade consistently achieved improvements in output, particularly below 40Hz.
“The value of it is that it tells us how loud a sub can play before it hits its limits,” Mullen said. “Can a subwoofer play loud from 40 to 80Hz? Sure, that’s not terribly difficult to achieve. Can it play loud from 18 to 36Hz? Often, no, that’s where subs struggle. But the more consistent you can get with those two octaves, the better the sound will be, and the sub can deliver that ‘thwack’ that a lot of soundtracks call for.”
However, not all manufacturers consider CTA-2010 useful. “Some of them say the tone bursts don’t represent true program material, and that the distortion thresholds are unrealistic. But I think it might be too forgiving,” according to DellaSala.
Personally, I’ve found that some manufacturers don’t like CTA-2010 because it easily reveals artifacts like port noise or mechanical banging or clicking sounds from passive radiators that would rarely be experienced with music and movies.
But while skepticism of CTA-2010 remains common, I feel that any engineer who witnesses a measurement session will instantly see its utility. About five years ago, a manufacturer called me after reading my review of his subwoofer, asking, “What are these measurements? I’ve never heard of them.” He lives near me, so I invited him to bring one of his subwoofers so I could demonstrate. The moment he saw the burst tones and the distortion harmonics appear on the spectrum analyzer, he exclaimed, “Oh, this is fantastic!” The model he brought was a prototype, and my output measurements allowed him to fine-tune the design for the maximum performance his driver and amp could achieve. The subwoofer garnered numerous rave reviews and at least four “best of” rankings in major audio publications.
So CTA-2010 is a nearly ideal audio measurement: It’s inexpensive and easy, it’s consistent enough that different technicians with different equipment can get similar results, and it correlates well with listener perceptions. Performing CTA-2010 is easily accessible to any engineering staff at any company, so I encourage every company that sells subwoofers to give it a try. VC
This article was originally published in Voice Coil, June 2021.