 Loudspeaker defects caused by manufacturing, aging, overload, or climate impact generate a special kind of irregular distortion commonly known as rub & buzz, which is highly audible and intolerable for the human ear.
Contrary to regular loudspeaker distortions defined in the design process, the irregular distortions are hardly predictable and are generated by an independent process triggered by the input signal. Traditional distortion measurements such as THD fail in the reliable detection of those defects.
This article discusses the most important defect classes, new measurement techniques, audibility, and the impact on perceived sound quality.
A major part of the linear and nonlinear signal distortions generated by loudspeaker systems is already determined during the design process, as discussed in our previous article (1).
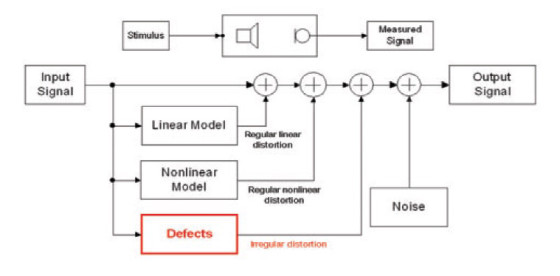
in a loudspeaker system (model).
Some of the defects, such as a short circuit of the voice coil or a deviation in the moving mass, may be detected by checking variation of the linear and nonlinear parameters using permissible limit values. Other defects commonly called rub and buzz generate a different kind of signal distortion which has a much higher impact on the perceived sound quality but cannot be detected by conventional measurement techniques. Those distortions are caused by independent sound generation processes being mechanically or acoustically coupled to moving parts of the loudspeaker and triggered by the input signal. In many cases those processes are difficult to model.
The properties of stimulus signal (level, spectrum) and other measurement condition (orientation of the driver) have a strong influence on the excitation of those defects, which are usually not related to size, weight, and cost of the product and vary with time. Therefore, defects which are not audible during end-of-line testing may be detected in the final application (mounted in the car).
The human ear is very sensitive to those irregular distortions, especially in a quiet environment. Therefore, trained human operators have been used for subjective evaluation of each unit during end-of-line testing. Shorter cycle times and the new requirements of 100% automatic testing require new measurement techniques to detect those defects reliably.
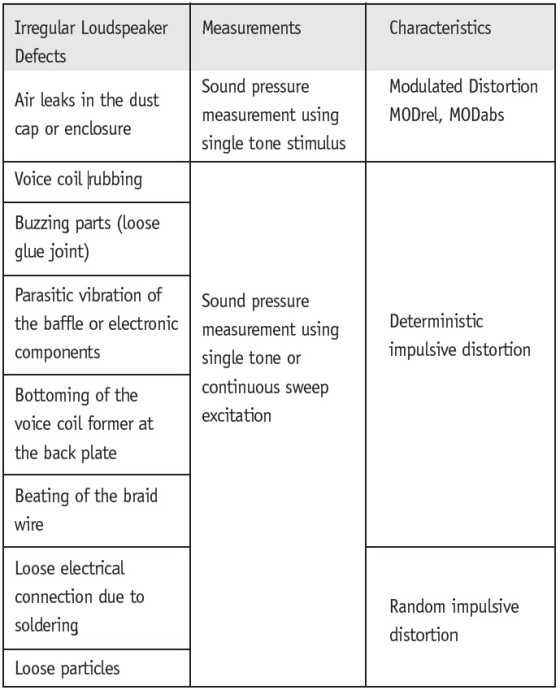
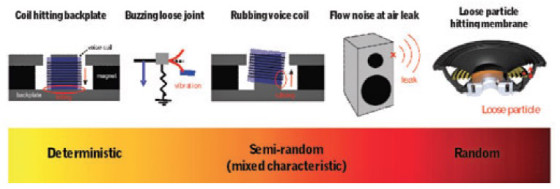
Table 1 gives a short overview about typical loudspeaker defects and optimal measurement techniques. Most loudspeaker defects behave as an independent oscillator producing a new mode of vibration which is powered, triggered, or synchronized by the stimulus(3). For example, a faulty glue joint between the surround and the membrane is such a nonlinear mass-spring system generating weakly damped vibration (buzzing) above a critical amplitude of the stimulus. The beating of the braid wire on the loudspeaker diaphragm is a similar defect generating impulses at a particular position of the voice coil. The energy of the irregular distortion is usually very small and does not grow significantly if the level of the stimulus is further increased.
Air leaks in dust caps or in sealed enclosures emit a small airflow driven by the AC sound pressure inside the box, which generates air turbulences and random noise(4). Dust and other loose particles within the loudspeaker system are even less predictable and may be accelerated by the cone displacement and hit the diaphragm at unpredictable times.
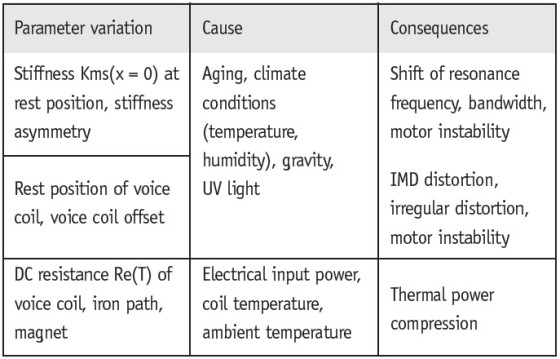
The major reasons for defects are problems in the manufacturing process such as poor quality of supplied parts, process drifts, and insufficient process control (Table 2). Hard limiting of the voice coil former at the back plate, for example, may be initiated by a larger peak displacement caused by a faulty spider having a stiffness value below specification.
Voice coil rubbing(2) may be initiated by a rocking mode corresponding with an asymmetrical mass distribution caused by a faulty glue dispenser, originally. Defects are also caused by systematic errors in loudspeaker design which impair the robustness of the product and make a malfunction at a later time more likely. Typical examples are insufficient clearance of the voice coil in the magnetic gap, wrong position of the braid wire, or loudspeaker nonlinearities.
Asymmetries in the nonlinear curve shape of force factor Bl(x) and stiffness Kms(x) generate a dynamic DC offset of the voice coil causing hard limiting of the surround or bottoming of the voice coil former at high excursions.
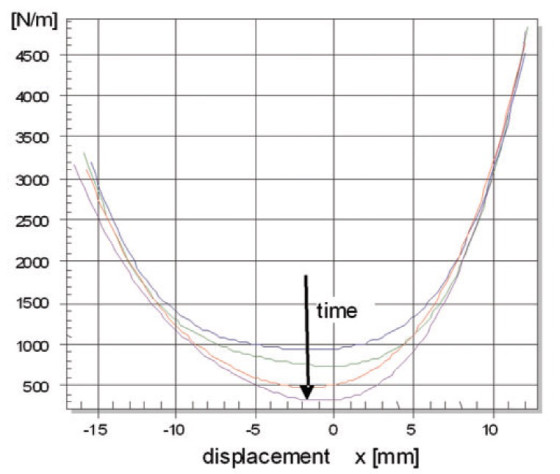
to the aging of the loudspeaker system. Above all, the suspension parts (spider, surround) are subject to aging, and the stiffness at the rest position decreases systematically with time (Fig. 2).
Eventually rocking modes, DC displacement, and motor instabilities cause consecutive faults such as voice coil rubbing and hard bottoming. Excessive use and overload increases fatigue in the material and accelerates this process.
Furthermore, the suspension properties depend on temperature and humidity. A critical status of the loudspeaker can be detected by monitoring the linear and nonlinear loudspeaker parameters.
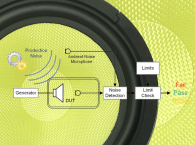
To detect loudspeaker defects already in the initial phase, it is important to monitor state variables of the loudspeaker which provide unique symptoms of the defect and make the measurement technique as sensitive as possible. Most defects are originated in the mechanical domain but cause acoustical emissions, which must be detected by a microphone. Besides a loose connection, there is no other loudspeaker defect producing significant symptoms in the electrical domain. However, monitoring of voltage and current at the loudspeaker terminals indicates a voice coil offset, aging of the suspension, and other initial causes. The wide variety of loudspeaker defects may be classified into three groups (Fig. 3).
at single tone excitation.
Deterministic Defects
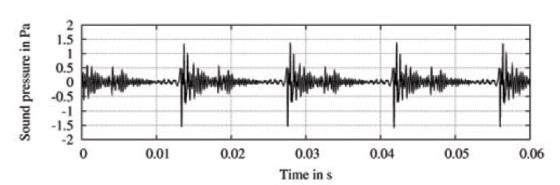
Defect mechanisms that are strictly coupled to the stimulus are generally very reproducible and result in deterministic patterns of the waveform. A good example is voice coil bottoming or periodic beating of connection wires. Figure 4 shows the isolated distortion for exciting the loudspeaker with a single tone at low frequencies. The signal is very impulsive and strictly periodic corresponding to the period length of the stimulus signal.
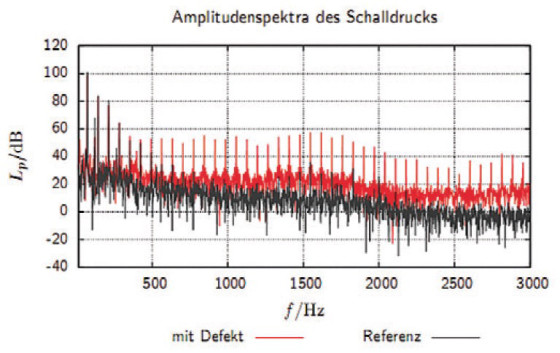
The corresponding amplitude spectrum in Fig. 5 shows a good and a defective unit. The harmonic structure in the defective spectrum affirms the strict periodicity in the time domain. In contrast to regular loudspeaker distortion, the higher-order harmonics (>10) have a much higher amplitude in the defective unit. Those harmonic components are also almost in-phase (not shown in Fig. 5), causing the characteristic impulses in Fig. 4.
Semi-Random Defects (Mixed Characteristic)
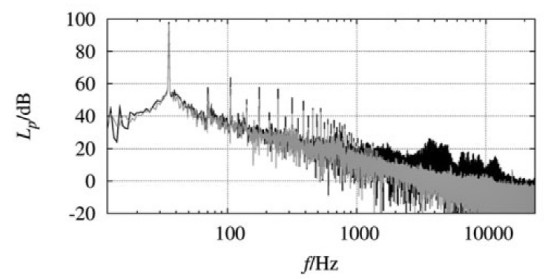
Other defects such as voice coil rubbing and air leaks produce waveforms, which are not deterministic and change for a periodical stimulus. Figure 6 shows the (black) spectrum of a closed-box loudspeaker system having a small air leak compared with the (gray) spectrum after sealing the enclosure carefully. I used a low-frequency tone at 35Hz as stimulus to generate sound pressure fluctuation in the enclosure and excite the leak noise monitored by a microphone.
The fundamental component and harmonic distortion components are clearly visible as spikes in both spectra. The air noise appears as a broad band and dense spectrum at frequencies above 1kHz almost 80dB below the fundamental.
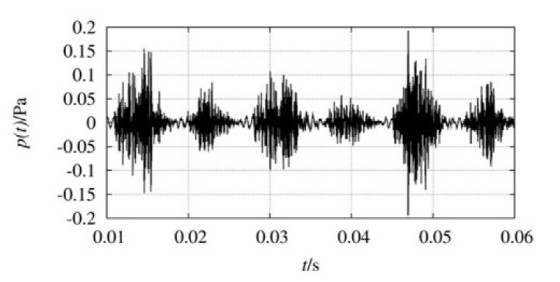
Transferring the high-pass filtered signal back to time domain reveals a random noise which has a characteristic envelope corresponding to the stimulus length (Fig. 7).
Random Defects
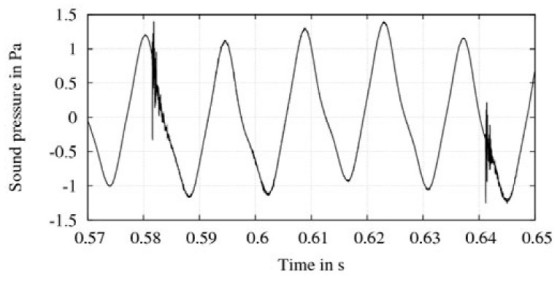
The last independent group of defects causes symptoms that are completely random, and not synchronized with the stimulus as shown in Fig. 8. The stimulus provides only the energy to accelerate the loose particle or to change the electrical resistance of a loose electrical contact or soldering problem in a non-predictable way.
The properties of the stimulus affect the sensitivity of the measurement in two ways: First, the defects require sufficient energy to provide significant symptoms. A single tone stimulus, a stepped sine wave, pink noise, or music and speech cannot ensure sufficient excitation of narrowband resonators with a high Q-factor.
A continuous sinusoidal chirp signal with an optimal sweep speed profile is the most critical stimulus because it excites all frequencies in the shortest measurement time while providing high resolution at low frequencies where most defects occur. Air leaks may be detected by using a single tone as stimulus having a fixed frequency close to the fundamental driver resonance or port resonance of a vented-box system producing sufficient pressure fluctuation inside the box.
Second, the symptoms of the defects are broadband phenomena having a spectral power density that is much smaller than the fundamental component and other regular distortion. Therefore, it is a further objective of signal analysis to separate irregular distortion from the other signal components. This can be accomplished by using a high-pass or tracking filter if the stimulus has a limited bandwidth or a sparse spectrum as a single-tone, sinusoidal sweep, or multitone complex. This approach fails in more complex stimuli having a dense spectrum such as (pseudo)-random noise, music, or speech. The incoherence between input and output spectrum may be calculated for those stimuli but is unfortunately not sensitive for irregular distortion because the power spectra are dominated by the (regular) nonlinear distortion and measurement noise.
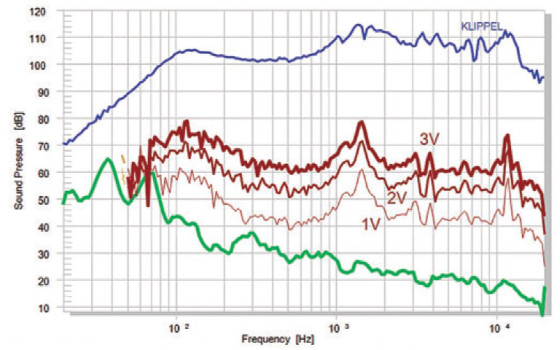
For the same reason, a multi-tone stimulus is also not very sensitive for measuring irregular distortion. Figure 9, for example, reveals no symptoms of a clearly audible defect occurring at 3V because the regular distortion generated by the accepted loudspeaker nonlinearities have 10 to 100 times more power and mask the coil rubbing completely.
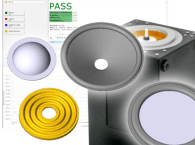
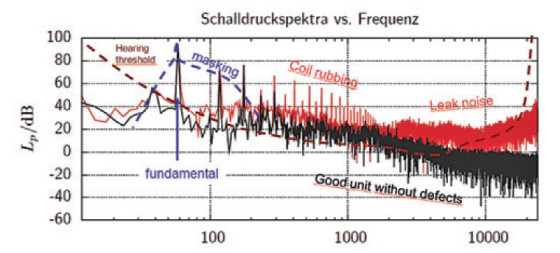
Using a single tone or continuous sweep as stimulus, the irregular distortion can be easily separated from the other signal components in the frequency domain. Figure 10 shows the spectra of an intact loudspeaker and a faulty speaker with a rubbing coil and a small air leak at the dust cap. The fundamental component and the low-order harmonics (n<10) reflect the regular distortion. The rubbing coil causes a significant difference in the higher-order harmonics (10 < n < 50) and the air leakage noise appears as a dense spectrum above 1kHz more than 70dB below the fundamental. Randomly occurring defects such as loose particles have even less energy that is spread over the whole spectrum and can hardly be distinguished from the noise floor. Applying reasonable pass/fail limits is difficult, especially in the presence of production noise.
The frequency domain analysis provides not only the amplitude information of the irregular distortion but also phase information, which determines the waveform of the irregular distortion in the time domain. As shown in Figs. 7 and 8, most of the irregular distortions have an impulsive fine structure resulting in a higher crest factor than the regular distortion. This crest factor corresponds with the phase relation of the higher-order harmonics and has high diagnostic value as discussed below.
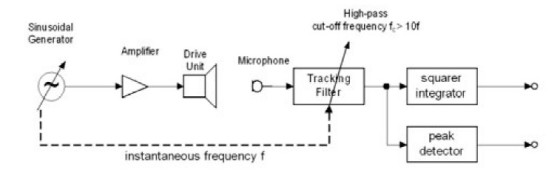
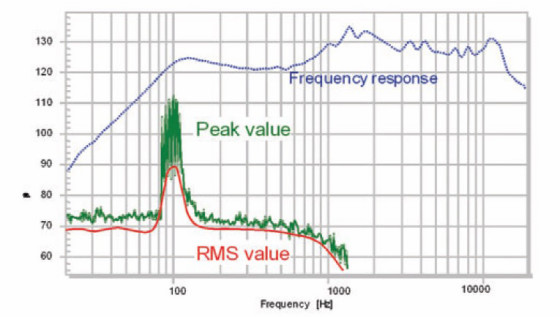
Because the interpretation of a complex spectrum is difficult, it is more useful to continue the analysis in time domain or to separate directly the irregular distortion in the original microphone signal using a high-pass or tracking filter which is synchronized with the instantaneous excitation frequency of the sinusoidal sweep (Fig. 11). The most important characteristic of the irregular distortion is the instantaneous peak value and the RMS value calculated within one period of the sinusoidal stimulus and may be plotted versus instantaneous excitation frequency (Fig. 12).
While the RMS-value corresponds with the power of the irregular distortion, the peak value is more sensitive for impulsive symptoms in the fine structure of the waveform.
For example, the defect in Fig. 12 generates at 100Hz a peak value that is more than 20dB higher than the RMSvalue.
The crest factor, which is the ratio between peak and RMS value, is also a very interesting characteristic for irregular distortion exploiting the phase information, which could not be interpreted in the frequency domain analysis.
For regular harmonic distortion and measurement noise, the crest factor is about 10dB but shows much higher values for any irregular distortion, which is more impulsive(2).
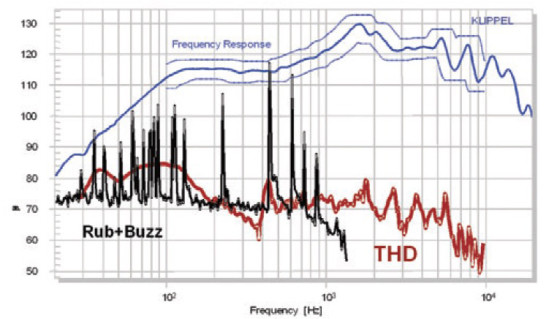
Figure 13 compares the peak value of the irregular distortion (rub & buzz) with total harmonic distortion (THD) measured by using conventional techniques. The small loose particle cannot be detected in the THD curve but generates distinct peaks of 30dB in the irregular distortion.
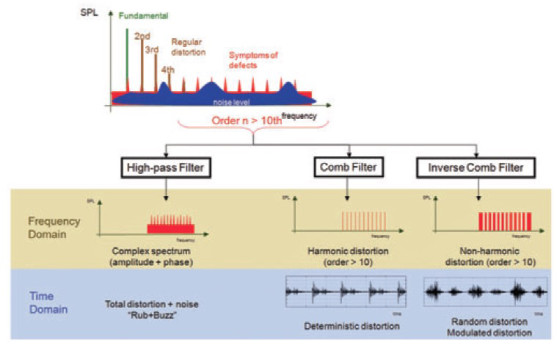
Exciting the loudspeaker with a periodic stimulus such as a sinusoidal tone, it is possible to separate the deterministic from the random components and to derive further characteristics that increase the sensitivity of the measurement (Figure 14). Using a comb filter that only transfers the higher-order harmonics of the irregular distortion (n > 10) gives the deterministic part of the irregular distortion. This is a sensitive characteristic for hard limiting of the surround, bottoming of the voice coil, wire beating, and other periodic mechanisms. An inverse comb filter which passes all high frequency components but blocks all harmonics separates the random distortion caused by loose particles and semi-random distortion caused by air leaks and coil rubbing.
Conventional averaging can be applied to the deterministic distortion producing identical patterns in each period of the stimulus. Averaging attenuates other stochastic components such as ambient and microphone noise and improves the signal to noise ratio by 3dB for doubling the averaging time.
Figure 15 shows the deterministic distortion averaged over 100 periods generated by a beating wire. The peak and RMS-value may also be derived from the averaged signal.
The high crest factor of 21.4dB indicates a high significant impulsiveness, which is typical for this defect.
Modulated Distortion
Air leaks and other semi-random defects produce a stochastic noise-like signal that is modulated in a deterministic way.
The envelope directly corresponds with the fundamental frequency supplied via the stimulus to the loudspeaker and low-order harmonics. Conventional averaging of the original time signal would reduce the stochastic symptoms in the same way as ambient noise and other uncorrelated signals are attenuated. Consequently, averaging should only be applied to the deterministic information which is the envelope of the noise signal. This can be accomplished by using a new asynchronous demodulation technique(4).
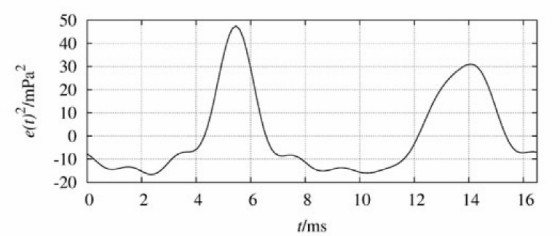
Figure 16 shows the averaged modulation envelope of irregular distortion emitted by a box leak. The turbulent noise is emitted twice per period when the sound pressure inside the box has a positive or negative maximum. Reading the maximal peak value of the averaged squared envelope gives the absolute and relative Modulation Level, MODabs and MODrel, respectively. Values of MODrel close to 0dB indicate no significant modulation, but higher values above 5dB reveal significant modulations caused by air leaks, voice coil rubbing, or other semi-random defects.
The last section of this article continues the discussion of the perceptual assessment of loudspeaker distortion as started in our previous article but focuses here on the audibility of the irregular distortion and the impact on perceived sound quality.
using a periodic stimulus.
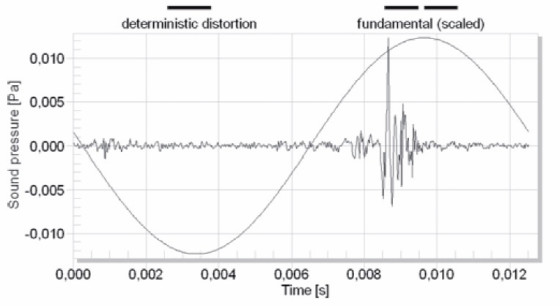
of the stimulus (not scaled).
The perception of the irregular distortion highly depends on the spectral complexity of the stimulus. A single tone or sinusoidal sweep is the most critical stimulus not only for an objective measurement system but also for the human ear.
For this reason, a human operator prefers a simple sine generator for testing loudspeakers at the assembly line. Other test signals such as two-tone signals, multi-tone complexes, and music and speech are less critical and less useful for detecting irregular loudspeaker defects in the shortest time possible and at high reliability.
The main reason for this is the spectral masking effect in the perceptional processing of the ear. For a single tone used as stimulus, the irregular distortion is far away from the fundamental component and is not masked by the excitation threshold generated by the stimulus. Filling the stimulus with further excitation components means each fundamental will also excite all critical bands close to the fundamentals and the resulting excitation level masks irregular distortion.
Masking by the Hearing Threshold
Irregular distortion has a low power spectral density which is close to the hearing threshold of the human ear. Some loudspeaker defects such as air leaks are inaudible if the loudspeaker is far away from the listening point but can easily be detected at a closer position. For this reason, a human tester can more reliably detect defects on small loudspeakers at a relatively small listening distance. An automatic measurement system using sensitive microphones and a test box for shielding ambient noise may outperform a human tester and can detect defects at an early phase.
The regular nonlinearities as defined by motor and suspension design as discussed in Part 1 also mask the irregular distortion.
This mechanism affects subjective testing on the assembly line. A trained operator can reliably detect a defect at medium excitation level but fails if the voltage of stimulus is increased.
The reason is that the regular distortion rises with excitation level but the irregular distortion stays at almost the same level. However, some defects are only activated if the voice coil displacement is high. This dilemma can only be solved with a measurement instrument which compensates actively for the regular distortion using an adaptive system learning the deterministic properties of good units (meta-hearing technology).
Sharpness
The term of sensory pleasantness combines different aspects to take into account the aesthetics and annoyance of auditory events. The influencing factors are loudness, tonality, sharpness, and roughness. Referring to irregular loudspeaker distortion, the last two mentioned factors must be examined in detail.
Irregular distortions are a broadband signal covering the complete audio band up to ultra-sonic frequencies. Those components increase the sharpness of the perceived sound, which is modeled by Zwicker(5) using a specific loudness model and a weighting function rising to higher frequencies, starting at 3kHz. This sensation of sharpness may be generated by many frequency components that are widely independent of level and the spectral fine structure, especially within one critical bandwidth. For a low-frequency stimulus the sharpness of the perceived sound is mostly determined by the irregular distortion generated by the speaker. Especially air leaks increase the sharpness of the perceived sound significantly and can easily be detected in subwoofers only reproducing a bass signal. High values of sharpness are perceived as unpleasant.
The detection of irregular distortion and the impact on perceived sound quality cannot be explained by considering the spectral properties only. The temporal fine structure of the irregular distortion, especially the periodic variation of the signal envelope, is highly relevant for human perception.
This is the case for most stimulus-coupled irregular distortions initiated by air leakage and other semi-random defects. The human auditory system perceives amplitude modulation of single tones and broadband noise between 20 and 300Hz as “roughness,” which is inversely proportional to auditory pleasantness, increasing the aggressiveness and noticeability. Especially in the relevant frequency range, defects are most likely to be excited.
Conclusion
Loudspeaker defects generate irregular distortions that are often impulsive, highly audible, and unpleasant to the human ear due to high perceptual roughness and sharpness.
Contrary to regular distortions which are directly related to cost, weight, and size of the loudspeaker, the irregular distortion is usually caused by parameter variation of the soft parts (spider and surround), insufficient process control, aging, and overload. The generation of irregular distortion is difficult to model, depends on particular properties of the stimulus, operation conditions of the driver (orientation), and become worse over time.
It is risky to ship faulty loudspeakers even if the symptoms are almost inaudible. Manufacturers use experienced operators for the subjective testing at the end-of-line which are more sensitive than an untrained ear to detect defects already in the initial state. A measurement instrument which exploits the particular irregular distortion symptoms can detect defects objectively in a shorter time, more reliably and with more sensitivity than a human ear. It also provides diagnostic clues about the physical cause of the defect and can cope with ambient production noise corrupting the measurement.
Irregular distortions that become audible in the final application are generally not acceptable for the user having a significant negative impact on the perceived sound quality. Rental companies for professional equipment are interested in anticipating this point to avoid a malfunction during a concert. Sensitive measurement instruments may indicate the first symptoms, and regular testing of the motor and suspension properties indicate fatigue and the progress of aging processes.
VC - article, originally published in Voice Coil, June 2011
References
1. Klippel, W.; Werner, R.: “Measurement and Perception of Regular Loudspeaker Distortion,” Voice Coil, May 2011, p. 5.
2. Klippel, W.; Seidel, U.: “Measurement of Impulsive Distortion, Rub and Buzz and other Disturbances,” 114th AES Convention Amsterdam, Mar. 2003.
3. Klippel, W.; Irrgang, S.; Seidel, U.: “Loudspeaker Testing at the Production Line,” 120th AES Convention Paris, May 2006.
4. Klippel, W.; Werner, R.: “Measurement of Turbulent Air Noise Distortion in Loudspeaker Systems,” 129th AES Convention San Francisco, November 2010.
5. Zwicker, E.; Fastl, H: Psychoacoustics – Facts and Models, Springer, Berlin, 1999, ISBN 3-540-65063-6.