 A major part of the signal distortion generated by loudspeaker systems is directly related to the geometry and properties of the material used in loudspeaker design and found in all good units passing the assembly line. Those regular distortions are the result of an optimization process giving the best compromise between perceived sound quality, maximal output, cost, weight, and size. This article discusses the physical causes of the regular distortions, their modeling by using lumped and distributed parameters, the objective assessment using modern measurement techniques, and the perception by the human ear.
Article originally published in Voice Coil, May 2011
The target of an audio reproduction system is to generate at the listening position an output signal pout(t), which is similar to the input signal pin(t) at the source point. The difference between the two time signals may be considered as a distortion signal pdist(t)=pout(t) - pin(t) generated somewhere in the audio chain. After introducing digital signal processing, transmission, and data storage, the weakest part is the electroacoustical conversion (loudspeaker) and in the interaction with an acoustical environment (room).
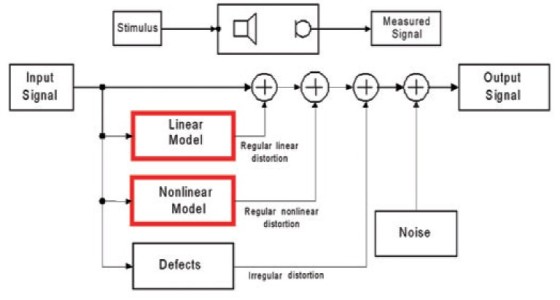
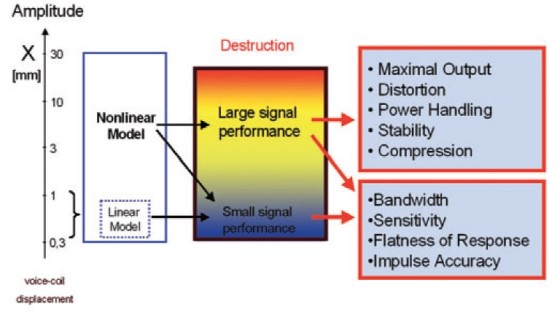
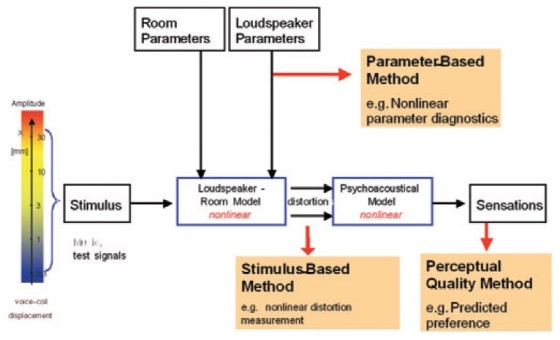
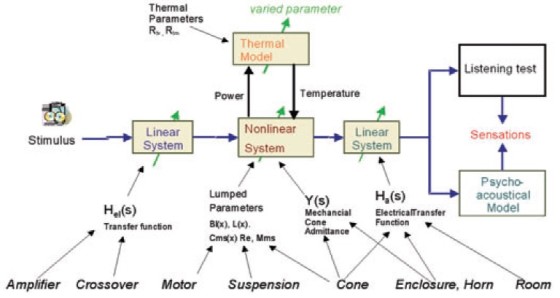
The generation of signal distortion can be modeled by a flowchart as shown in Fig. 1. It comprises a linear and a nonlinear model, a black box system describing further defects and faults in the system and an independent noise source. The linear and the nonlinear models describe the target performance of the loudspeaker, which should be materialized in the golden reference units at the end of loudspeaker development. The outputs of the linear and nonlinear models are regarded as regular distortions because they are accepted within the design process and are the result of an optimization process giving the best compromise with other constraints (weight, size, cost, and so on).
Irregular distortions are generated by defects caused by the manufacturing process, aging, and other external impacts (overload, climate) during the later life cycle of the product. A rubbing voice coil, buzzing parts, loose particles, and air leaks are typical loudspeaker defects which produce irregular distortions which are quite audible and not acceptable. A related paper discusses the physical causes and measurement techniques in greater detail.
This article focuses on the regular distortions generated by the linear and nonlinear models which are the theoretical basis of the loudspeaker design process. Linear modeling based on lumped parameter modeling (Thiele/ Small parameters) has a long history in loudspeaker design.
More complex models using distributed parameters have been introduced to explain the cone vibration and sound radiation at higher frequencies. The linear modeling fails in describing the large signal performance of the loudspeaker which is directly related to maximal output and cost, size, and weight of the loudspeaker. Therefore, modeling and direct measurement of loudspeaker nonlinearities is an important part of modern loudspeaker design.
in loudspeaker systems and identifying the physical causes.
Linear Distortion
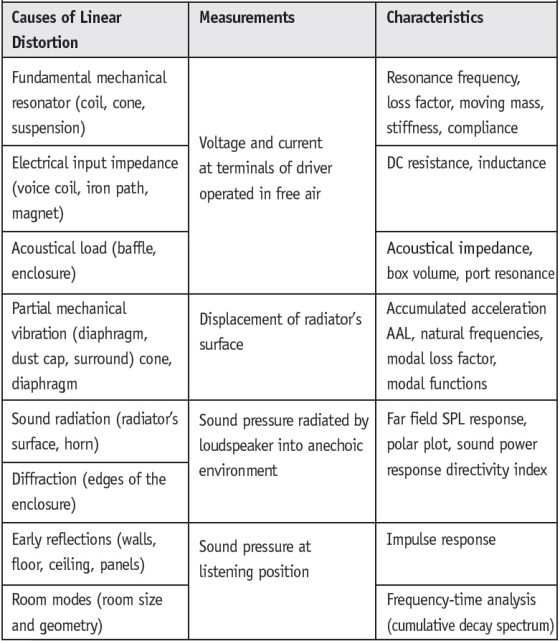
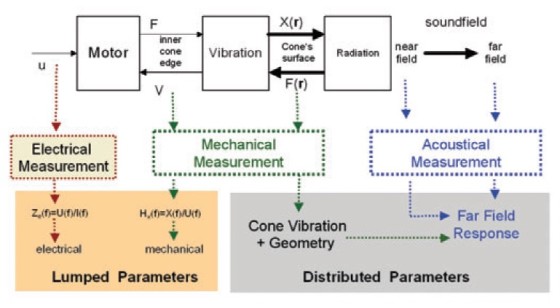
Table 1 gives an overview of dominant causes of linear distortion caused by transducer and system design and by the acoustical environment in the final application. The first causes are in the one-dimensional signal path close to the input of the transducer which can be modeled by a network comprising lumped elements. Electrical measurements of voltage and current at the terminals gives the electrical impedance which is the basis for identifying basic lumped parameters and other derived Thiele/Small parameters which describe the properties of electrodynamic transducer, mechanical resonator, and acoustical load.
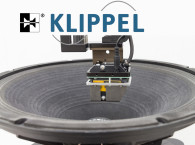
At higher frequencies the radiator (cone or diaphragm) does not vibrate as a rigid body anymore but breaks up into higher-order modes. Here, a more complex model using distributed parameters and multiple state variables such as the displacement X® on sufficient points r on the radiator’s surface is required. New mechanical measurements using laser scanning techniques provide the displacement and the geometry of the vibrating surface.
The generated sound pressure in the near field or in the far field at the listening position depends not only on the sound radiation but also on the diffraction at the edges of the enclosure, early reflections on room boundaries, and room modes. In micro-speakers, headphones, and horn compression drivers, the acoustical sound field may generate a force F® at any point of the vibrating surface which is not negligible and may be also detected in the electrical signals at the terminals.
and nonlinear model.
and distributed parameters.
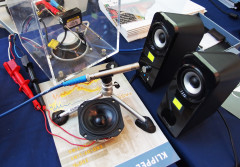
Traditional loudspeaker design and evaluation of transfer behavior was restricted to electrical and acoustical measurements as shown in Fig. 3. New cost-effective laser sensors based on the triangulation principle(1) provide the geometry of the radiating surface at high accuracy and the linear transfer functions between terminal voltage and displacement X® at sufficient points r on the surface. Figure 4 shows, for example, the result of such a scanning process collecting mechanical information at about 1000 measurement points. The mechanical scanning process requires no anechoic room and may be applied to the drive unit operated in a vacuum.
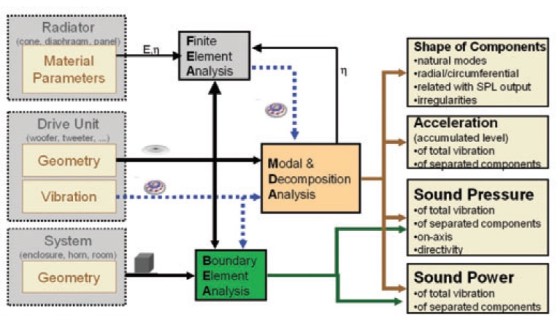
Numerical calculation based on the scanned data provides the sound pressure on-axis or at any point in the far field giving the polar pattern of the loudspeaker as illustrated in Fig. 5. A new Sound Pressure Related Decomposition Method(2) shows how each part of the cone contributes to the sound pressure output in a constructive or destructive way. This reveals acoustical cancellation effects, critical rocking modes, and undesired circumferential modes. A Modal Analysis applied to the mechanical data simplifies the mechanical analysis and provides the modal loss factor η and other material parameters which are important input parameters for a Finite Element Analysis to investigate the design choices in greater detail. A Boundary Element Analysis may also consider the particular shape of the enclosure, horn, or room boundaries to predict the sound field at high accuracy.
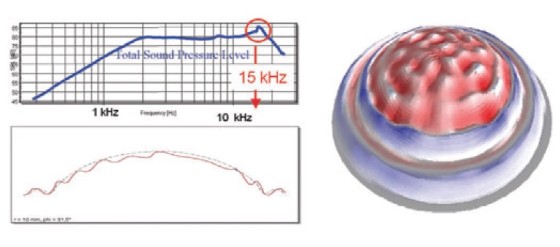
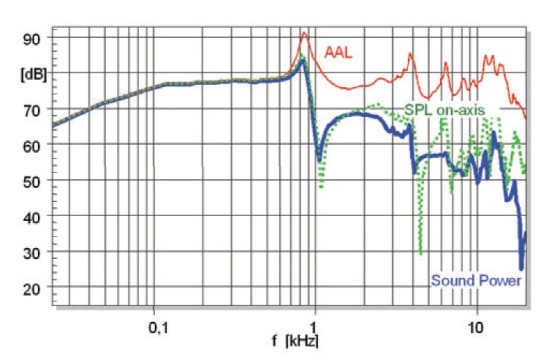
Three curves calculated from the mechanical scanning data give the most condensed but almost comprehensive description of a loudspeaker’s small signal performance: The on-axis sound pressure response predicted in 1m distance in the far field is depicted as a dotted line in Fig. 6. The thick line represents the sound power response of the loudspeaker, and the thin line on the top shows the accumulated acceleration level (AAL). The AAL corresponds to the total mechanical energy neglecting the phase information but normalized in such a way as to be comparable with the acoustical output. It may be interpreted as the maximal acoustical sound pressure level while neglecting any acoustical cancellation.
Therefore, the AAL and SPL curves are identical at low frequencies (in Fig. 6 up to 800Hz), where the loudspeaker cone vibrates in the rigid body mode and all points on the cone contribute to the sound pressure output constructively. However, at distinct frequencies such as 1.1, 4.4, and 7kHz, there are significant dips in the SPL output which are not found in the AAL. The difference between AAL and SPL curves describes the acoustical cancellation effect quantitatively. The AAL response comprises characteristic peaks which occur at the natural frequencies of the higher-order modes. The 3dB bandwidth of each “resonance peak” corresponds with the modal loss factor of the material used. At low frequencies the sound power response is most identical with both AAL and SPL responses because the loudspeaker dimensions are small compared to the wavelength and the radiator behaves as an omnidirectional source.
sound power response depicted as thick line.
Regular Nonlinear Distortion
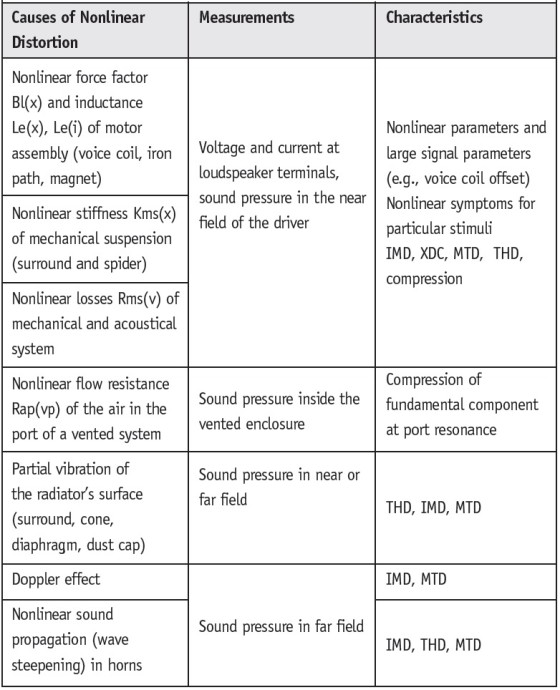
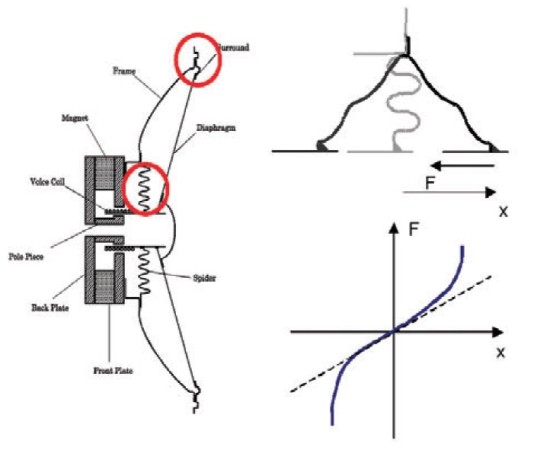
Table 2 gives an overview on the physical causes of regular nonlinear distortion affecting the loudspeaker’s large signal performance(3). The dominant nonlinearities are in the motor and suspension part of the electrodynamical transducer because the voice coil displacement is relatively large compared to the dimensions of the coil-gap configuration and size of the corrugation rolls in the suspension (spider, surround). In micro-speakers, headphones, and compression drivers, the air flow in the gap may generate a nonlinear dependency of the mechanical resistance Rms(v) on velocity v. In vented-box loudspeaker systems there is a similar mechanism causing a nonlinear flow resistance Rap(vp).
High local displacement at the surround and particular regions on the cone activate nonlinearities in the modal vibration. A typical nonlinearity related to the sound radiation is the Doppler Effect where the high excursion of the bass signal changes the position of the cone causing variation in the propagation time affecting high frequency components radiated from the radiator at the same time. In horn compression drivers the high sound pressure causes a gradual steeping of the waveform while the sound wave is traveling from the throat to the mouth of the horn.
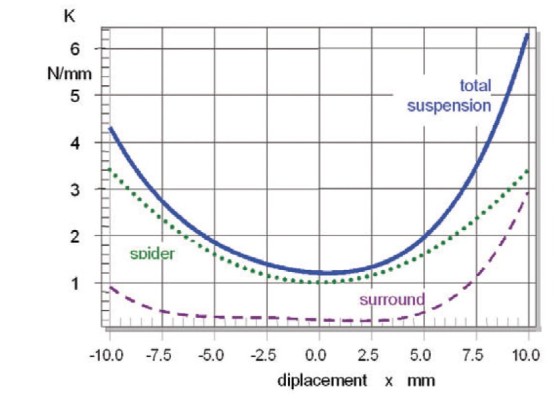
The effect of the dominant nonlinearities can be investigated by the lumped parameter model shown in Fig. 7. Contrary to a linear model some elements have not a constant parameter but depend via a nonlinear function on voice coil displacement x, velocity v, current i, sound pressure in box enclosure pbox, or other state variables.
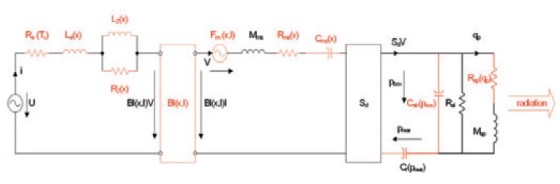
The solid curve in Fig. 8 also reveals an asymmetry in the stiffness characteristic which is caused by the asymmetrical shape of the surround which is more stiff and less compliant for positive than negative excursion. This asymmetry is an undesired property which causes not only 2nd- and higher-order distortion but also generates a DC displacement moving the coil to the softer side of the suspension.
Nonlinearities may also cause an instability of the motor at frequencies above resonance. The large signal performance is predictable and there is close relationship via the nonlinear parameters to the design.
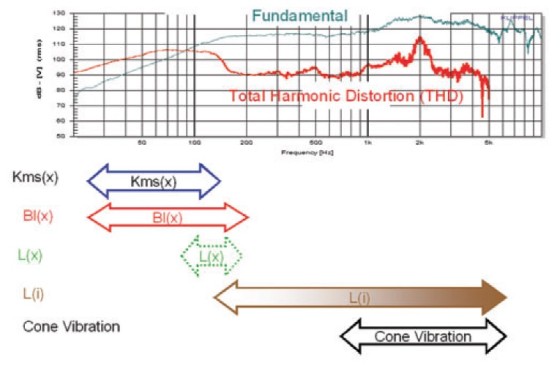
The generation of nonlinear distortion and other symptoms depends on the properties of the stimulus. A single tone generates new spectral components at multiples of the fundamental frequency which can easily be measured by conventional harmonic distortion measurements. Figure 9 shows the response of the total harmonic distortion (THD) and relationship to the physical causes. The high level of the harmonic distortion below 150Hz is caused by voice coil displacement x activating the stiffness Kms(x) or force factor nonlinearity Bl(x). The displacement varying inductance L(x) can only generate low values of THD in a narrow frequency range just above resonance (150-200Hz).
The inductance nonlinearity L(i) varying with current i may contribute to the THD at higher frequencies. The distinct peak in THD at 2kHz is caused by a nonlinear vibration of the cone and surround after break-up.
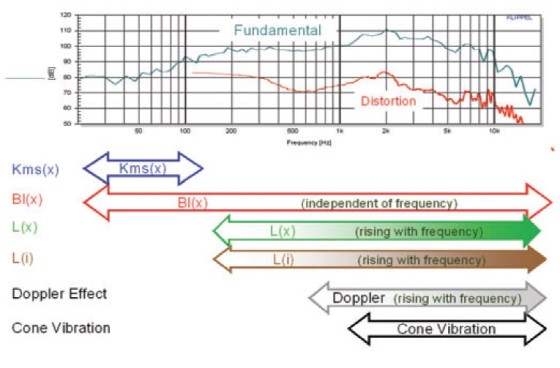
Unfortunately, harmonic distortion measurement does not give a comprehensive picture of the large signal performance of loudspeaker systems. At least a second tone is required to generate intermodulation products which occur at difference and sum frequencies in all possible combinations of the excitation frequencies. Increasing the number of fundamental components in multi-tone stimulus will generate more and more intermodulation components spreading over the complete audio band. Contrary to the THD response in Fig. 9, the nonlinear force factor Bl(x) and the inductance L(x) THD generate significant intermodulation distortion at higher frequencies as illustrated in Fig. 10.
Thus, harmonic distortion measurements using a single test tone are not sufficient for assessing loudspeakers comprehensively and predicting the large signal performance for complex stimuli like music.
Impact on Perceived Sound Quality
The reproduced sound quality as perceived by a listener is one of the most important criteria for the preference of an audio product. Systematic subjective evaluation requires a double-blind test strategy and psychometrical tools for assessing the sensations reliably and quantitatively. Such tests are time-consuming and expensive and the results depend on the particular listening condition (room, program material) and the training of the listeners.
Thus it is desirable to predict those subjective sensations based on objective measurements and perceptive modeling considering the interactions between stimulus, loudspeaker, room, ear, and the listener’s training and expectations.
There are two alternative approaches using different sources. One is based on personal listening experience, vague speculations, or even myths. This reflects the heritage of accumulated knowledge, which is difficult or impossible to verify by science. Exploiting this expertise is beneficial as long as it is combined with a critical attitude and some common sense. Wrong conceptions will die eventually and the falsification of those ideas are interesting research topics which accelerate this clarification.
The other approach is based on facts accumulated by psychoacoustical research modeling the basic processing in the ear. Unfortunately, there are still many open questions how to apply the results of those fundamental experiments to sound reproduction of natural audio signals.
Figure 11 gives an overview of the current objective methods on assessing the sound quality of loudspeaker systems. The parameter-based method relies on loudspeaker characteristics such as lumped and distributed parameters which are independent of the stimulus. The interpretation of harmonic distortion and other nonlinear distortion belongs to the stimulus-based method which considers the properties of a particular stimulus, position of the listening position, and the influence of the acoustical environment.
The linear and nonlinear distortions separated from undistorted stimulus are the input of the following psychoacoustical model considering generating basic perceptual attributes (loudness, sharpness, roughness) and overall judgments describing the pleasantness of the sound and preference considering the ideal conceptions of the listener(10).
The psychoacoustical model performs a binaural nonlinear processing in which a significant part of the distortion component is masked by other signal components. The following main mechanisms are summarized and consequences for interpreting objective measurements are discussed:
• Spectral components within third-octave bandwidth contribute to the same excitation level above 400Hz. Smoothed amplitude response describes the perception of stimuli having a dense spectrum (e.g., pink noise). The shape of a resonance (gain, Q factor) has a minor influence on audibility as long as the excitation within the critical band is constant6.
• Spectral components below 100Hz contribute to the excitation level of one critical band. Sufficient bass sensation can be generated by higher frequencies (60…100Hz) when the very low frequency components (20…40Hz) are attenuated by the cutoff frequency of the loudspeaker.
• A variation larger than 1dB in the excitation level within a critical band becomes audible.
• Spectral masking excites adjacent bands. Dips in the frequency response are less audible than peaks. Nonlinear distortion components are masked by fundamental components(7).
• Temporal masking. The RMS value (rather than the peak value) determines the audibility of the regular nonlinear distortion.
• Hearing threshold. Bass components are not audible if the listening level is too low. A small level difference of components close to the hearing threshold may cause a significant difference in perceived bass sensation and in the detection of nonlinear distortion.
• Monaural processing is not very sensitive for phase shift of signal components processed in separate critical bands. Phase distortion corresponding with a group delay variation of 0.4…2ms within a critical band changes the timbre and roughness of the sound.
• Binaural processing(5) is sensitive for interaural level differences (1…2dB) and time delay (50μs). Latency and group delay response should be identical in the symmetrical channels of a multi-way system to avoid lateralization of the perceived sound image.
• Precedence effect(4) maintains the primary image as long as the lateral reflections are sufficiently low or the time delay is small. Strong reflections after 80ms are unpleasant and are perceived as echo.
• Audible lateral reflections may generate a preferred sensation of spaciousness and a broadening of the primary image(12); the optimal delay and level depend on the property’s audio signal (20ms delay for speech or 40ms for music and reflections having the same level as the direct sound). Early reflections as found in relatively small rooms improve sound quality; artificial generation of lateral reflections may be desired in an anechoic environment or small rooms (cars).
• Adaptation(6) to the acoustical environment causes a variation of the ideal conceptions versus time. The listener becomes less sensitive to linear distortion caused by room and loudspeaker after some time.
• Intermodulation distortion is detected by the ear not only by exploiting spectral but also temporal clues. Amplitude modulation is much more audible than frequency modulation and is perceived as fluctuation (modulating bass tone f1 < 20Hz) or roughness at higher frequencies (20Hz < fb < 400Hz) or separated spectral components (> 400Hz). Low amplitude intermodulation distortion at 1-3% caused by nonlinear force factor Bl(x) and inductance L(x) is detected as an unnatural roughness.
Auralization Techniques
Although the perceptive modeling gives valuable insight into fundamental psychoacoustical mechanisms and basic sound attributes, it is not very accurate in predicting the overall assessment of the perceived sound quality and in the preference of an audio product at the current state. The ideal conceptions of a listener highly depend on training, listening habits, fashion, cultural factors, and artistic properties of the program material. Some linear and nonlinear distortion is clearly audible but may be acceptable for a particular application and program material (popular music) or may even be perceived as an interesting effect (artificial bass enhancement). The reliable evaluation of those criteria requires systematic listening tests using modern auralization techniques(8), (9).
Figure 12 shows a digital signal processing system based on loudspeaker modeling to generate a virtual audio system. This model has a sandwich structure in which a nonlinear system modeling the dominant nonlinearities in the electrodynamical transducer is embedded by linear systems.
The first linear system corresponds with the electrical signal path from the source to the loudspeaker terminals, while the second linear system models the signal path in the mechanical and acoustical domain where the amplitude is relatively small and the sound propagation is sufficiently linear. This technique is a convenient tool for investigating design choices before a first prototype is made and combines subjective and objective evaluation.
Conclusions
Linear and nonlinear distortion is unavoidable in current electroacoustical transducers using a moving coil assembly driving diaphragms, cones, and other radiators. The regular distortion is deterministic and can be predicted by using linear and nonlinear models and identified loudspeaker parameters in an early design stage. Finding acceptable limits for those regular distortions is an important part in defining the target performance at the beginning of loudspeaker development.
Subjective evaluation is required to assess the audibility and the impact on perceived sound quality. Some distortions which are audible might still be acceptable or even desirable in some applications. Systematic listening tests, nonlinear auralization, and objective assessment based on a perceptual model are useful tools to assess regular distortion.
References
1. Klippel, W.; Schlechter, J.: “Distributed Mechanical Parameters of Loudspeakers Part 1: Measurement,” J. Audio Eng. Society 57, No. 9 pp. 696-708 (2009 Sept.).
2. Klippel, W.; Schlechter, J.: “Distributed Mechanical Parameters of Loudspeakers Part 2: Diagnostics,” J. Audio Eng. Society 57, No. 9 pp. 696-708 (2009 Sept.).
3. Klippel, W.: Tutorial: “Loudspeaker Nonlinearities - Causes, Parameters, Symptoms,” J. Audio Eng. Society 54, No. 10 pp. 907-939 (2006 Oct.).
4. Zwicker, E.; Fastl, H: Psychoacoustics – Facts and Models. Springer, Berlin, 1999, ISBN 3-540-65063-6.
5. 5. Blauert, J.: “Spatial Hearing,” Hirzel Verlag, MIT, 1997.
6. Toole, F. E.; Sound Reproduction, Focal Press, Amsterdam, 2008.
7. Gäßler, G; “Die Grenzen der Hörbarkeit nichtlinearer Verzerrungen bei der Übertragung von Instrumentenklängen,” Frequenz, Volume 9 (1955), Nr. 1, pages 15–25.
8. Klippel, W: “Speaker Auralization – Subjective Evaluation of Nonlinear Distortion,” presented at the 110th Convention of the Audio Eng. Soc., Amsterdam, May 12-15, 2001, preprint 5310, J. of Audio Eng. Soc., volume 49, No. 6, 2001 June, p. 526. (abstract).
9. Klippel, W.: “Auralization – Subjective Evaluation of Speaker Distortion,” Fortschritte der Akustik - Plenarvorträge und Fachvorträge der 27. Jahrestagung für Akustik DAGA 01, Hamburg, 2001.
10. Klippel, W: “Multidimensional Relationship between Subjective Listening Impression and Objective Loudspeaker Parameters,” Acustica 70, Heft 1, S. 45-54, 1990.
11. Klippel, W.: “Zusammenhang zwischen objektiven Lautsprecherparametern und subjektiver Qualitätsbeurteilung,” Beitrag in Angewandte Akustik 1, S. 46-101, Verlag Technik Berlin, 1987.
12. Ando, Y.: “Subjective Preference in Relation to Objective Parameters of Music Sound Fields with a Single Echo,” J. Acoust. Soc. Am. 62, pp. 1436.