Test Bench: The SIG180-4 6.5” Woofer from Dayton Audio’s Signature Series
July 10 2024, 14:10
Dayton Audio’s SIG180-4 is part of a woofer series with five cost-effective, high-performance models, ranging from 4” to 10”. All drivers include single-piece concave aluminum cones, polyimide vented voice coil formers, open cast-aluminum frames, plus indexed shallow transition NBR surrounds. Rated for 80W RMS power handling capacity, the SIG180-4 woofer features a FEA-optimized ferrite motor design and a 1.25” voice coil wound with round copper wire.
The transducer in this explication came from Dayton Audio’s new Signature Series woofer line. Dayton Audio’s Signature Series consists of five woofer models ranging from 4” to 10”, with the stated goal of being cost-effective, high-performance “audiophile” quality woofers. As you would expect, these drivers have a set of common features that include single-piece concave aluminum cones, magnetically non-conducting polyimide vented voice coil formers, aluminum shorting rings, open cast-aluminum frames, plus indexed shallow transition NBR surrounds.
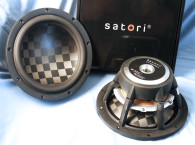
Photo 1: The new Dayton Audio SIG180-4 midbass driver.
This month, Dayton Audio sent the 6.5” model from its new Signature Series transducer line-up, the 6.5” SIG180-4 midwoofer (Photo 1). Applications for the SIG180-4 include uses as a woofer in a two-way speaker, or as a midrange in a multi-way speaker.
Features include a lightweight inverse curved profile single piece black anodized aluminum cone (no dust cap), a proprietary cast-aluminum frame that uses six narrow tapered (11mm×6mm) spokes to minimize reflections back into the cone, plus 80W RMS power handling capacity.
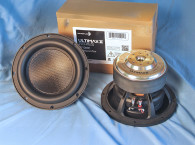
Cooling is provided by a 0.44” (11.2mm) diameter flared pole-type vent, plus 12 20mm×10mm vents located below the spider mounting shelf (Photo 2). Compliance is controlled by a 12mm wide NBR (CBR) type surround that has a very shallow transition to the cone, and a 4” diameter elevated cloth spider.
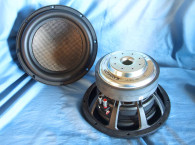
The motor assembly is powered by a FEA-optimized motor design utilizing a 100mm diameter 18mm thick ferrite ring magnet sandwiched between the milled and polished 6mm thick front plate and T-yoke. The motor assembly also incorporates an aluminum shorting ring (Faraday shield) around the inside diameter of the ring magnet (Photo 3). Driving the cone assembly is a voice coil that consists of a 31.8mm (1.25”) diameter vented polyimide former wound with round copper wire. Voice coil tinsel lead wires terminate to a pair of solderable gold-plated terminals.
Photo 2: Close up view of the Dayton Audio SIG180-4 motor and neck joint.
Photo 3: Cutaway view of the Dayton SIG180-4 motor structure.
Testing began with the driver clamped to a rigid test fixture in free air and using the Physical LAB IMP Box (same type fixture as a LinearX VI Box) produced both voltage and admittance (current) curves at 0.3V, 1V, 3V, 6V, 10V, and 15V. The 15V curves were close to making a useful curve fit, however I discarded them. I used the remaining 10 10Hz to 20kHz 550-point stepped sine wave curve pairs for each sample, which I post-processed. Then, I divided the voltage curves by the current curves creating the five impedance curves. I applied the LMS phase calculation procedure to the impedance curves and imported all 10 curves along with the voltage curve for each sweep into the LEAP 5 Enclosure Shop CAD software.
Since most Thiele-Small (T-S) data provided by OEM manufacturers is produced employing either a standard T-S model or the LinearX LEAP 4 TSL model, I additionally created a LEAP 4 TSL model using the 1V free-air curves. (Please note, that even though LinearX is no longer in business after the unfortunate passing of chief engineer and founder Chris Strahm seven years ago, LEAP 5 is still one of the best driver parameter generators ever devised and will continue to be used in Test Bench until I find some other software that is as accurate at predicting high voltage excursion as Strahm’s multi-voltage LTD model.)
I selected the complete curve set, the multiple voltage impedance curves derived from the LTD model, and the 1V impedance curves for the TSL model in the transducer derivation menu in LEAP 5 and created the parameters for the computer box simulations. Figure 1 shows the 1V free-air impedance curve. Table 1 compares the LEAP 5 LTD and TSL data and factory parameters for both Dayton Audio SIG180-4 samples.
Table 1: Comparison data for the Dayton SIG180-4 Midrange/Woofer.
T-S parameter results for the Dayton Signature Series SIG180-4 were close to the factory data, with some variance in the Vas and SPL. Part of the variation is due to the difference in Sd calculation, a fairly sensitive parameter. The criteria used for Test Bench is to calculate Sd from the diameter of the cone plus half of the surround width on each side of the cone assembly. That said, I followed my standard protocol and proceeded to program computer enclosure simulations using the LEAP LTD parameters for Sample 1. I used LEAP 5 Enclosure shop to generate enclosure volumes, which were similar to the recommended enclosures from the Parts Express website. The first is a 0.25ft3 Butterworth sealed box with 50% fiberglass fill material, plus an Extended Bass Shelf (EBS)-type vented alignment using 0.67ft3 box tuned to 45Hz and with 15% fiberglass fill material.
Figure 2 depicts the results for the SIG180-4 in the sealed and vented boxes at 2.83V and at a voltage level sufficiently high enough to increase cone excursion to Xmax+15% (5.75mm for the SIG180). This calculation resulted in an F3 frequency of 82Hz (F6=65Hz) with a Qtc=0.65 for the 0.25ft3 sealed enclosure and –3dB=46Hz (F6=40Hz) for the 0.67ft3 vented box simulation. Increasing the voltage input to both simulations until the maximum linear cone excursion was reached resulted in 106.5dB at 25.5V for the smaller sealed enclosure and 107.5dB at 27.25V input level for the larger vented box. Figure 3 shows the 2.83V group delay curves. Figure 4 shows the 25.5V/27.25V excursion curves.
Figure 3: Group delay curves for the 2.83V curves shown in Figure 2.
Figure 4: Cone excursion curves for the 25.5/27.25V curves shown in Figure 2.
Klippel analysis for the Dayton Audio SIG180-4 produced the Bl(X), Kms(X) and Bl and Kms symmetry range plots given in Figures 5-8. The Klippel data this month was supplied by Dayton on a Klippel KA3 analyzer, as Redrock Acoustics was unavailable at the time this issue was being created.
The SIG180 6.5” woofer’s Bl(X) curve (Figure 5) is moderately broad and symmetrical as you would expect for a moderate Xmax (5.0mm) 6.5” driver. Looking at the Bl symmetry plot (Figure 6), this curve is offset a trivial 0.05mm coil-out at the position of reasonable certainly (3mm) and mutating to a 0.05mm coil-in offset at the 5mm physical Xmax of the driver.
Figure 5: Klippel Analyzer Bl (X) curve for the Dayton Audio SIG180-4.
Figure 6: Klippel Analyzer Bl Symmetry Range curve for the Dayton Audio SIG180-4.
Figure 7 and Figure 8 give the Kms(X) and Kms symmetry range curves for the SIG180-4. The Kms(X) curve is not as symmetrical, and with a relatively small amount of coil-in offset. Looking at the Kms symmetry range curve (Figure 8), there is 1.5mm coil-in offset at the physical Xmax of the driver. Displacement limiting numbers calculated by the Klippel analyzer for the Dayton Audio SIG180-4 was XBl @ 82% Bl=5.2mm and for XC @ 75%, Cms minimum was 7.4mm, which means that for the SIG180-4, the Bl was the most limiting factor at the prescribed distortion level of 10%, however both numbers exceeded the physical Xmax number.
Figure 7: Klippel Analyzer Mechanical Stiffness of Suspension Kms(X) curve for the Dayton Audio SIG180-4.
Figure 8: Klippel Analyzer Kms Symmetry Range curve for the Dayton Audio SIG180-4.
Figure 9 gives the SIG180-4’s inductance curve L(X). Inductance will typically increase in the rear direction from the zero-rest position as the voice coil covers more pole area, which is what you see in the inductance graph. However, the inductance swing is only 0.11mH from Xmax in to Xmax out, so for a single aluminum shorting ring, nice inductive performance.
Figure 9: Klippel Analyzer L(X) curve for the Dayton Audio SIG180-4.
For the remaining series of SPL measurements I mounted the SIG180-4 in an enclosure with a 12”×8” baffle area and foam damped inside volume. Then, I measured the driver frequency response using the Loudsoft FINE R+D analyzer and the GRAS 46BE microphone (courtesy of Loudsoft and GRAS) both on- and off-axis from 300Hz to 20kHz with a 1/6 octave smoothing (to simulate the 100-point LMS resolution used for years in this column) at 2V/0.5m (normalized to 2.83V/1m) using the cosine windowed FFT method. Figure 10 depicts the SIG180-4 on-axis response, yielding a very smooth rising ± 1.0dB response from about 200Hz to 2.5kHz followed by a smooth transition to the transducers second-order asymptotic slope.
Figure 10: Dayton Audio SIG180-4 on-axis frequency response.
Figure 11 illustrates the on- and off-axis frequency response at 0°, 15°, 30°, and 45°. The -3dB at 30° with respect to the on-axis curve occurs at 2.2kHz, which suggests a likely crossover point of 2.0 kHz to 2.5kHz would be appropriate for the SIG180-4. Figure 12 gives the normalized version of Figure 11. Figure 13 shows the CLIO Pocket (courtesy of Audiomatica SRL) generated horizontal plane polar plot (in 10° increments with 1/3 octave smoothing applied). And last, Figure 14 gives the two-sample SPL comparisons for the Dayton Signature Series 6.5” driver, showing both samples very closely matched ≤0.25dB throughout the operating range of the driver, with a 1dB variation in the vicinity of 2.5kHz.
Figure 11: Dayton Audio SIG180-4 horizontal on- and off-axis frequency response (0°=black; 15°=blue; 30°=green; 45°=purple).
Figure 12: Dayton Audio SIG180-4 normalized on- and off-axis frequency response (0°=black; 15°=blue; 30°=green; 45°=purple).
Next, I fired up the Listen SoundCheck analyzer using SoundCheck 21 software and the AudioConnect interface along with the ¼” SCM measurement microphone (provided courtesy of Listen, Inc.) and set it up for distortion measurements. The SPL at 1m for the SIG180-4 mounted in free air using a noise stimulus was set to 94dB (5.3V) at 1m, my standard for home audio devices. The SIG180-4 produced the distortion curves shown in Figure 15.
Following the distortion measurements, I mounted the SIG180-4 in the same 12”×8” baffle enclosure used for the frequency response measurements and performed the time domain measurements starting with the impulse response. This was imported into Listen’s SoundMap software, windowed to remove the room reflections, which produced the cumulative spectral decay (CSD) waterfall plot (Figure 16) and the Wigner-Ville plot (Figure 17).
It appears that Dayton Audio has achieved its goal of producing a competitive transducer with the build quality, features, and performance of significantly more costly high-end 6.5” woofers at a significantly lower price (online Parts Express’ retail price for this driver is $49.95). You’ve got to admire that! For more information about the new Dayton Signature Series woofers and other Dayton Audio drivers, visit the website at www.daytonaudio.com or the Parts Express website at www.parts-express.com. VC
This article was originally published in Voice Coil, March 2024
About Vance Dickason
Vance Dickason has been working as a professional in the loudspeaker industry since 1974. A contributing editor to Speaker Builder magazine (now audioXpress) since 1986, in November 1987 he became editor of Voice Coil, the monthly Periodical for the Loudspeake... Read more